Why ASX Gold Stocks Fell 7% While Gold Futures Stayed Flat
4 hrs ago

The Bank of Japan just raised rates to their highest level in three decades, and the yen is still falling. That single fact captures everything you need to know about how global capital flows actually work.
The contradiction is not a policy failure. It is a textbook demonstration of what happens when one central bank’s rate sits at 1% while the U.S. Federal Reserve holds its target range at 3.5%-3.75%. As long as that gap exists, investors have a structural incentive to borrow cheap yen and deploy it into higher-yielding assets elsewhere. The strategy has a name: the yen carry trade. And in June 2026, it is as alive as ever.
What follows here is how the trade works mechanically, why Japan became the world’s cheapest source of funding, what it costs ordinary Japanese households in real purchasing power, and what you need to understand before the trade reverses. If you hold any global equity, bond, or emerging-market exposure, this directly affects your portfolio, whether you realise it or not.
A carry trade is a leveraged spread strategy. You borrow where interest rates are low, invest where they are high, and pocket the difference. The yen version of this trade has four steps, and walking through them in order is the fastest way to understand why the BoJ’s rate hike has not stopped it.
The implied carry spread is approximately 2.5%-2.75% before currency and hedging costs.
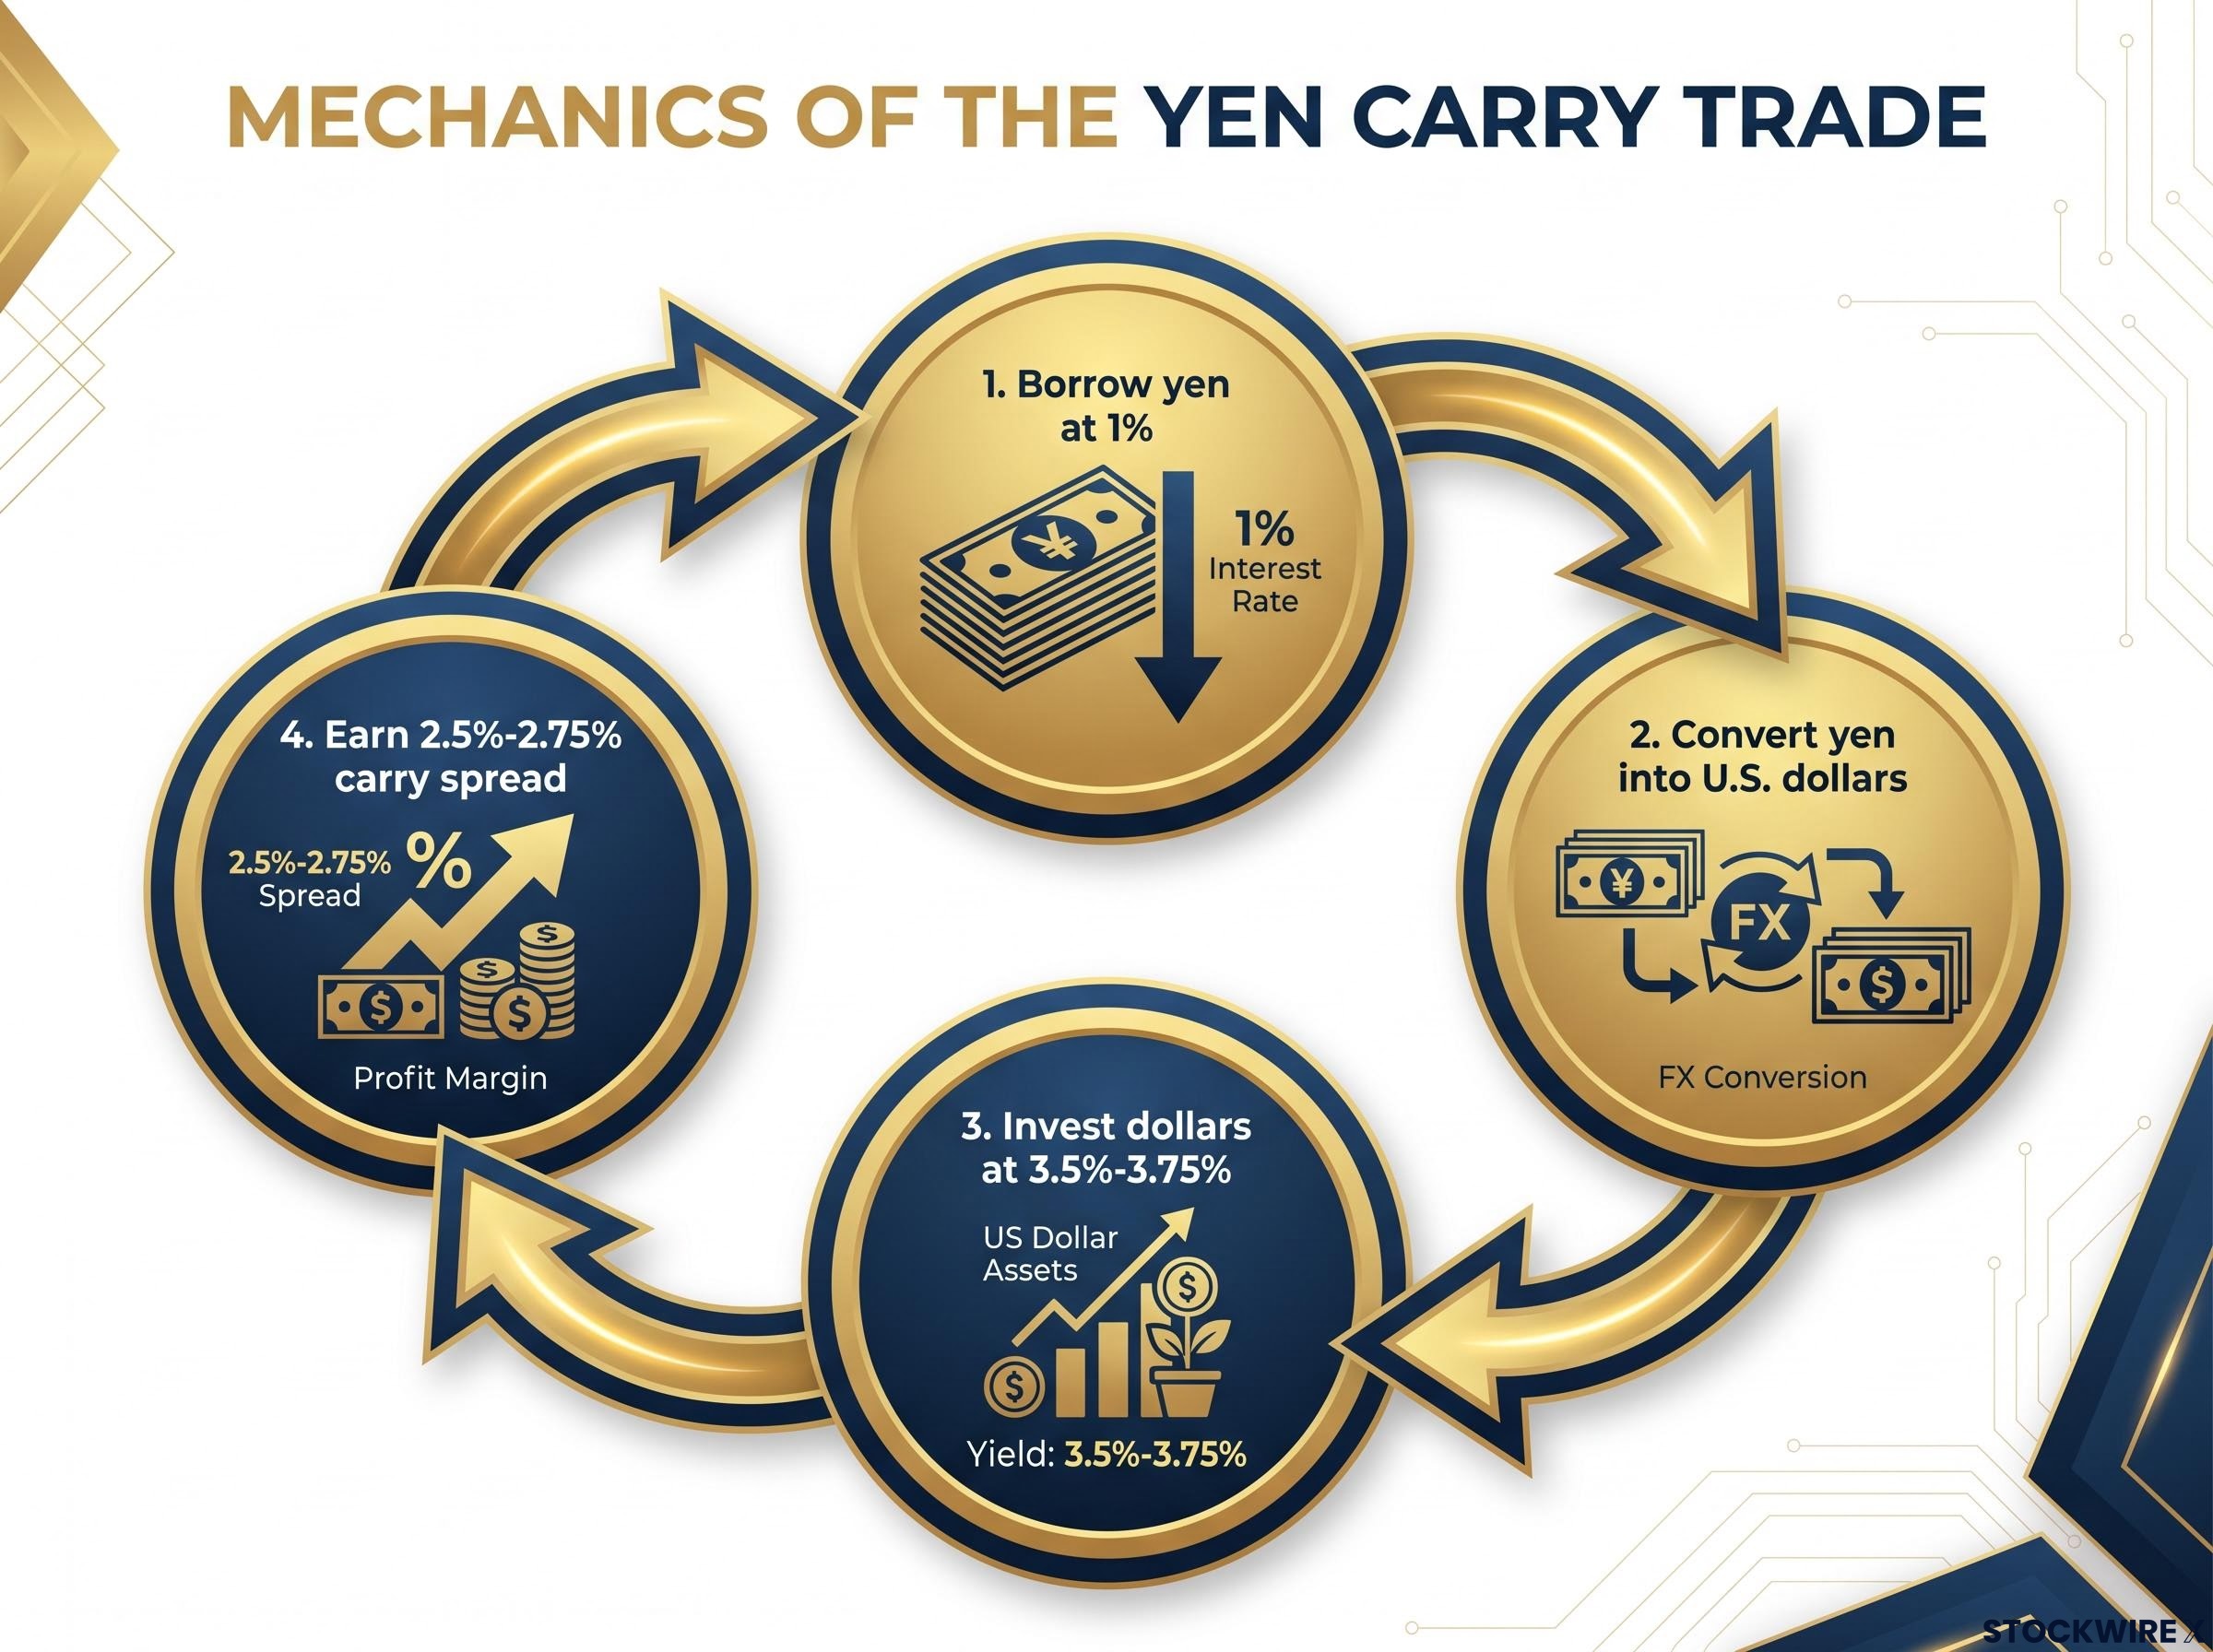
That spread sounds modest on its own. But carry trades are leveraged. At scale, a 2.5% annualised spread on billions of dollars in borrowed yen produces enormous returns, and that persistent incentive is something no single BoJ policy adjustment has yet been able to neutralise.
The Federal Reserve’s June 2026 rate decision confirmed the federal funds target range at 3.5%-3.75%, the level that defines the yield differential underpinning the carry spread available to yen-funded investors.
The trade works smoothly as long as the yen stays stable or weakens further. The danger arrives when conditions flip. Leverage amplifies gains on the way in and losses on the way out, which is why carry unwinds can be sudden and severe. But before you can understand the unwind, you need to understand why Japan became the world’s go-to funding currency in the first place.
The yen’s role as a cheap funding currency did not emerge overnight. It was built over three decades of deliberate policy choices, and the scale of what accumulated during that period is what makes the current situation so difficult to reverse.
When Japan’s asset bubble collapsed in the early 1990s, the BoJ responded by cutting rates toward zero, and then keeping them there. For most of the period between the mid-1990s and 2022, the BoJ’s policy rate sat at or near zero, and at times went negative. During the same window, the Federal Reserve, the European Central Bank, and other major central banks cycled through normal rate environments ranging from roughly 1% to 5% depending on conditions.
That persistent, multi-decade gap created a structural invitation. Global investors responded by borrowing yen at negligible cost and deploying the proceeds across global bonds, equities, and emerging-market debt. This was not a niche hedge-fund strategy. Institutional investors, sovereign wealth funds, and large asset managers all used yen funding at scale. Trillions in yen-funded positions accumulated over time, embedding yen borrowing into the architecture of global capital flows.
Nomura analysts have assessed yen weakness as an ongoing structural condition rather than a transient aberration, a framing that reflects the depth of the entrenchment.
The BoJ’s move to 1%, its highest rate since 1995, narrowed the gap with other central banks. It did not close it. For carry traders, the question that matters is always the relative return, not the absolute rate level.
The June 2026 BoJ decision delivered a 25-basis-point hike to 1.0% via a 7-1 board vote, accompanied by a structured JGB tapering schedule that reduces monthly bond purchases by roughly 200 billion yen per quarter through March 2027, compressing the carry trade’s cost advantage from both the rate and the liquidity side simultaneously.
Think of it as two salaries. A job paying 1% is better than one paying 0%, but when the alternative still pays 3.5%-3.75%, the incentive to work in the higher-paying market remains powerful. The BoJ has made yen borrowing more expensive than it was. It has not made yen borrowing expensive enough to offset the returns available elsewhere.
The mechanics of the carry trade are abstract until you see what they do to people who live in yen. Japan imports almost all of its oil and liquefied natural gas, and those commodities are priced in U.S. dollars. Every unit of yen depreciation makes energy more expensive in yen terms, and those costs cascade through transport, manufacturing, and services into the prices ordinary households pay.
The May 2026 data makes the transmission visible.
| Cost category | Year-on-year change | Reference period |
|---|---|---|
| Ocean freight costs | +61.8% | May 2026 |
| International air passenger fares | +17.3% | May 2026 |
| Services producer prices | +3.3% | May 2026 |
Ocean freight costs up 61.8% in a single year. That figure alone tells you the yen’s weakness is not an abstract market phenomenon; it is showing up in the cost of every imported good that travels by sea.
The 3.3% rise in services producer prices signals something important: the pressure has moved beyond imported goods into the broader domestic economy. Higher fuel costs feed into logistics, which feed into retail, which feed into the services that make up most of daily household spending.
These are not abstract price statistics. They represent a direct transfer of purchasing power from Japanese households to global energy markets and foreign asset holders. That transfer is increasingly a political flashpoint for the Japanese government, and it creates pressure on the BoJ to act more aggressively, a dynamic that directly shapes the carry trade’s future trajectory.
If yen weakness hurts households and the BoJ controls interest rates, the obvious question is: why not just raise rates high enough to close the gap? The answer is that carry unwinds are not orderly exits. They are feedback loops, and the BoJ is caught between two genuinely bad options.
Here is what happens when a carry trade starts to reverse. The yen strengthens, or volatility spikes, and traders move to close their short-yen positions. They buy back yen to repay their borrowings, which pushes the yen higher. Simultaneously, they sell the foreign assets that were funded by yen borrowing, which depresses prices in those markets. The rising yen forces more traders to deleverage, creating a self-reinforcing spiral of yen buying and asset selling that can move across currencies, equities, bonds, and emerging markets in a matter of hours.
In August 2024, a sharp yen-driven unwind demonstrated exactly this feedback loop. A surprise BoJ policy signal triggered rapid carry position closures, and the resulting yen appreciation hit global equities simultaneously. Assets that appeared unrelated on the surface sold off together, connected by the common thread of yen-funded positioning.
Intervention risk signals, including official rhetoric escalation, AUD/USD divergence from USD/JPY, and broad cross-JPY weakness, can alert traders to a carry unwind before formal action is confirmed, giving portfolio managers a narrow but actionable window to reduce exposure ahead of the most disruptive phase of any deleveraging episode.
The BoJ faces three constraints that prevent it from simply hiking its way out of the problem:
The gap between the BoJ’s 1% and the roughly 3.5%-3.75% that would be needed to match the Fed is enormous. Closing it quickly would risk all three of these consequences simultaneously. For you, the risk is not limited to Japan: a carry unwind triggered by a BoJ surprise would likely produce correlated selling across assets in your portfolio that appear completely unrelated on the surface. That is the hidden systemic dimension most investors miss.
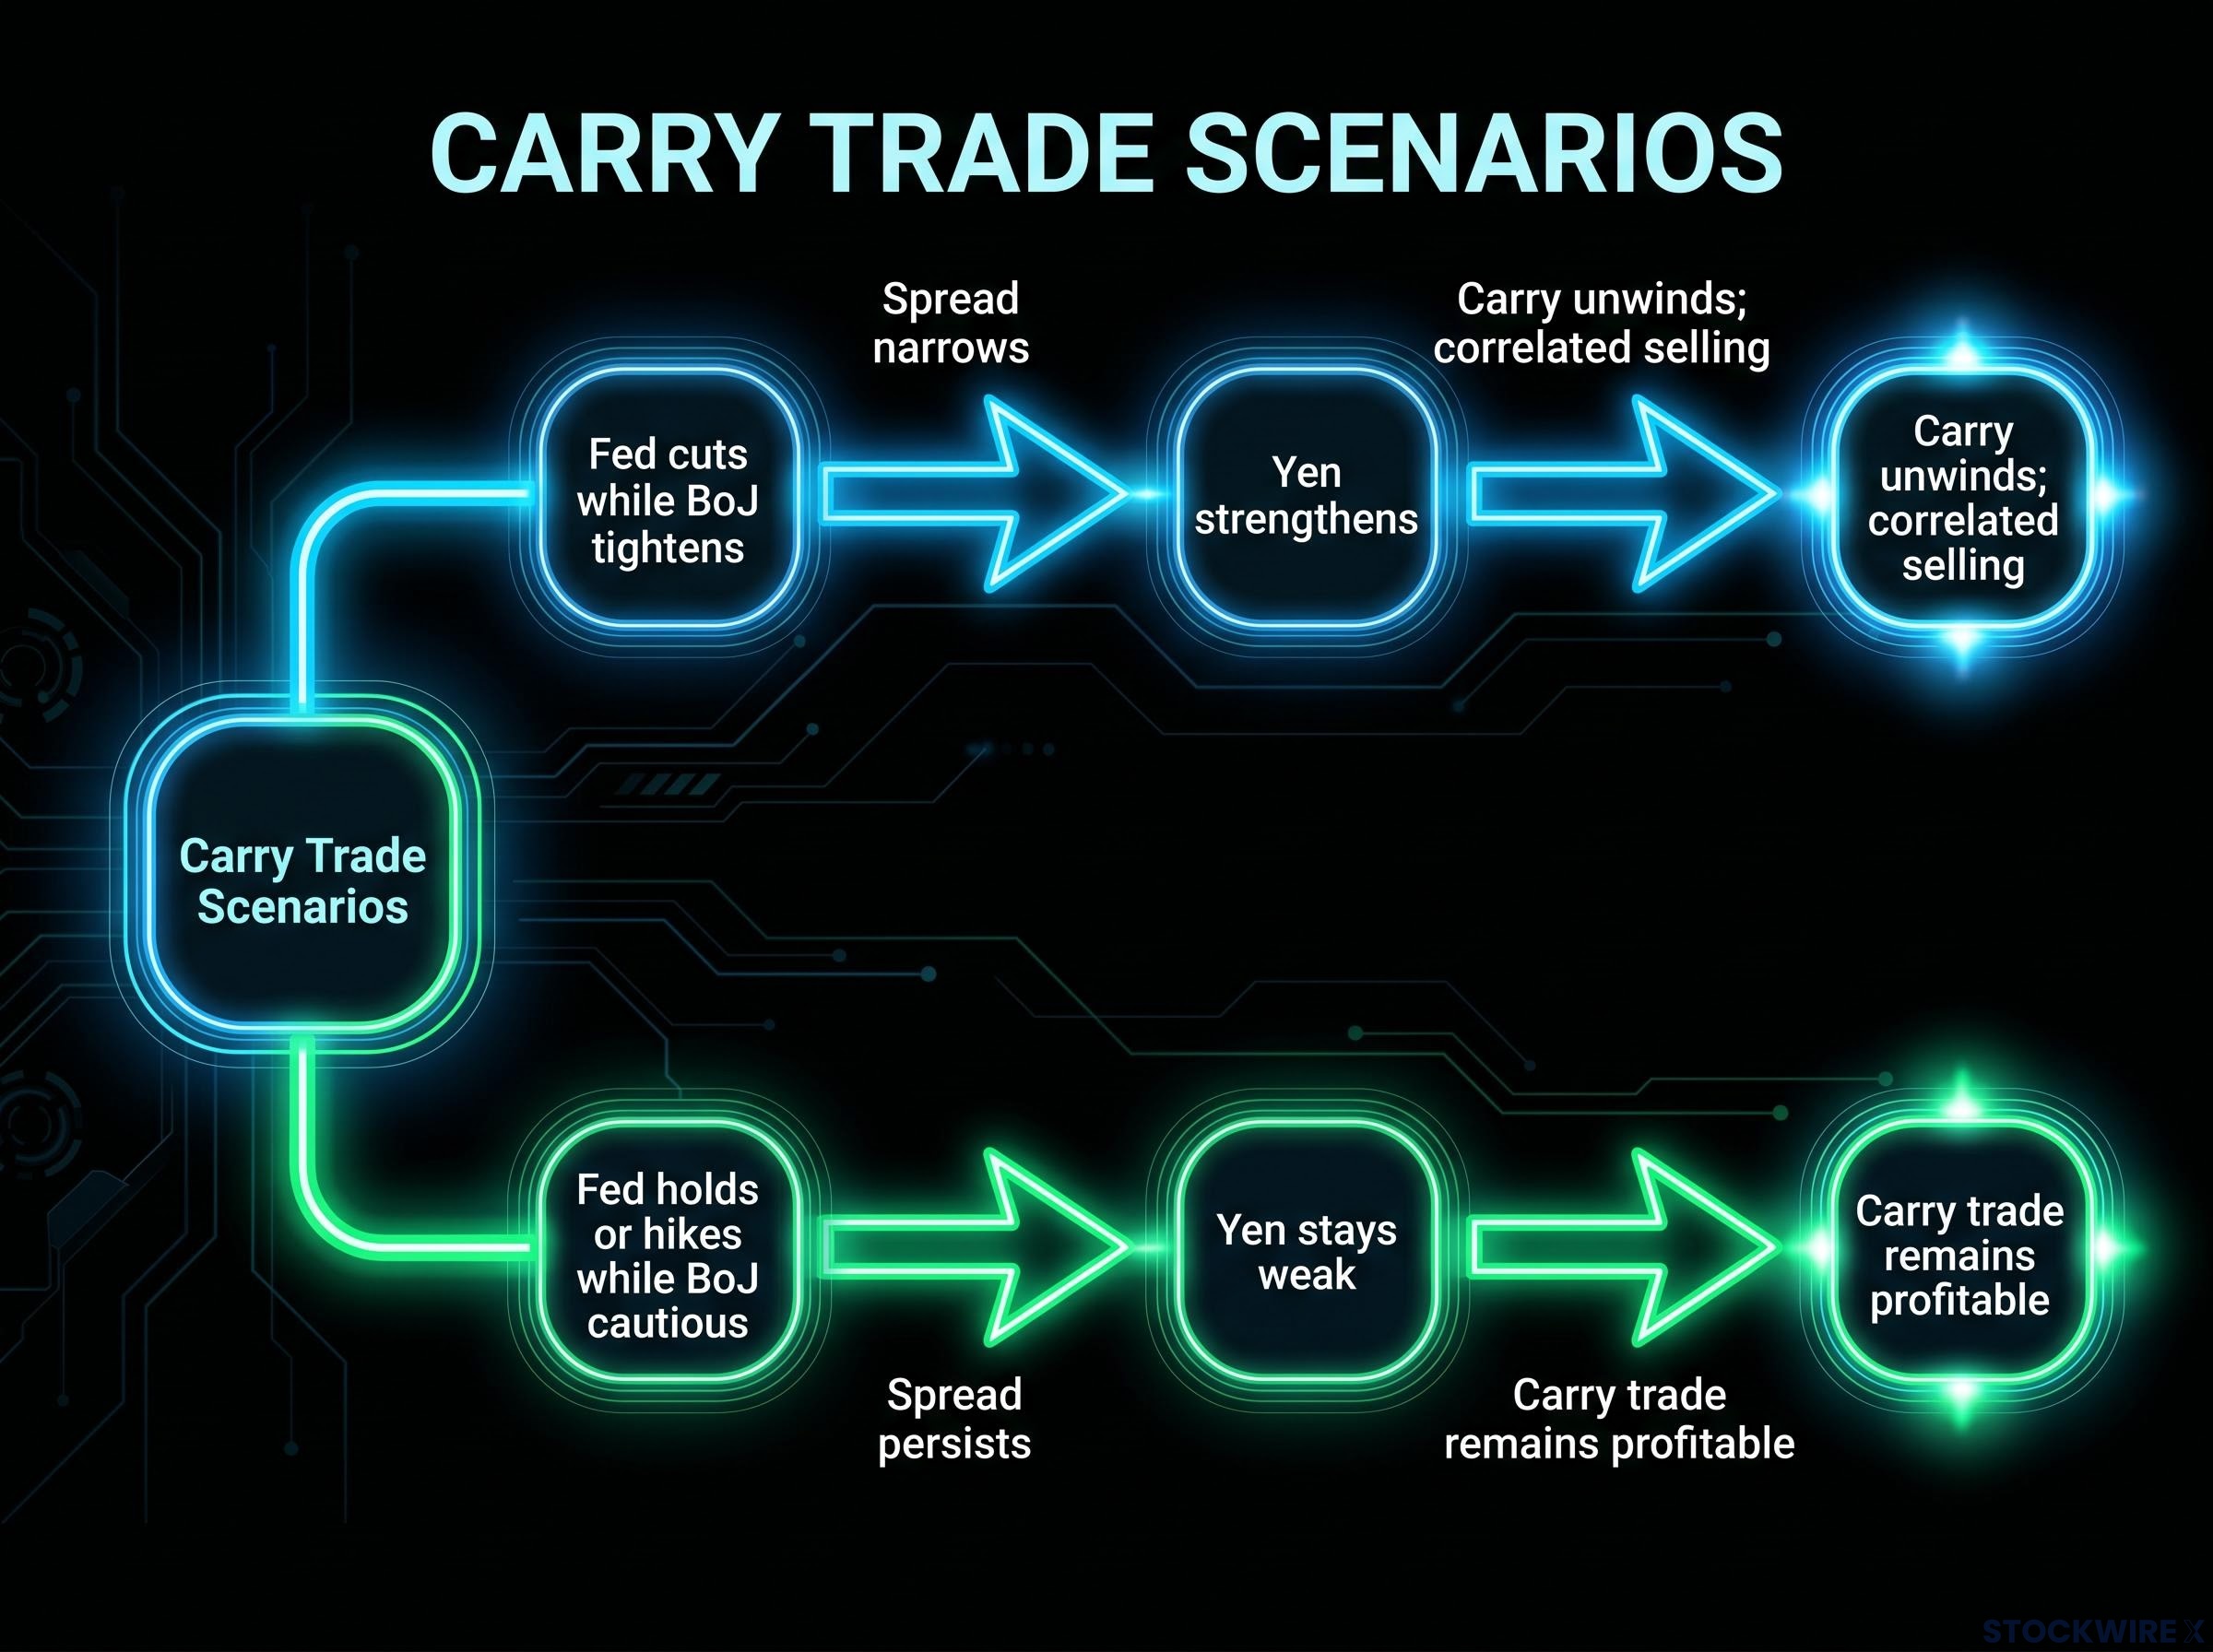
The single most important variable for yen direction is not Japan’s absolute rate level. It is the spread between the Fed’s rate and the BoJ’s rate. That spread determines whether the carry trade remains profitable or starts to break down, and it gives you two concrete scenarios to frame your own monitoring.
| Scenario | Impact on carry spread | Likely yen direction | Implication for global assets |
|---|---|---|---|
| Fed cuts while BoJ tightens | Spread narrows | Yen strengthens | Carry positions unwind; correlated selling risk rises |
| Fed holds or hikes while BoJ moves cautiously | Spread persists | Yen stays weak | Carry trade remains profitable; positions continue building |
The implications extend across three categories of investor exposure:
BoJ policy meetings are now global market events. Even if you hold no direct Japan allocation, the systemic role of yen-funded positions means that any surprise hawkish shift from the BoJ can reprice risk assets across geographies within hours. Any allocation to Japan should be evaluated on both the underlying equity thesis and the currency strategy you select.
For investors ready to act on a narrowing carry spread rather than simply monitor it, our full explainer on non-dollar currency positioning covers UBS’s specific currency recommendations, the carry yields available before dollar weakness materialises, and the key timing variables that determine which currencies capture the most upside from a BoJ-driven yen recovery.
The yen is weak not because the BoJ has failed. It is weak because relative interest rate differentials, not absolute levels, drive currency direction in an interconnected global market. The BoJ’s current rate of 1% is the highest since 1995, and it is still not enough, because three decades of near-zero rates built a funding architecture that cannot be dismantled by one central bank acting alone.
Nomura’s framing of yen weakness as a structural condition rather than a temporary distortion captures the reality. The BoJ faces a currency trap: moving too slowly keeps the yen weak and imports costly; moving too fast risks destabilising both Japan’s economy and global markets. The exit from three decades as the world’s funding currency cannot be unilateral.
The yen’s direction is determined by the relative differential between the BoJ and the Fed, not by Japan’s absolute rate level. That is the single indicator worth tracking.
For you as a global investor, the practical implication is straightforward. Watching the next BoJ rate decision in isolation is less useful than tracking the relative trajectory of both central banks together. The carry trade only breaks when the gap closes, not when either rate moves in absolute terms. The current spread of approximately 2.5%-2.75% tells you exactly how much room remains before the maths of the trade stops working, and by extension, before the positions that depend on it start to unwind.
For investors wanting a structured checklist rather than a conceptual framework, our dedicated guide to yen carry trade warning signals maps the three specific conditions that preceded the 2024 episode and identifies which of those conditions are already active in mid-2026.
This article is for informational purposes only and should not be considered financial advice. Investors should conduct their own research and consult with financial professionals before making investment decisions.
These statements are speculative and subject to change based on market developments and central bank policy decisions. Past performance does not guarantee future results.
The yen carry trade is a leveraged strategy where investors borrow yen at Japan's low interest rates, convert the proceeds into higher-yielding currencies like the U.S. dollar, and invest in assets such as Treasuries or money-market funds to earn the rate differential as profit.
The BoJ's rate of 1% is still far below the Fed's 3.5%-3.75% target range, leaving a carry spread of approximately 2.5%-2.75% that makes yen borrowing profitable; absolute rate levels matter less than the relative differential between central banks.
When the yen strengthens or volatility spikes, carry traders buy back yen to repay borrowings and simultaneously sell foreign assets, triggering correlated selling across equities, bonds, and emerging markets that can spread globally within hours, as seen in August 2024.
Because Japan imports almost all of its oil and gas priced in U.S. dollars, yen depreciation raises energy costs in yen terms, which cascade through transport, manufacturing, and services; May 2026 data showed ocean freight costs up 61.8% and services producer prices up 3.3% year-on-year.
The key variable is the interest rate differential between the Federal Reserve and the Bank of Japan, not either central bank's absolute rate level; the carry trade only begins to break down when that spread narrows materially from its current level of approximately 2.5%-2.75%.