What Rex’s 60-Day Guidance Silence Means for ASX Investors
38 mins ago

Pilbara Minerals fell 58% in FY25 and then rose 229% in FY26. Austal gained 153% in one year and then lost 32% the next. These are not obscure small-caps sitting at the edges of the index. They are data points drawn from the ASX 200, and they describe a pattern that repeated itself across the entire market this financial year.
The ASX 200 returned approximately 2.7% in FY26, a headline number that conceals one of the sharpest leadership reversals in recent memory. Last year’s standout growth names collapsed. Last year’s most beaten-down miners and lithium stocks staged extraordinary recoveries. For investors who built portfolios around FY25 sector trends, the experience ranged from frustrating to damaging.
Here is how and why this ASX sector rotation happened, what the mechanism behind it actually is, and what a practical, evidence-grounded response looks like heading into FY27. The goal is not to predict next year’s winners. It is to understand the forces at work well enough to avoid being caught on the wrong side of the next reversal.
Start with four names. Two were among the worst performers on the ASX 200 in FY25. Two were among the best. Then watch what happened when the calendar turned.
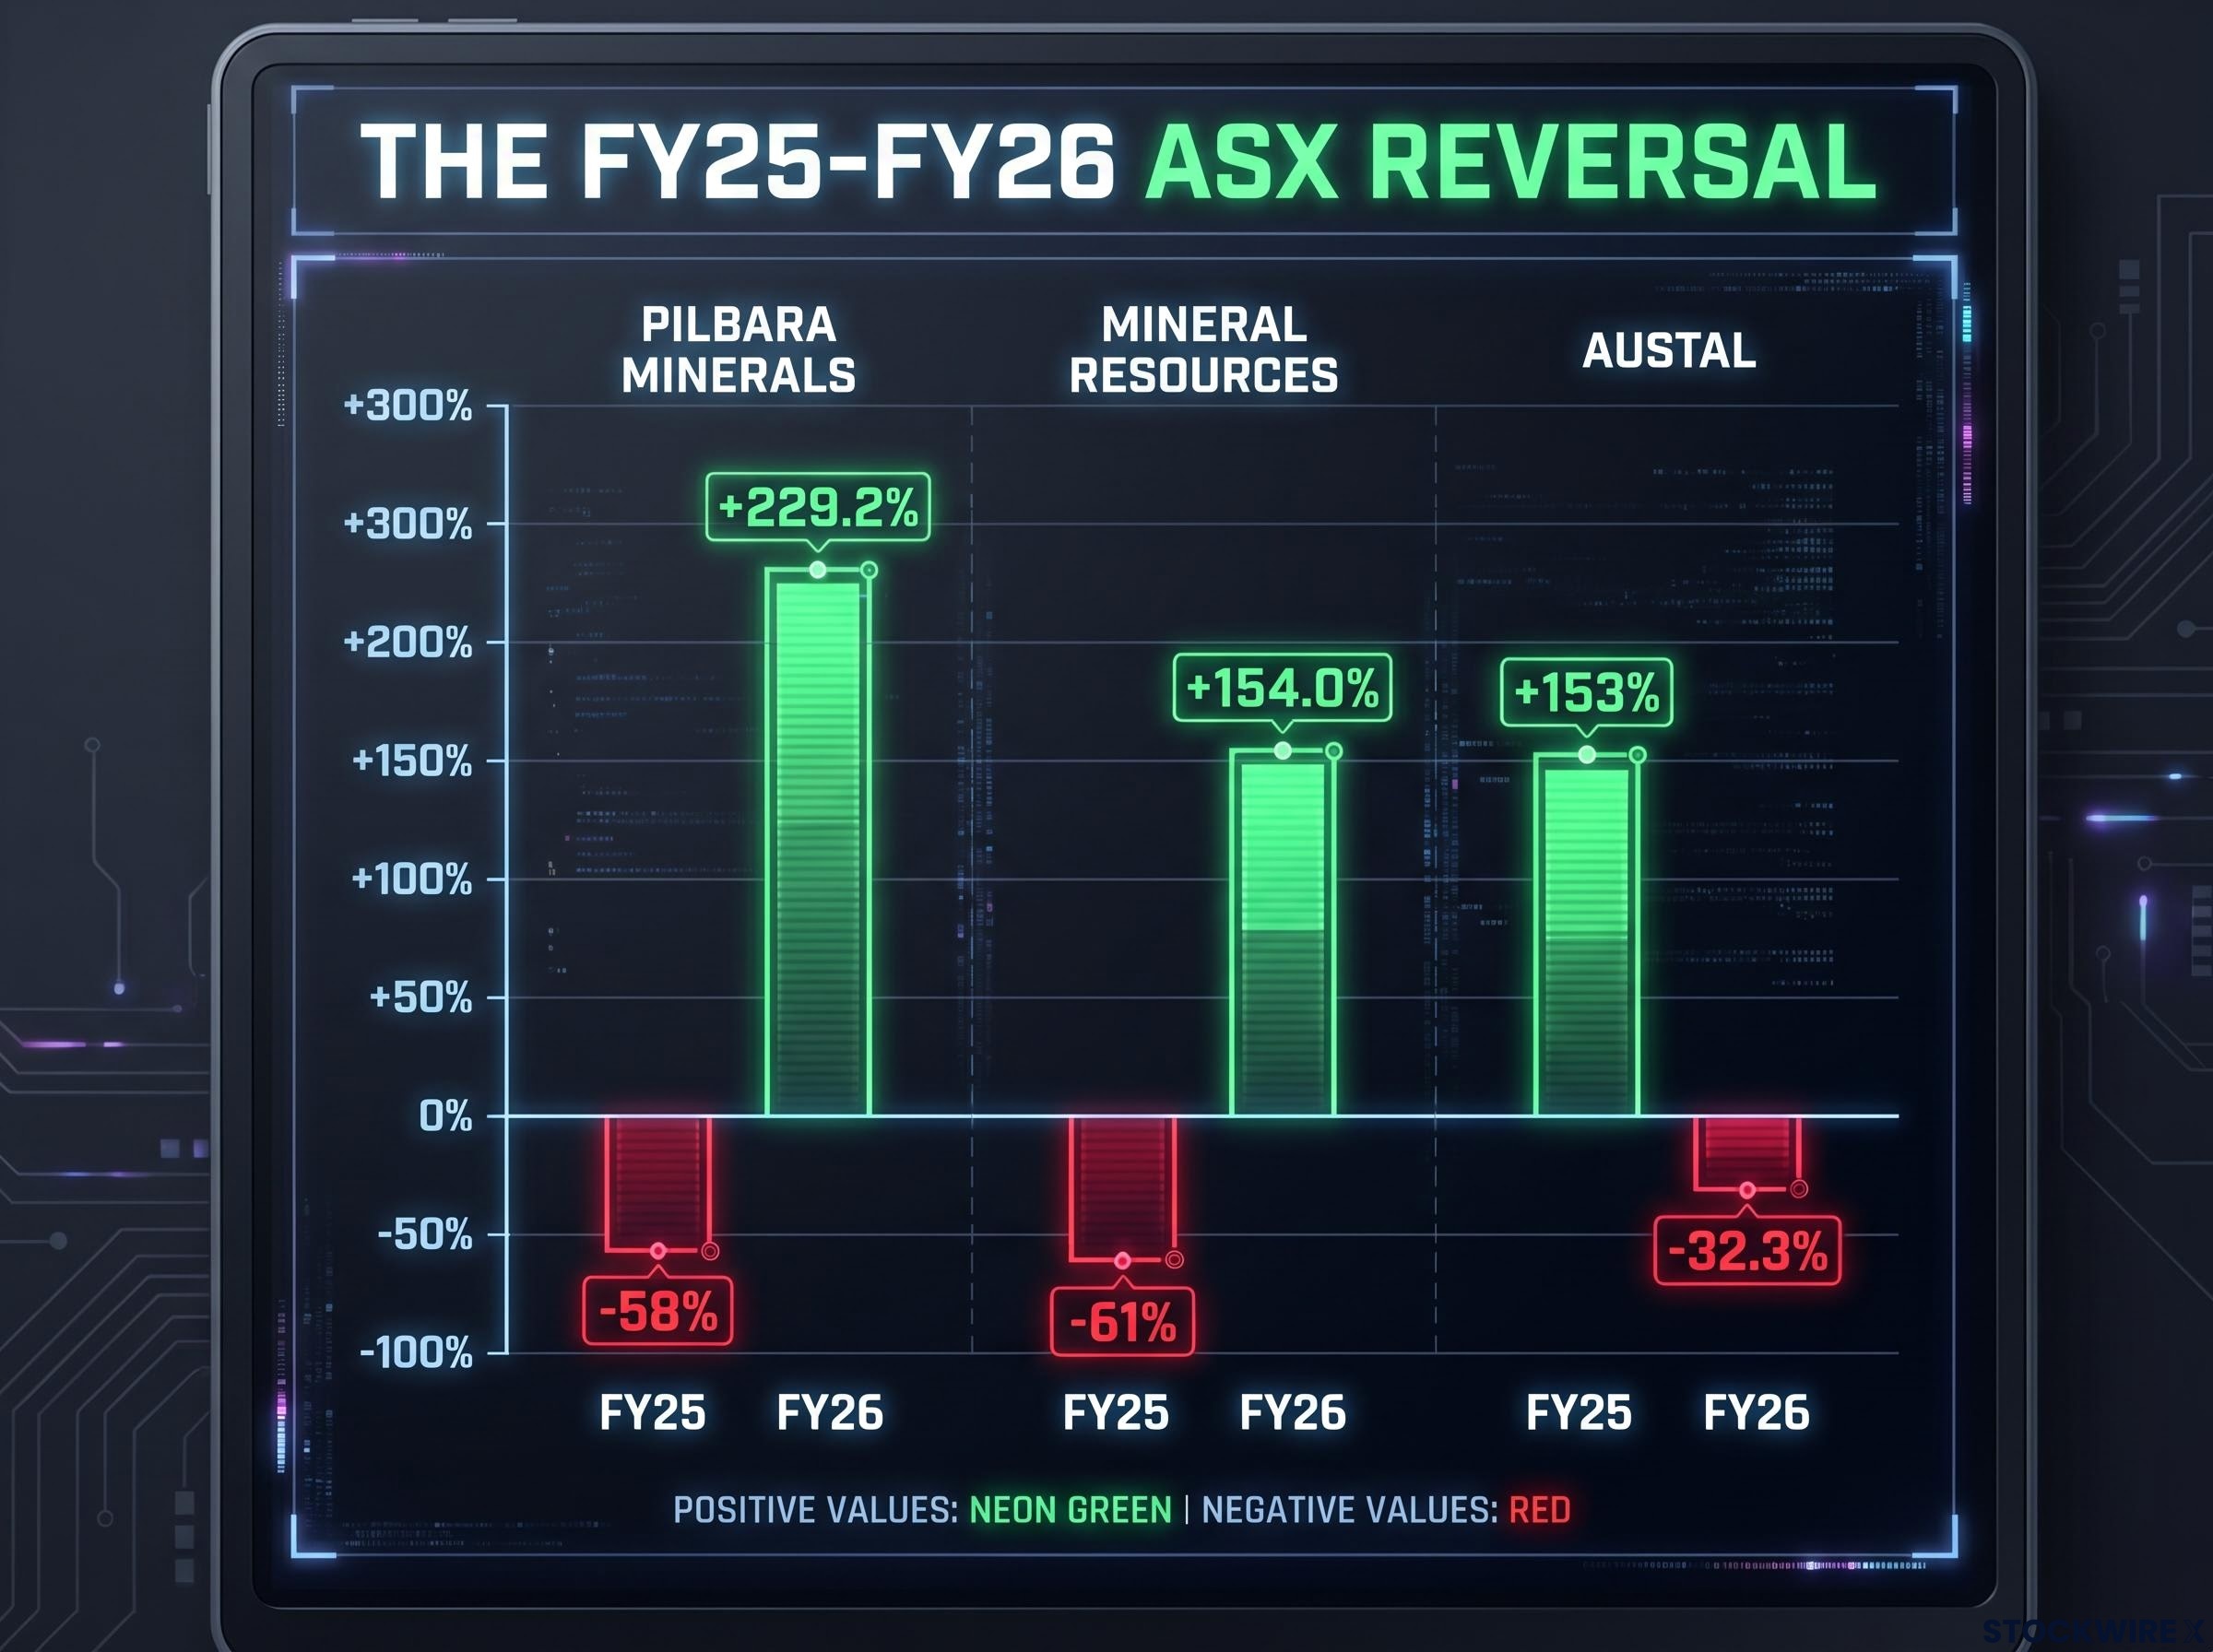
| Company | Ticker | FY25 Return | FY26 Return |
|---|---|---|---|
| Pilbara Minerals | PLS | ~-58% | +229.2% |
| Mineral Resources | MIN | ~-61% | +154.0% |
| Austal | ASB | ~+153% | -32.3% |
| Generation Development Group | GDG | ~+110% | Significant decline |
These are not isolated anomalies. They are a portrait of the same ASX 200 universe, viewed one year apart, in which the leaders and laggards almost completely swapped places.
The ASX 200 finished FY26 up just 2.7%, with materials stocks doing the heavy lifting to keep the index in positive territory, while growth-oriented sectors including technology, healthcare, and telecommunications acted as a drag. That single index figure masks an enormous divergence in outcomes across sectors and individual names.
What this two-year scorecard makes plain is that this year’s performance table is not a reliable guide to next year’s. The gap between headline index returns and individual sector outcomes can be enormous, and investors who simply extended FY25 allocations into FY26 learned that the hard way.
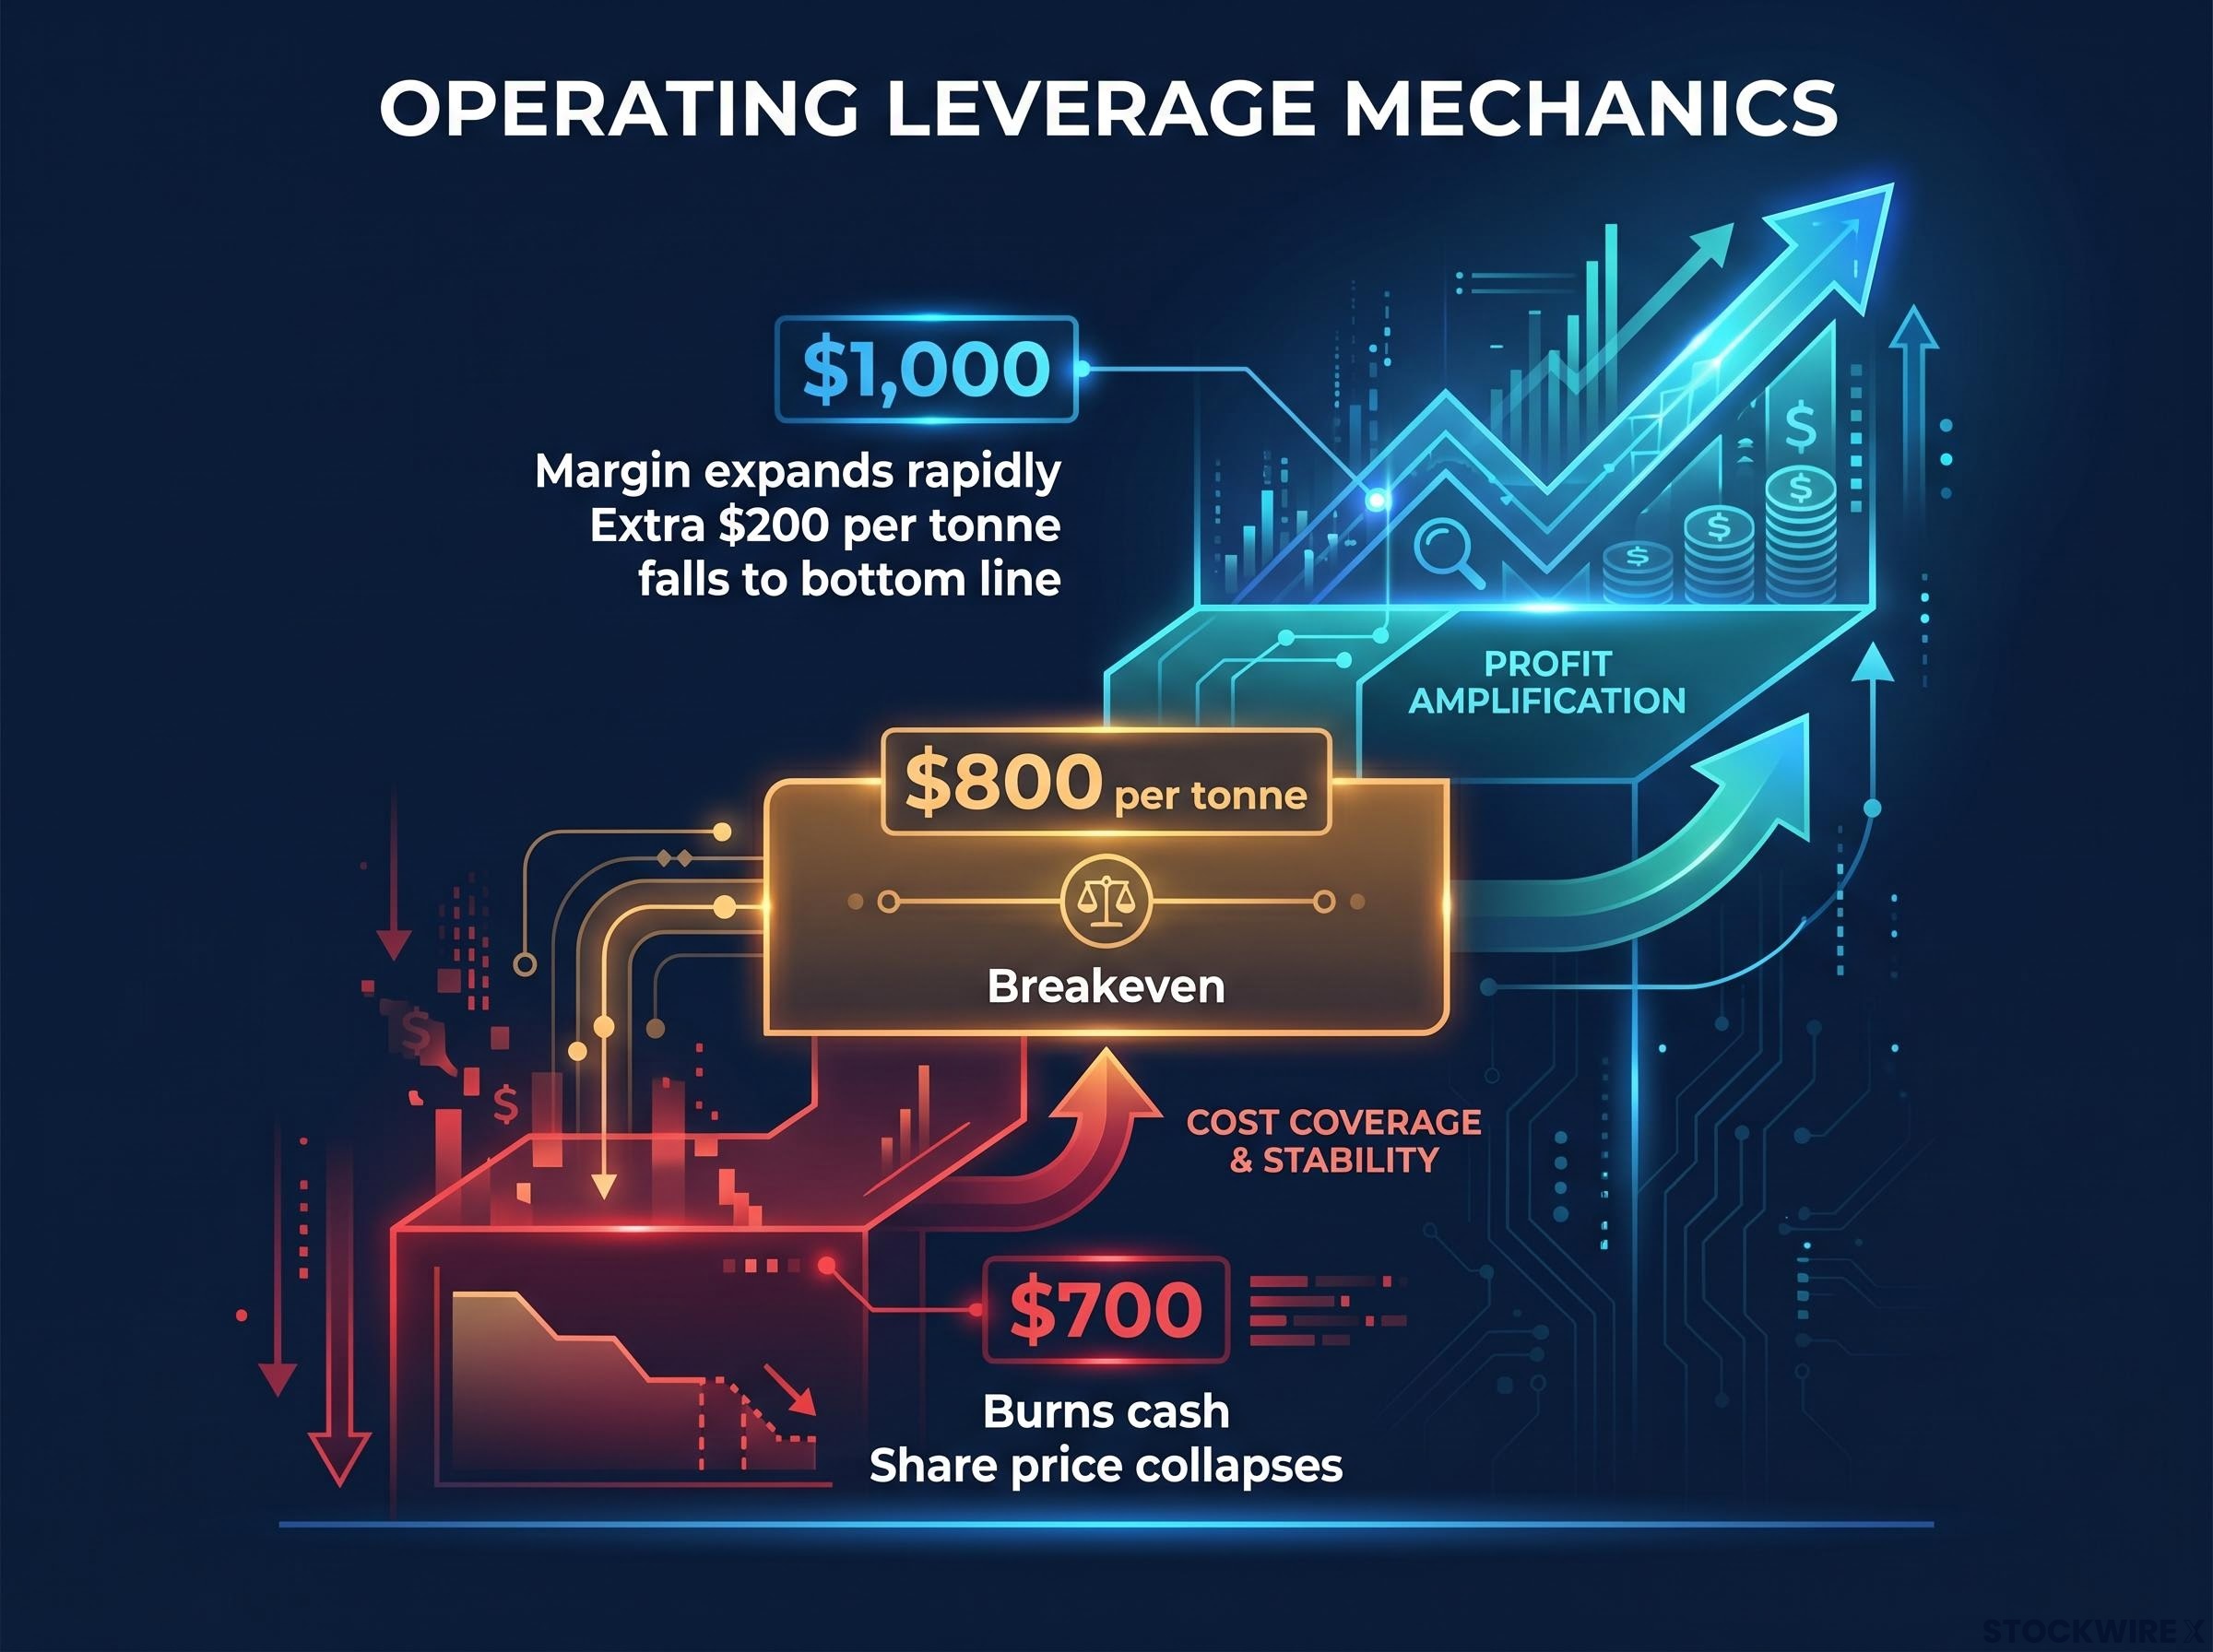
The scale of the lithium recovery only makes sense once you understand the mechanism that amplified it. That mechanism is operating leverage, and in commodity miners it works like a spring.
Operating leverage describes what happens when a business carries high fixed costs. A miner’s processing plant, rail access, and workforce cost roughly the same whether the lithium price is high or low. Revenue swings with the commodity price, but costs stay largely stable. The result: a moderate price recovery translates into a disproportionately large swing in profitability.
Operating leverage in commodity mining is structurally different from the financial leverage an investor takes on through margin lending or exchange-traded options, but both mechanisms share the same amplification dynamic: fixed obligations stay constant while variable outcomes swing across a much wider range than the underlying price move.
Consider a simplified example. A miner breaks even when lithium spodumene concentrate trades at $800 per tonne. At $700, the operation burns cash and the share price collapses to reflect it. But when the price recovers to $1,000, the miner is not just profitable; margins expand rapidly, because that extra $200 per tonne falls almost entirely to the bottom line. The share price response is not proportional to the commodity move. It is amplified.
That is exactly what played out across the lithium sector in FY26. Three conditions combined:
Pilbara Minerals returning +229.2% after a 58% drawdown, and Mineral Resources returning +154.0% after a 61% drawdown, are the direct products of this dynamic. The same operating leverage that creates these recoveries, however, works in reverse on the way down. Position sizing relative to volatility matters as much as the directional call, because the spring compresses just as violently as it releases.
The other side of the rotation was equally dramatic, and it would be a mistake to treat the FY26 declines as a single unified story. Three different problems, governance, acquisition quality, and regulatory shock, produced superficially similar outcomes.
| Company | Ticker | FY26 Return |
|---|---|---|
| WiseTech Global | WTC | -70.2% |
| Tuas | TUA | -60.2% |
| Cochlear | COH | -59.6% |
| Xero | XRO | -59.1% |
| CSL | CSL | -52.4% |
| Nine Entertainment | NEC | -45.5% |
| Seek | SEK | -44.4% |
| ARB Corporation | ARB | -43.0% |
| REA Group | REA | -40.0% |
| Beach Energy | BPT | -36.4% |
Sector-level de-rating set the context. Growth stocks entered FY26 on stretched multiples after strong FY25 runs, which meant any disappointment would be met with outsized selling. But what determined which names fell hardest was company-specific.
Growth stock valuation mechanics explain why the de-rating process can be so violent: when a high-multiple stock misses expectations, the market is not just adjusting for one bad quarter but repricing every future cash flow at a lower probability of materialising, and that compounding discount produces percentage falls that look disproportionate to the news event that triggered them.
WiseTech Global lost 70.2%, with governance concerns layered on top of the broader growth stock sell-off. Xero fell 59.1%, weighed down by its $2.5 billion acquisition of Melio, a US accounting payments firm that was unprofitable at the time of the deal. The acquisition price colliding with the target’s lack of profitability shifted market sentiment sharply.
Tuas shed roughly 60% of its value in a single day after it was accused of operating on radio frequency bands without authorisation. That one session was responsible for the overwhelming majority of its full-year 60.2% loss, demonstrating how swiftly a regulatory shock can overwhelm even a company operating in a sector with otherwise healthy underlying demand.
The breadth of the decline was striking: Cochlear (-59.6%), CSL (-52.4%), REA Group (-40.0%). But the distinct failure modes at WiseTech, Xero, and Tuas demonstrate something important. Strong industry demand conditions offer no protection once a company-specific problem surfaces at a high valuation, because there is no multiple buffer to absorb the disappointment. And that distinction matters when assessing recovery prospects: a governance-impaired business faces different headwinds than one that made a bad acquisition or one that faced a regulatory shock.
The specific FY25-to-FY26 stories the reader has just seen, lithium miners springing back while growth darlings collapsed, are vivid examples of a broader force that operates across the ASX: mean reversion.
Mean reversion, in plain terms, is the observation that assets which have fallen sharply tend to recover, and assets trading at elevated prices after extended runs tend to underperform. It is not a law of physics. It is a statistical tendency that reflects the behaviour of valuations and investor sentiment over time.
Academic evidence on mean reversion in equity markets, including cross-national studies covering 18 countries, confirms that parametric contrarian strategies exploiting prior-year underperformance consistently outperform simple buy-and-hold approaches, lending credibility to the pattern visible in the FY25-to-FY26 ASX data.
A stock trading at a high price-to-earnings multiple has its future growth already reflected in the price. When a negative event arrives, whether an earnings miss, a governance concern, or a regulatory investigation, the de-rating is not just about the event itself. The multiple compresses as the market reprices future expectations downward, and the percentage fall is significantly larger than the same event would produce at a lower valuation. This is why FY25’s growth darlings, not FY25’s cheaply valued companies, dominated the FY26 worst-performer list.
The reverse applies on the upside. Stocks that have already been de-rated to reflect severe pessimism have low expectations embedded in the price. Even a modest improvement in outlook can trigger a re-rating that produces an outsized percentage gain, exactly as it did with PLS and Mineral Resources in FY26.
One historical analysis found that the 10 worst-performing stocks in the ASX top 100 in a given year delivered an average equal-weighted return of 25.2% the following year, compared with 10.3% for the ASX 200. This figure has not been independently verified, but it is consistent with the FY25-to-FY26 pattern and with broader academic observations about mean reversion in equity markets.
The practical question is how to distinguish genuine recovery candidates from permanent decliners. Two conditions favour recovery:
One rigorous way to separate genuine recovery candidates from permanent decliners is to calculate the implied growth rate embedded in the current share price, converting the market capitalisation and trailing revenue into the minimum annual growth the company must deliver for the investment to work at your target return.
The mean reversion tendency tells you that the worst-performing table from any given year deserves closer analytical attention than most investors give it. But it only works as an investment lens when combined with genuine fundamental assessment, not as a mechanical contrarian trade.
If the FY26 story were as simple as “resources won, growth lost,” Beach Energy would have been a winner. It was not. Beach Energy fell 36.4% in FY26 despite operating in a broadly elevated oil price environment.
That disrupts any simplistic rotation narrative and introduces a complication that matters: sector membership alone does not determine return outcomes. Company-level variables, including cost structure, balance sheet leverage, and operational execution, interact with the macro environment in ways that can override even supportive commodity conditions.
The FY26 resources story was specifically concentrated in battery metals and lithium, not uniformly positive across all commodity-exposed names. Consider the contrast:
What this tells you is that buying a sector ETF as a rotation trade is a blunter instrument than targeting the specific sub-sectors and companies where the valuation reset and commodity price inflection have actually occurred. The takeaway from FY26 is not “buy resources and sell tech.” It is: identify where within resources the risk-reward reset has happened at the company level.
The temptation now is to mechanically invert FY26 leadership: buy beaten-down tech and healthcare, avoid materials and lithium. That is not the lesson. Sector cycles do not follow calendar rhythms, and the conditions that drove the FY26 rotation (lithium price trough, extreme growth stock multiples) were specific to this cycle.
The ASX 200 valuation premium entering the second half of FY26, at roughly 16.7 times forward earnings against a long-run average of 14.9 times, sets a narrower margin for error heading into FY27 than the 2.7% headline index return suggests, with the RBA decision calendar and Chinese commodity demand both functioning as live swing factors.
A more useful response is to apply a process-based framework to your FY27 portfolio review:
The goal is not to predict the next rotation. It is to avoid being fully concentrated in it at the wrong moment.
The practical lesson from two years of ASX sector data is not which sectors to own. It is how to structure a review process that treats recent performance as a starting point for analysis rather than a conclusion.
The FY25-to-FY26 arc, from growth darlings to lithium recovery, is one of the most vivid leadership reversals in recent ASX history. It demonstrated how starting valuations, operating leverage, and mean reversion interact to produce outcomes that look extreme in hindsight but follow identifiable logic in real time.
The pattern is memorable. It should not be treated as a repeating template. The specific conditions, a lithium price trough following severe oversupply, growth stocks trading at generational multiples, company-specific shocks concentrated in a single financial year, were particular to this cycle. The next rotation will have different triggers.
What carries forward is the structural observation: the composition of ASX returns changes significantly from year to year, and a portfolio built to weather that change will outperform one built to chase the current trend. That is not a trading insight. It is a portfolio construction principle, and FY26 made the case for it more clearly than any year in recent memory.
This article is for informational purposes only and should not be considered financial advice. Investors should conduct their own research and consult with financial professionals before making investment decisions. Past performance does not guarantee future results.
ASX sector rotation is the shift in market leadership from one sector to another across reporting periods, driven by changes in valuations, commodity cycles, and investor sentiment. The FY25-to-FY26 cycle is a textbook example: lithium miners that fell 50-60% in FY25 staged recoveries of over 150-229% in FY26, while growth stocks that had led FY25 fell by as much as 70%.
Pilbara Minerals surged 229% in FY26 because three conditions aligned: lithium prices inflected upward from deeply depressed levels, broker sentiment shifted and drove institutional capital back into the sector, and extreme prior-year drawdowns had already priced in near-worst-case scenarios, leaving enormous room for re-rating amplified by operating leverage.
Operating leverage in mining refers to the dynamic where a company's fixed costs (processing plants, rail access, workforce) remain roughly constant regardless of commodity prices, so even a moderate price recovery translates into a disproportionately large swing in profitability and share price. It is the primary reason Pilbara Minerals and Mineral Resources recovered far more sharply than the underlying lithium price move.
WiseTech fell 70.2% due to governance concerns layered on top of a broader growth stock de-rating, while Xero fell 59.1% partly because its $2.5 billion acquisition of unprofitable US firm Melio shifted market sentiment sharply. High starting valuations meant any negative event triggered outsized selling, because the market was repricing all future cash flows at a lower probability, not just adjusting for a single bad quarter.
The article recommends four steps: check for heavy concentration in recent winners trading at demanding valuations, size cyclical exposures (like lithium) relative to their volatility rather than the hoped-for return, rigorously reassess high-quality companies that have fallen sharply rather than reflexively avoiding them, and avoid assuming FY26's materials leaders will automatically lead in FY27.