Where BofA Says European Equity Risk Is Most Concentrated
39 mins ago

US nonfinancial after-tax corporate profit margins hit 14.4% in Q1 2026. That is the highest recorded figure across any post-recession expansion period going back to 1929, according to data from the Federal Reserve Bank of St. Louis published on 25 June 2026.
Most readers will misread what that sentence means.
The figure arrived alongside the Bureau of Economic Analysis (BEA) final Q1 2026 GDP revision, making it one of the most closely watched data releases of the quarter. But this data is already backward-looking, describing a quarter that ended three months ago, and it is generating forward-looking conclusions that the data itself cannot support. The gap between what the number shows and what people are doing with it is where the real analytical risk sits.
Here is a clear framework for reading this number correctly: what the history actually shows, where the old analytical rules broke down, and how to put margin data to practical use without mistaking a data point for a forecast.
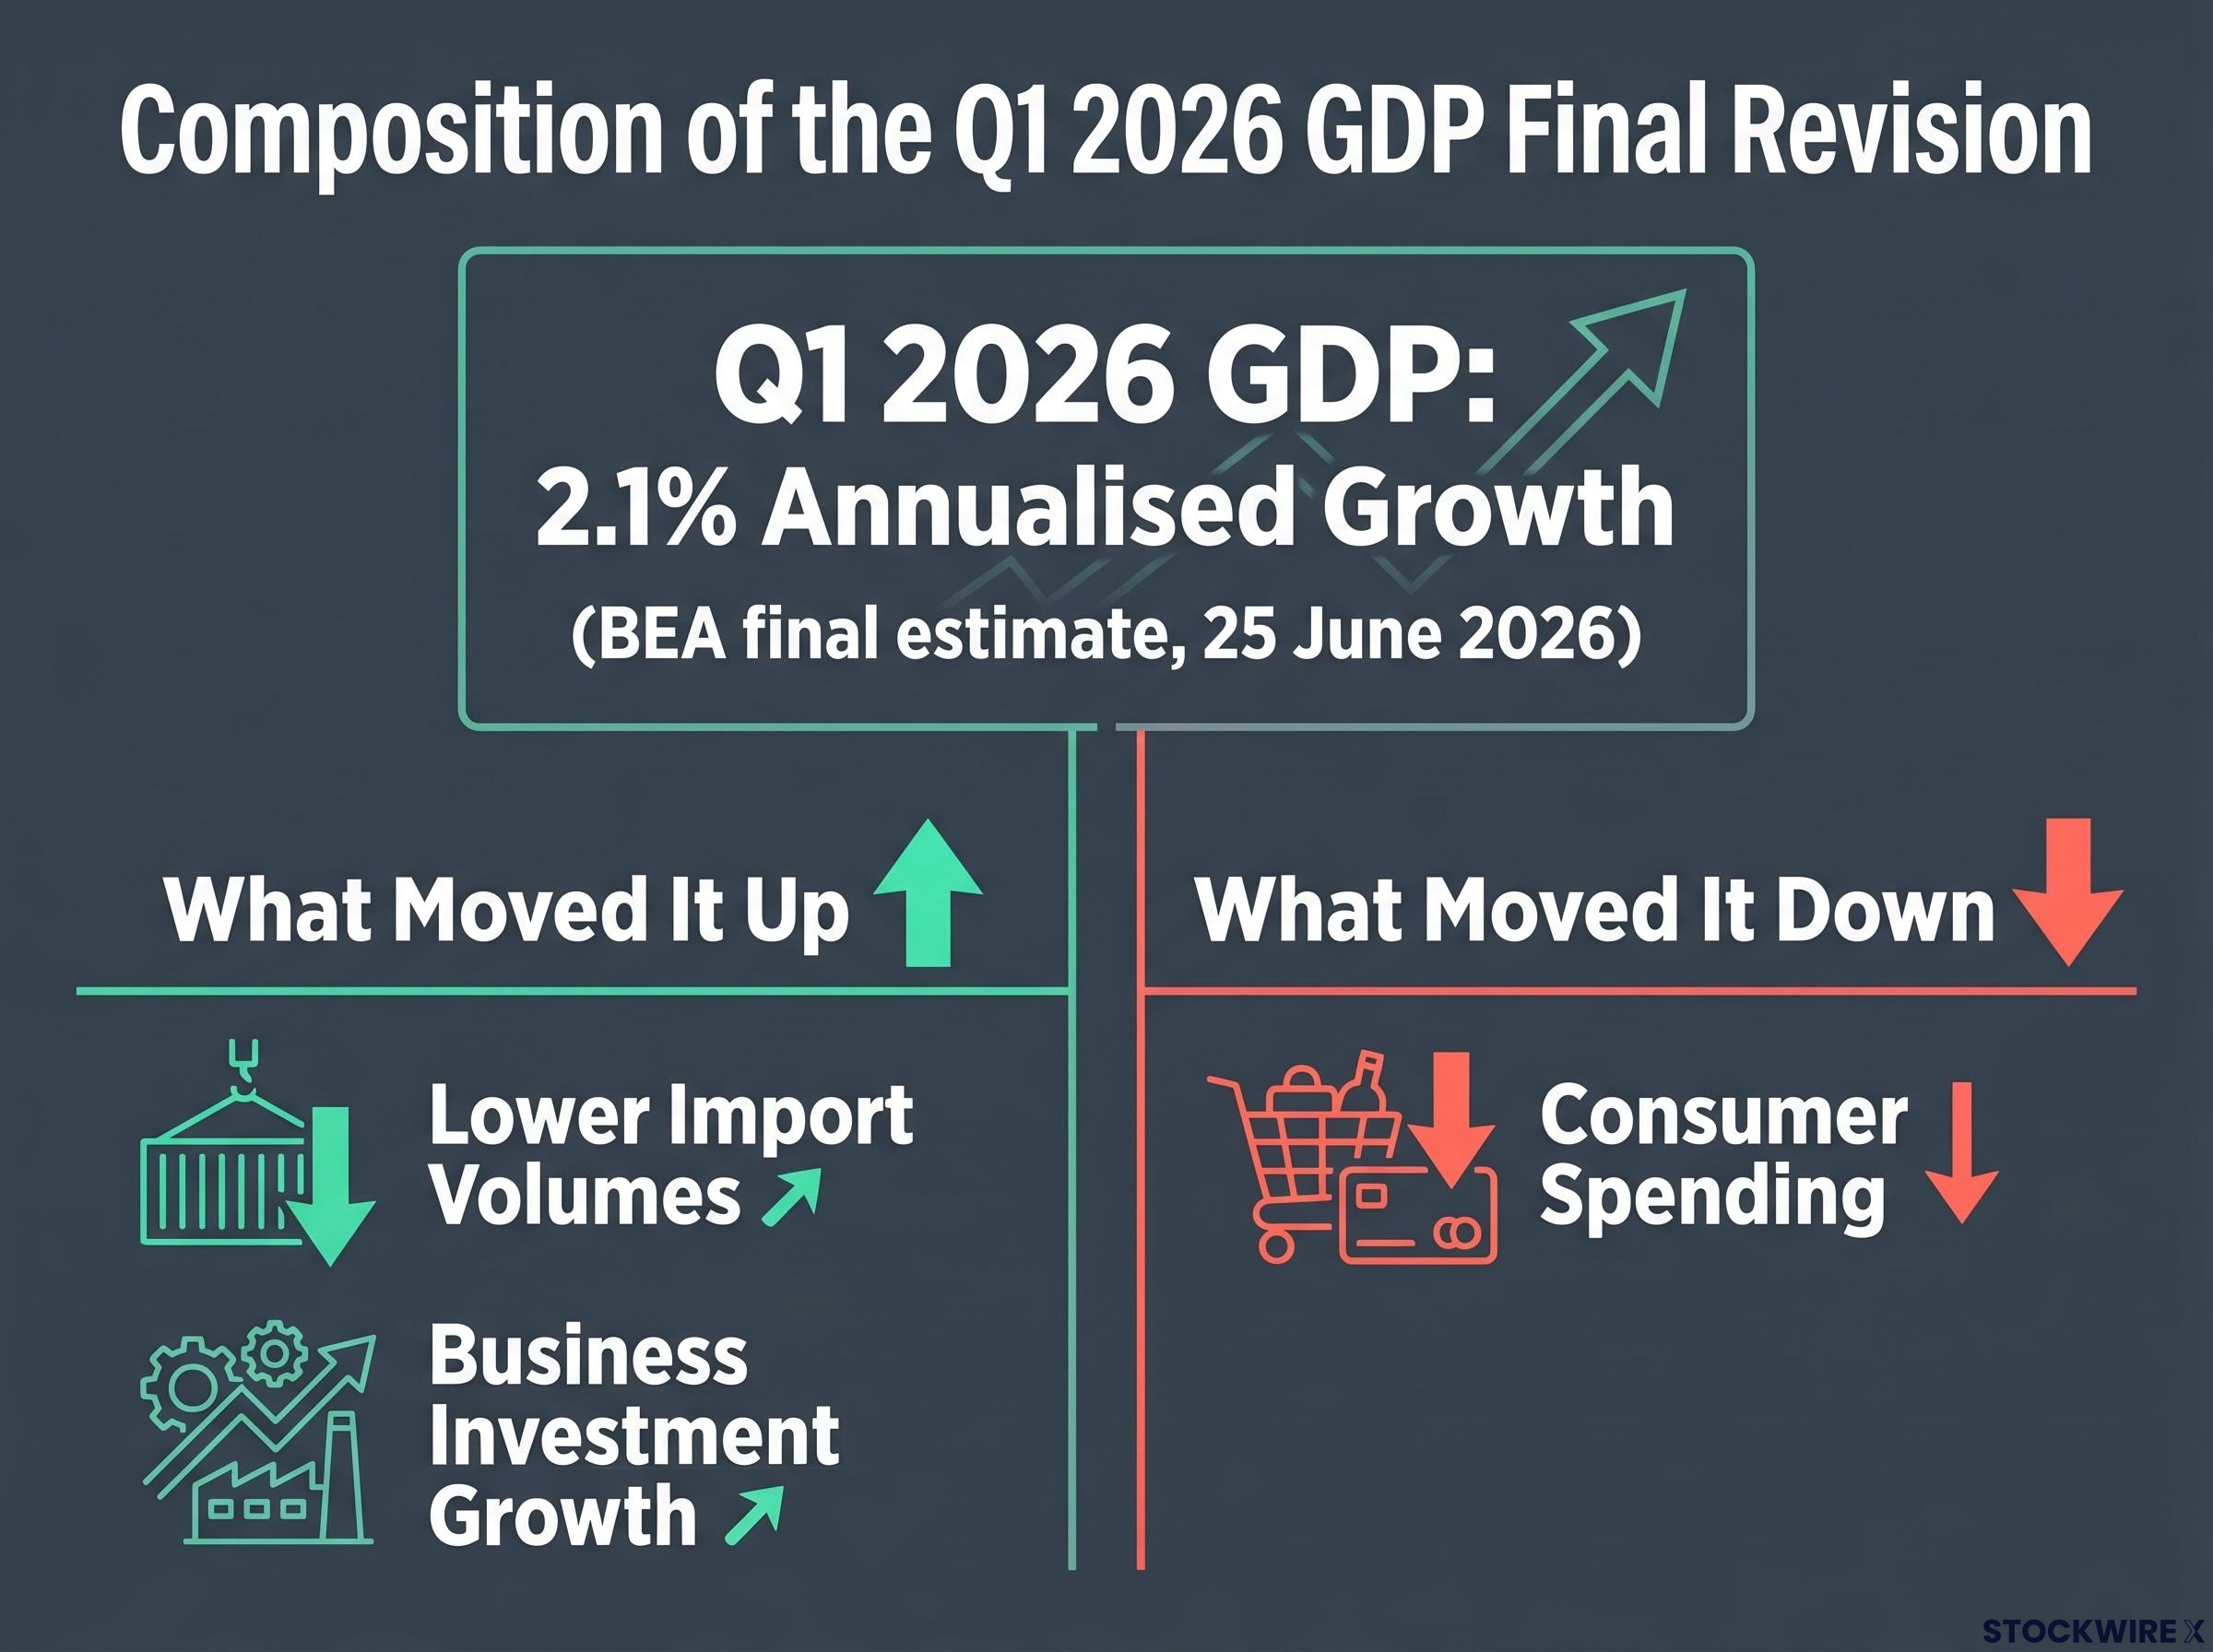
The Bureau of Economic Analysis published its third and final Q1 2026 GDP estimate on 25 June 2026, with annualised growth revised to 2.1%. The revision was not uniformly positive, and the components tell you more than the headline.
What moved the number up:
What moved it down:
The same final revision produced a substantial upward adjustment to corporate profit figures. Nonfinancial after-tax corporate profit margins reached 14.4% of nonfinancial corporate gross value added.
Q1 2026 nonfinancial after-tax corporate profit margin: 14.4% of nonfinancial corporate gross value added, the highest during any post-recession expansion since 1929, based on annual data 1929-2025 and quarterly data Q1 1947 through Q1 2026. Source: Federal Reserve Bank of St. Louis, 25 June 2026
The composition matters here. An expansion reading built on lower imports and modest investment gains, while consumer spending weakened, tells you this is not a uniformly broad-based growth picture. For you as an investor using macro data to inform positioning, the composition of growth is often more signal-rich than the top-line figure. A 2.1% GDP print can mean very different things depending on what is driving it, and this one carries a consumer spending caution that the margin headline does not surface on its own.
The 2.1% headline figure sits alongside a private sector momentum reading of 2.2% annualised once government spending swings and import volatility are stripped out, a distinction that changes how you read the consumer spending softness showing up in the same revision.
Before you can understand why the 14.4% figure is generating so much noise, you need to understand the system it apparently violates. For most of the last century, corporate profit margins followed a pattern that was internally consistent and analytically useful.
The cycle worked like this: at the start of an expansion, companies entered with tight cost bases shaped by the cutbacks of the prior downturn, and margins widened accordingly. That improvement ran through to roughly mid-cycle before plateauing. As the expansion continued, the room for further efficiency gains narrowed, and the costs of growth, including larger headcounts and higher capital spending, began to erode profitability. Margins moved lower.
Recessions then acted as a corrective phase, clearing out unproductive capacity and returning firms to the kind of operating efficiency that would underpin the margin recovery in the next cycle.
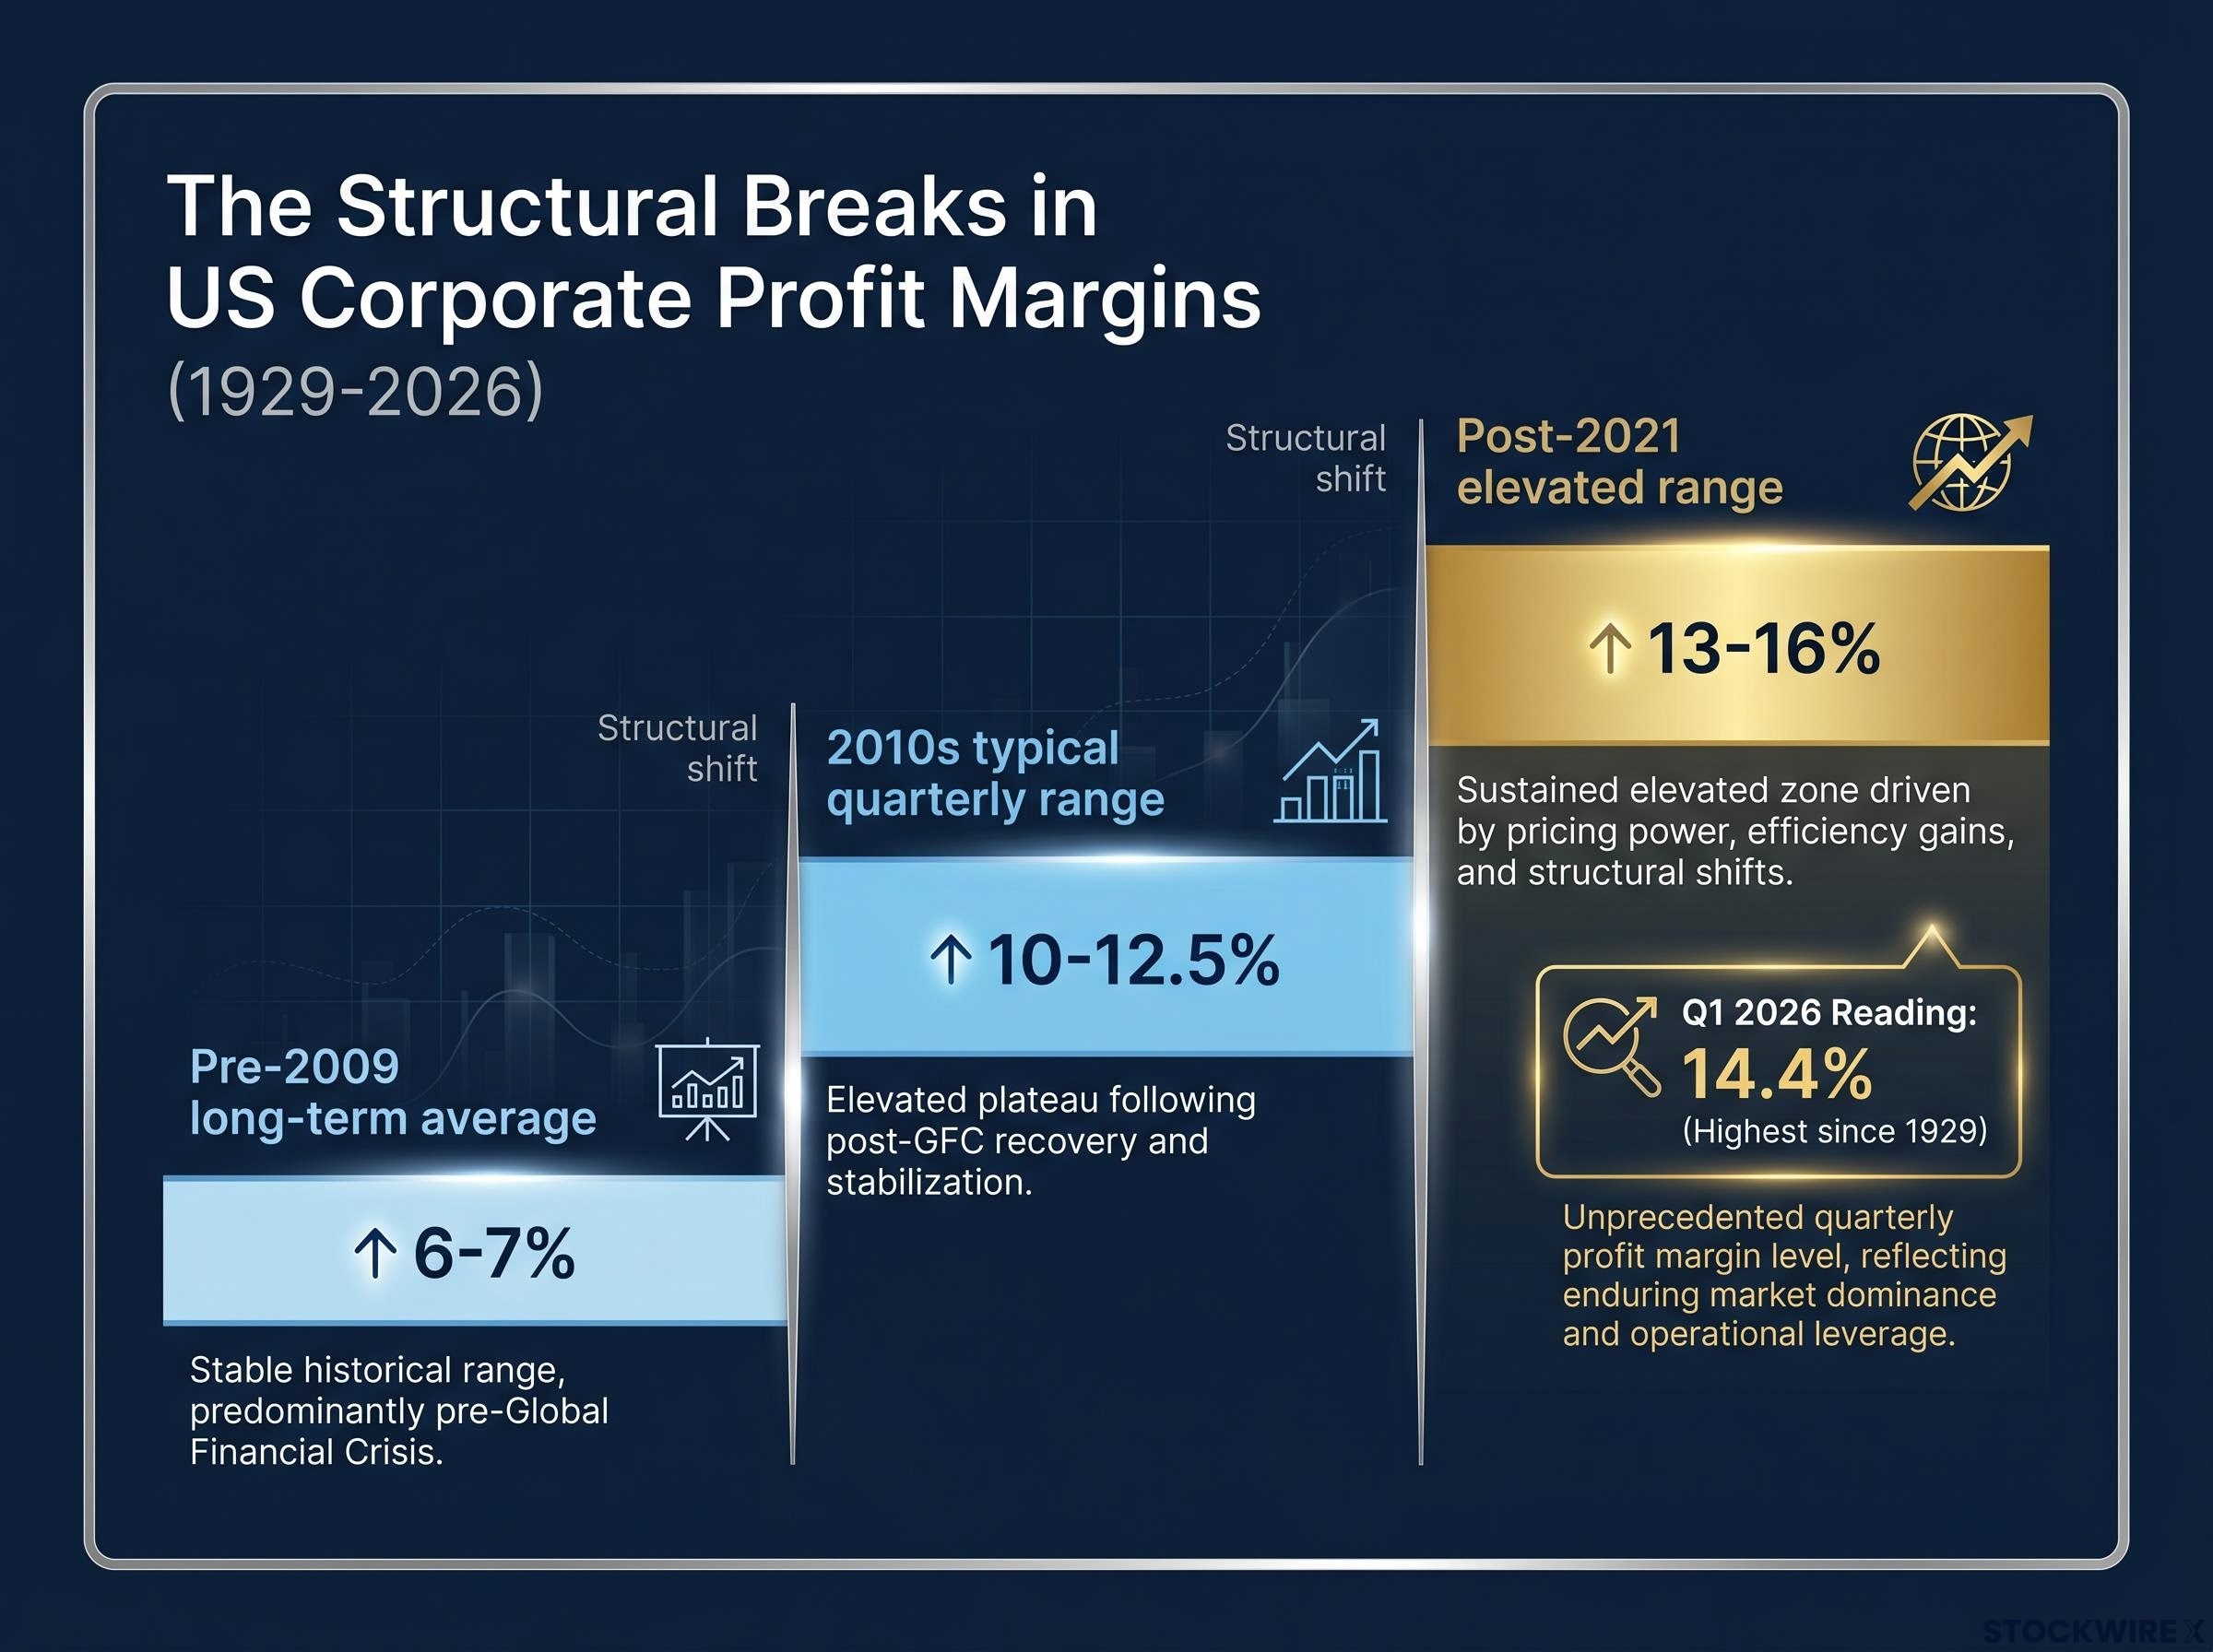
| Period | Typical Margin Range | Context Note |
|---|---|---|
| Pre-2009 long-term average | 6-7% | Consistent cyclical pattern; margins peaked mid-cycle and compressed before recessions |
| 2010s typical quarterly range | 10-12.5% | First structural break; materially above pre-2009 baseline |
| Post-2021 elevated range | 13-16% | Second structural break; higher floor with increased variability |
| Q1 2026 reading | 14.4% | Within the post-2021 elevated band; highest post-recession expansion reading since 1929 |
If you learnt margin analysis from pre-2009 cycle frameworks, the system you studied was internally consistent for decades. The long-term average from 1929 through 2009 ran at approximately 6-7%, and the mid-cycle peak-and-decline pattern was a reliable enough feature that it gave margins genuine (if imperfect) forecasting utility. Understanding that this framework worked is precisely what makes the subsequent structural break so easy to miss: you are not discarding a flawed model. You are recognising that a valid model stopped applying.
Two distinct episodes broke the pre-2009 pattern, and they did so in sequence. The first suggested something had changed. The second confirmed it.
After the 2009 recession, margins recovered and then kept climbing past the point where the old pattern would have predicted compression. The post-2009 typical range settled at approximately 9-12%, with occasional spikes above 13%. That was already materially above the pre-2009 long-term average of 6-7%, and the expected late-cycle decline simply did not arrive on the historical schedule.
What drove the shift was not a single factor but a combination of structural changes in the corporate sector:
Structural regime shifts in input costs represent one of the forces that enabled the post-2009 margin floor to hold above its historical average; if persistent inflation reverses the disinflation tailwind that suppressed input costs for four decades, the elevated margin band itself comes under pressure from a direction the historical cycle data cannot capture.
Following the COVID lockdowns, a second structural shift took hold. Margins climbed into a new elevated range and held there, with quarter-to-quarter swings becoming more pronounced than in earlier periods. The Q1 2026 reading of 14.4% sits within this elevated post-2021 range rather than anomalously above it.
That distinction matters enormously for how you interpret the number. Against a pre-2009 baseline, 14.4% looks alarming, more than double the historical average. Within the post-2021 band, it sits near the middle. The question this reframing gives you is the correct one: not whether margins are dangerously high, but whether they are beginning to compress from this elevated floor.
Here is where many investors make the analytical leap that the data does not support. A record margin reading feels like it should mean something about what comes next. The history says otherwise.
“No consistent threshold in either the absolute level of profit margins or the duration since a cyclical peak reliably signals the timing of upcoming recessions.”
The mid-cycle peak-and-decline pattern that once gave margins some forecasting utility depended on a predictable sequence: margins peak, then compress, then a recession follows. In the post-2009 era, that sequence broke. Elevated margins have coexisted with continued expansion for extended periods, which means the peak itself no longer carries the timing information it once did.
A single elevated margin print, even one described as the highest since 1929, does not provide a reliable timing signal for economic downturns or equity market corrections. To carry any weight as a late-cycle indicator, margin data needs corroborating evidence from at least three other domains:
The same analytical principle applies to consumer sentiment data: the distinction between lagging versus leading indicators determines whether a record reading tells you something actionable about what comes next or simply confirms what has already happened.
The “highest since 1929” framing, while historically accurate, is analytically incomplete. It should not trigger portfolio repositioning on its own.
You now have the context. Here is how to put it to work.
The practical role for margin data in your investment process is as a baseline-setter, not a trigger. The 14.4% Q1 2026 reading tells you where corporate earnings power currently sits. What it does not tell you is where it is heading. That is where the framework comes in.
| Indicator | What It Adds That Margins Cannot | Signal Threshold to Watch |
|---|---|---|
| Credit spreads | Forward-looking risk pricing | Widening alongside margin compression |
| Employment trends | Historically stronger and more timely recession signal | Deterioration in payrolls or initial claims |
| Business surveys: PMI/ISM | Forward-looking sentiment from purchasing managers | Sustained sub-50 PMI combined with other signals |
The specific caution here is worth repeating: avoid using “highest since 1929” as a contrarian sell signal without corroborating evidence. The post-2009 era has repeatedly demonstrated that elevated margins can persist longer than historical analogues suggest. Elevated margins are a context-setter, not a countdown clock to the next downturn.
This article is for informational purposes only and should not be considered financial advice. Investors should conduct their own research and consult with financial professionals before making investment decisions.
The Q1 2026 margin reading is historically notable by pre-2009 standards. By post-2021 standards, it sits within the 13-16% band that has defined the current structural regime. The correct analytical posture is monitoring for inflection, not reacting to the absolute level.
Keep in mind that the Q1 2026 GDP and margin data are backward-looking. You are reading this near the end of Q2 2026, and what matters now is what Q2 data will reveal about whether the expansion is sustaining or the margin trend is beginning to turn. The 2.1% GDP growth print provides the contemporaneous macro backdrop, but it describes where the economy was, not where it is going.
Your forward-looking filter as new data arrives remains the three-signal convergence test:
Until those signals converge, the 14.4% figure updates your earnings baseline upward. It does not, by itself, change your risk posture. The next signal that matters will come from Q2 data, not from this Q1 print.
For investors wanting to assess whether the current margin and profitability regime is structural or represents a cyclical peak tied to AI infrastructure spending, our deep-dive into the 2026 earnings cycle examines forward P/E compression, full-year EPS growth tracking at 23-24%, and the capex breadth flowing into construction, utilities, and materials.
Past performance does not guarantee future results. Financial projections are subject to market conditions and various risk factors.
US nonfinancial after-tax corporate profit margins measure after-tax profits as a percentage of nonfinancial corporate gross value added, and are published by the Bureau of Economic Analysis as part of the final GDP revision each quarter.
The 14.4% Q1 2026 reading reflects two structural breaks since 2009: first, post-recession margins settled materially above the pre-2009 average of 6-7%, driven by supply chain globalisation, technology adoption, and pricing power concentration; then a second post-COVID shift pushed margins into an elevated 13-16% band where they have remained.
No. The historical mid-cycle peak-and-decline pattern that once gave margins some forecasting utility broke down after 2009, and elevated margins have repeatedly coexisted with continued economic expansion for extended periods without triggering downturns.
The article identifies three corroborating signals that, in combination with margin compression, would constitute an actionable late-cycle warning: widening credit spreads, deterioration in employment data (payrolls and initial claims), and sustained sub-50 PMI readings from business surveys.
Use it as a baseline for near-term earnings model assumptions rather than a trigger for repositioning; the 14.4% figure updates the earnings power baseline upward but does not, on its own, change risk posture, because the directional trend and corroborating macro signals matter far more than the absolute level.