Where BofA Says European Equity Risk Is Most Concentrated
27 mins ago
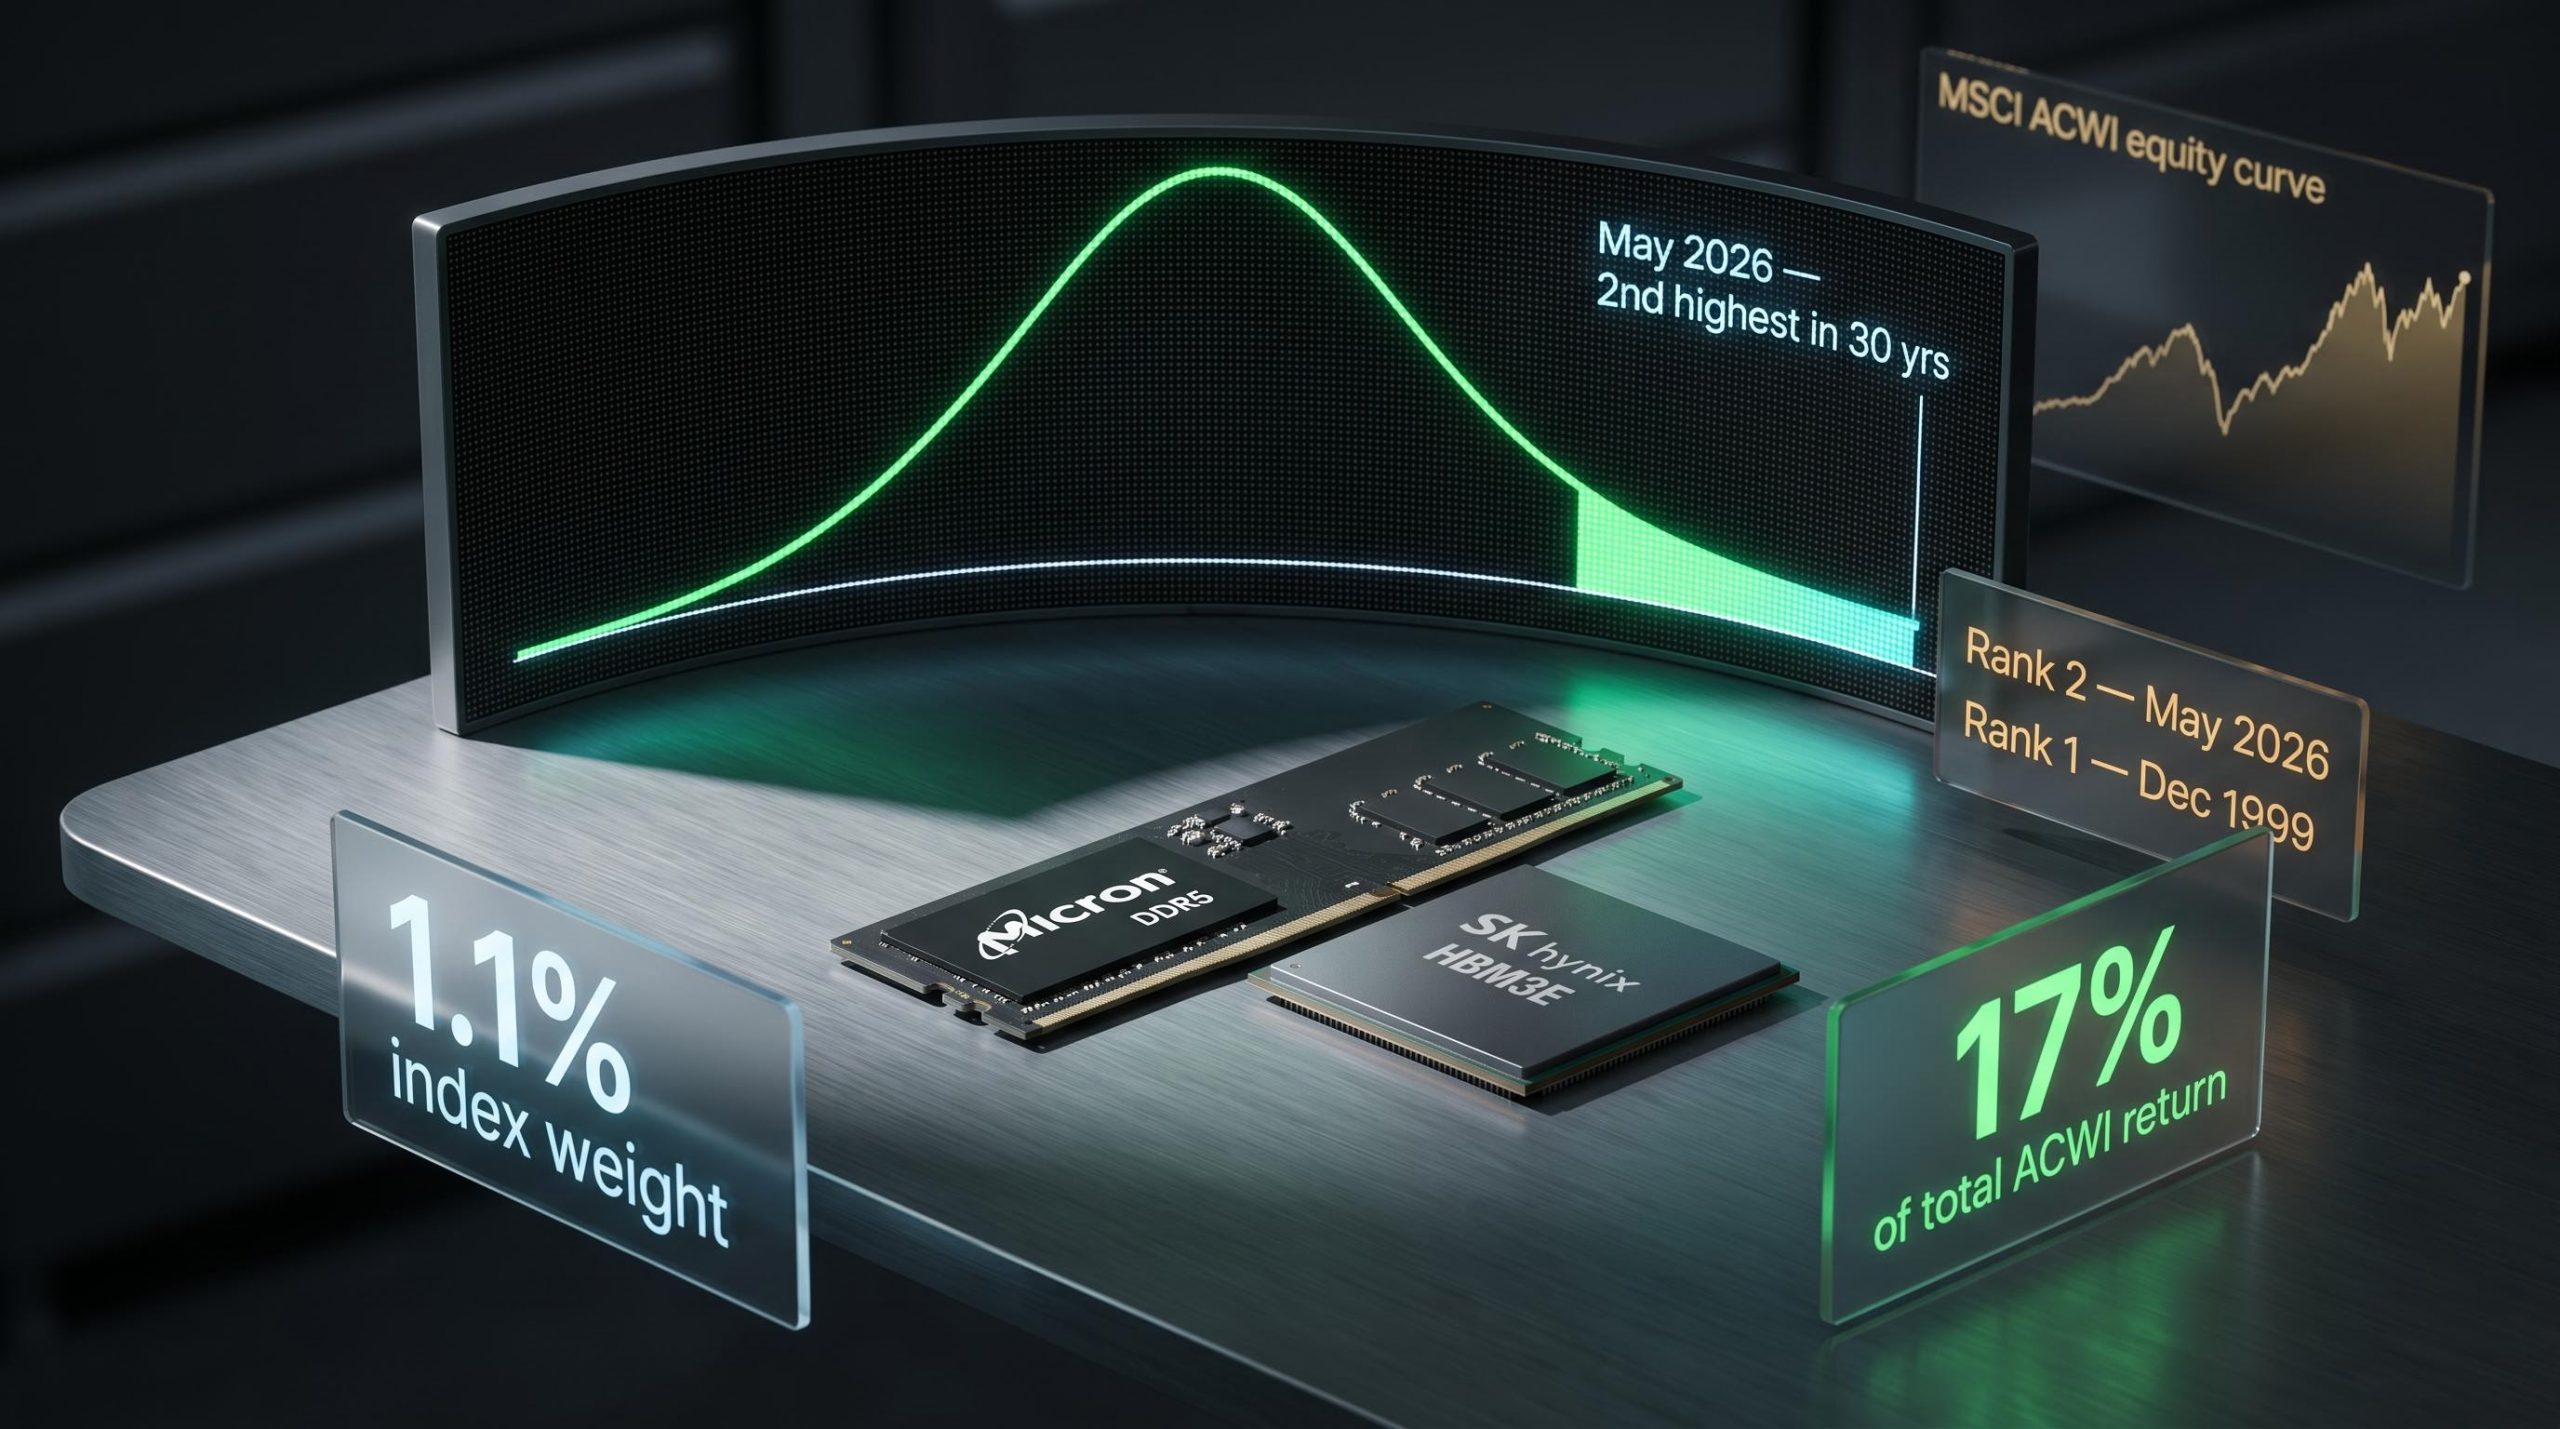
Two stocks, each holding less than 1% of a global equity index, generated 17 cents of every dollar that index returned in May 2026. The arithmetic is absurd before the names even matter.
The names are Micron Technology and SK Hynix. Their combined contribution sits at the centre of a broader regime shift: beginning in April 2026, global equity return dispersion, a measure of how widely individual stock outcomes diverge from one another within an index, reached levels not seen since the apex of the dot-com bubble. That is not a narrative claim. It is a statistical finding drawn from 30 years of MSCI All Country World Index (ACWI) data. As of late June 2026, the CBOE S&P 500 Dispersion Index remained near all-time highs, signalling that the regime has not reverted.
Here is the framework for separating return dispersion from market concentration, grounded in the specific mechanics of May 2026, so that you can identify and interpret this regime characteristic in your own portfolio context.
The ACWI posted a total return of roughly 5.2% during May 2026. Micron Technology and SK Hynix accounted for around 0.9 percentage points of that figure, a share equal to approximately 17% of the month’s total gain.
Their combined beginning-of-month index weight was approximately 1.1%.
Two stocks representing roughly 1.1% of ACWI index weight were responsible for approximately 17% of the index’s total return in May 2026.
Let that ratio settle. A combined weight of 1.1% producing 17% of total return means these two stocks moved so dramatically that their footprint in the outcome dwarfed their footprint in the index by a factor of roughly fifteen. The story here is not the familiar one of mega-cap dominance. Nvidia, Apple, and Microsoft all featured among the five largest ACWI return contributors in May, as would be expected given their standing as the three biggest index holdings. Those names showing up at the top was unremarkable. Two stocks below the 1% weight threshold appearing alongside them was not.
The driver of the index’s May return was not the heavyweights doing heavy things. It was a different mechanism entirely: smaller-weight stocks moving with such force that they reshaped the aggregate outcome.
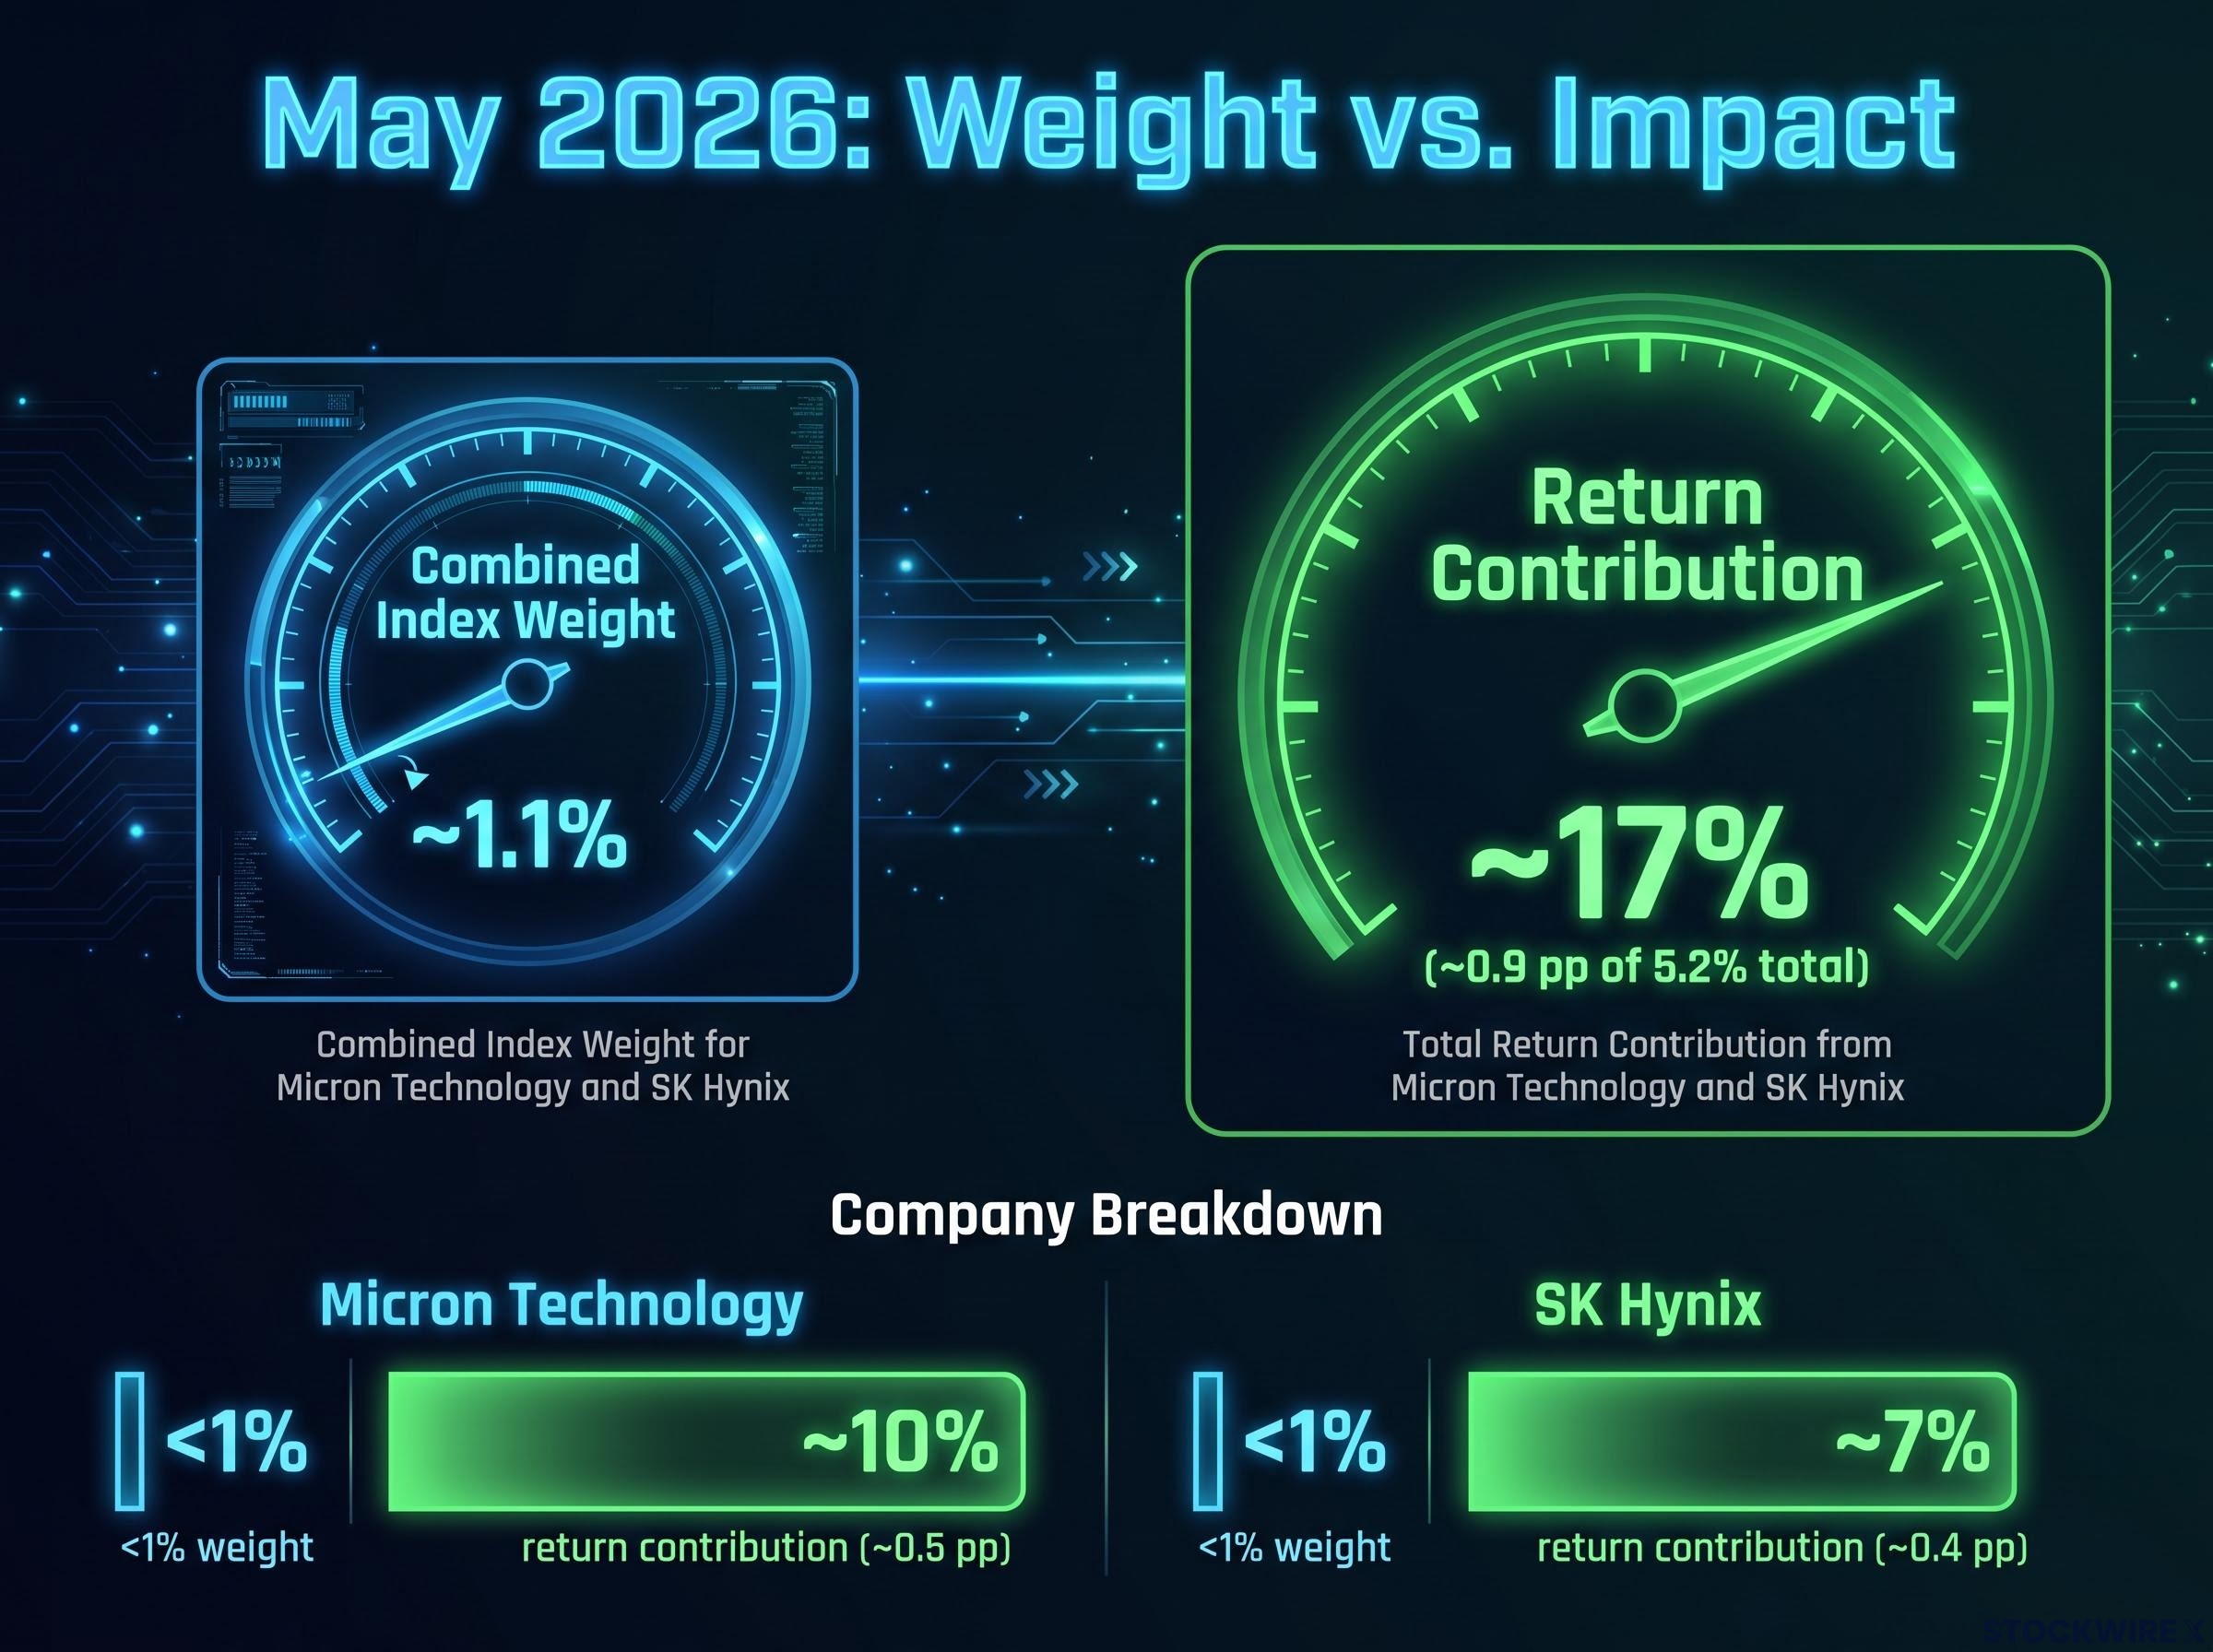
| Stock | Approx. index weight | Approx. return contribution | Contribution as % of total ACWI return |
|---|---|---|---|
| Micron Technology | <1% | ~0.5 pp | ~10% |
| SK Hynix | <1% | ~0.4 pp | ~7% |
| Combined | ~1.1% | ~0.9 pp | ~17% |
Return dispersion is the cross-sectional standard deviation of individual stock returns within an index for a given period, weighted by market capitalisation. In plain terms, it measures how widely stock-level outcomes spread apart from one another during a month. A high reading means some stocks surged while others lagged or fell; a low reading means most stocks moved in roughly the same direction by roughly the same amount.
Market concentration is something different. It describes the long-running accumulation of index weight into a small number of dominant names. Concentration had been building in global equities for years before April 2026. The largest handful of technology companies commanded an outsized share of the ACWI’s total market capitalisation well before dispersion spiked.
Record market concentration had been building in global equities for years before April 2026, with five U.S. mega-caps controlling roughly 30% of total U.S. equity market capitalisation, a structural condition that was already present and distinct from the dispersion spike that emerged only in April.
Here is the distinction in practice:
High concentration was a feature of global equity markets well before 2026, having accumulated across multiple years. Dispersion, by contrast, only surged in April. The change was not driven by any shift in how index weight was distributed among constituents, but by the sheer scale of individual stock price moves. Stocks outside the very largest names produced extraordinary single-month gains, pulling the distribution of outcomes far wider than it had been.
The causal asymmetry matters: high concentration does not mechanically produce high dispersion. What changed was the size of the gap between winners and losers, not the identity of the index’s largest constituents. That means the risk model you use to manage concentration exposure is a different instrument from the one needed to monitor dispersion regimes, and conflating the two leads to misidentified sources of tracking error.
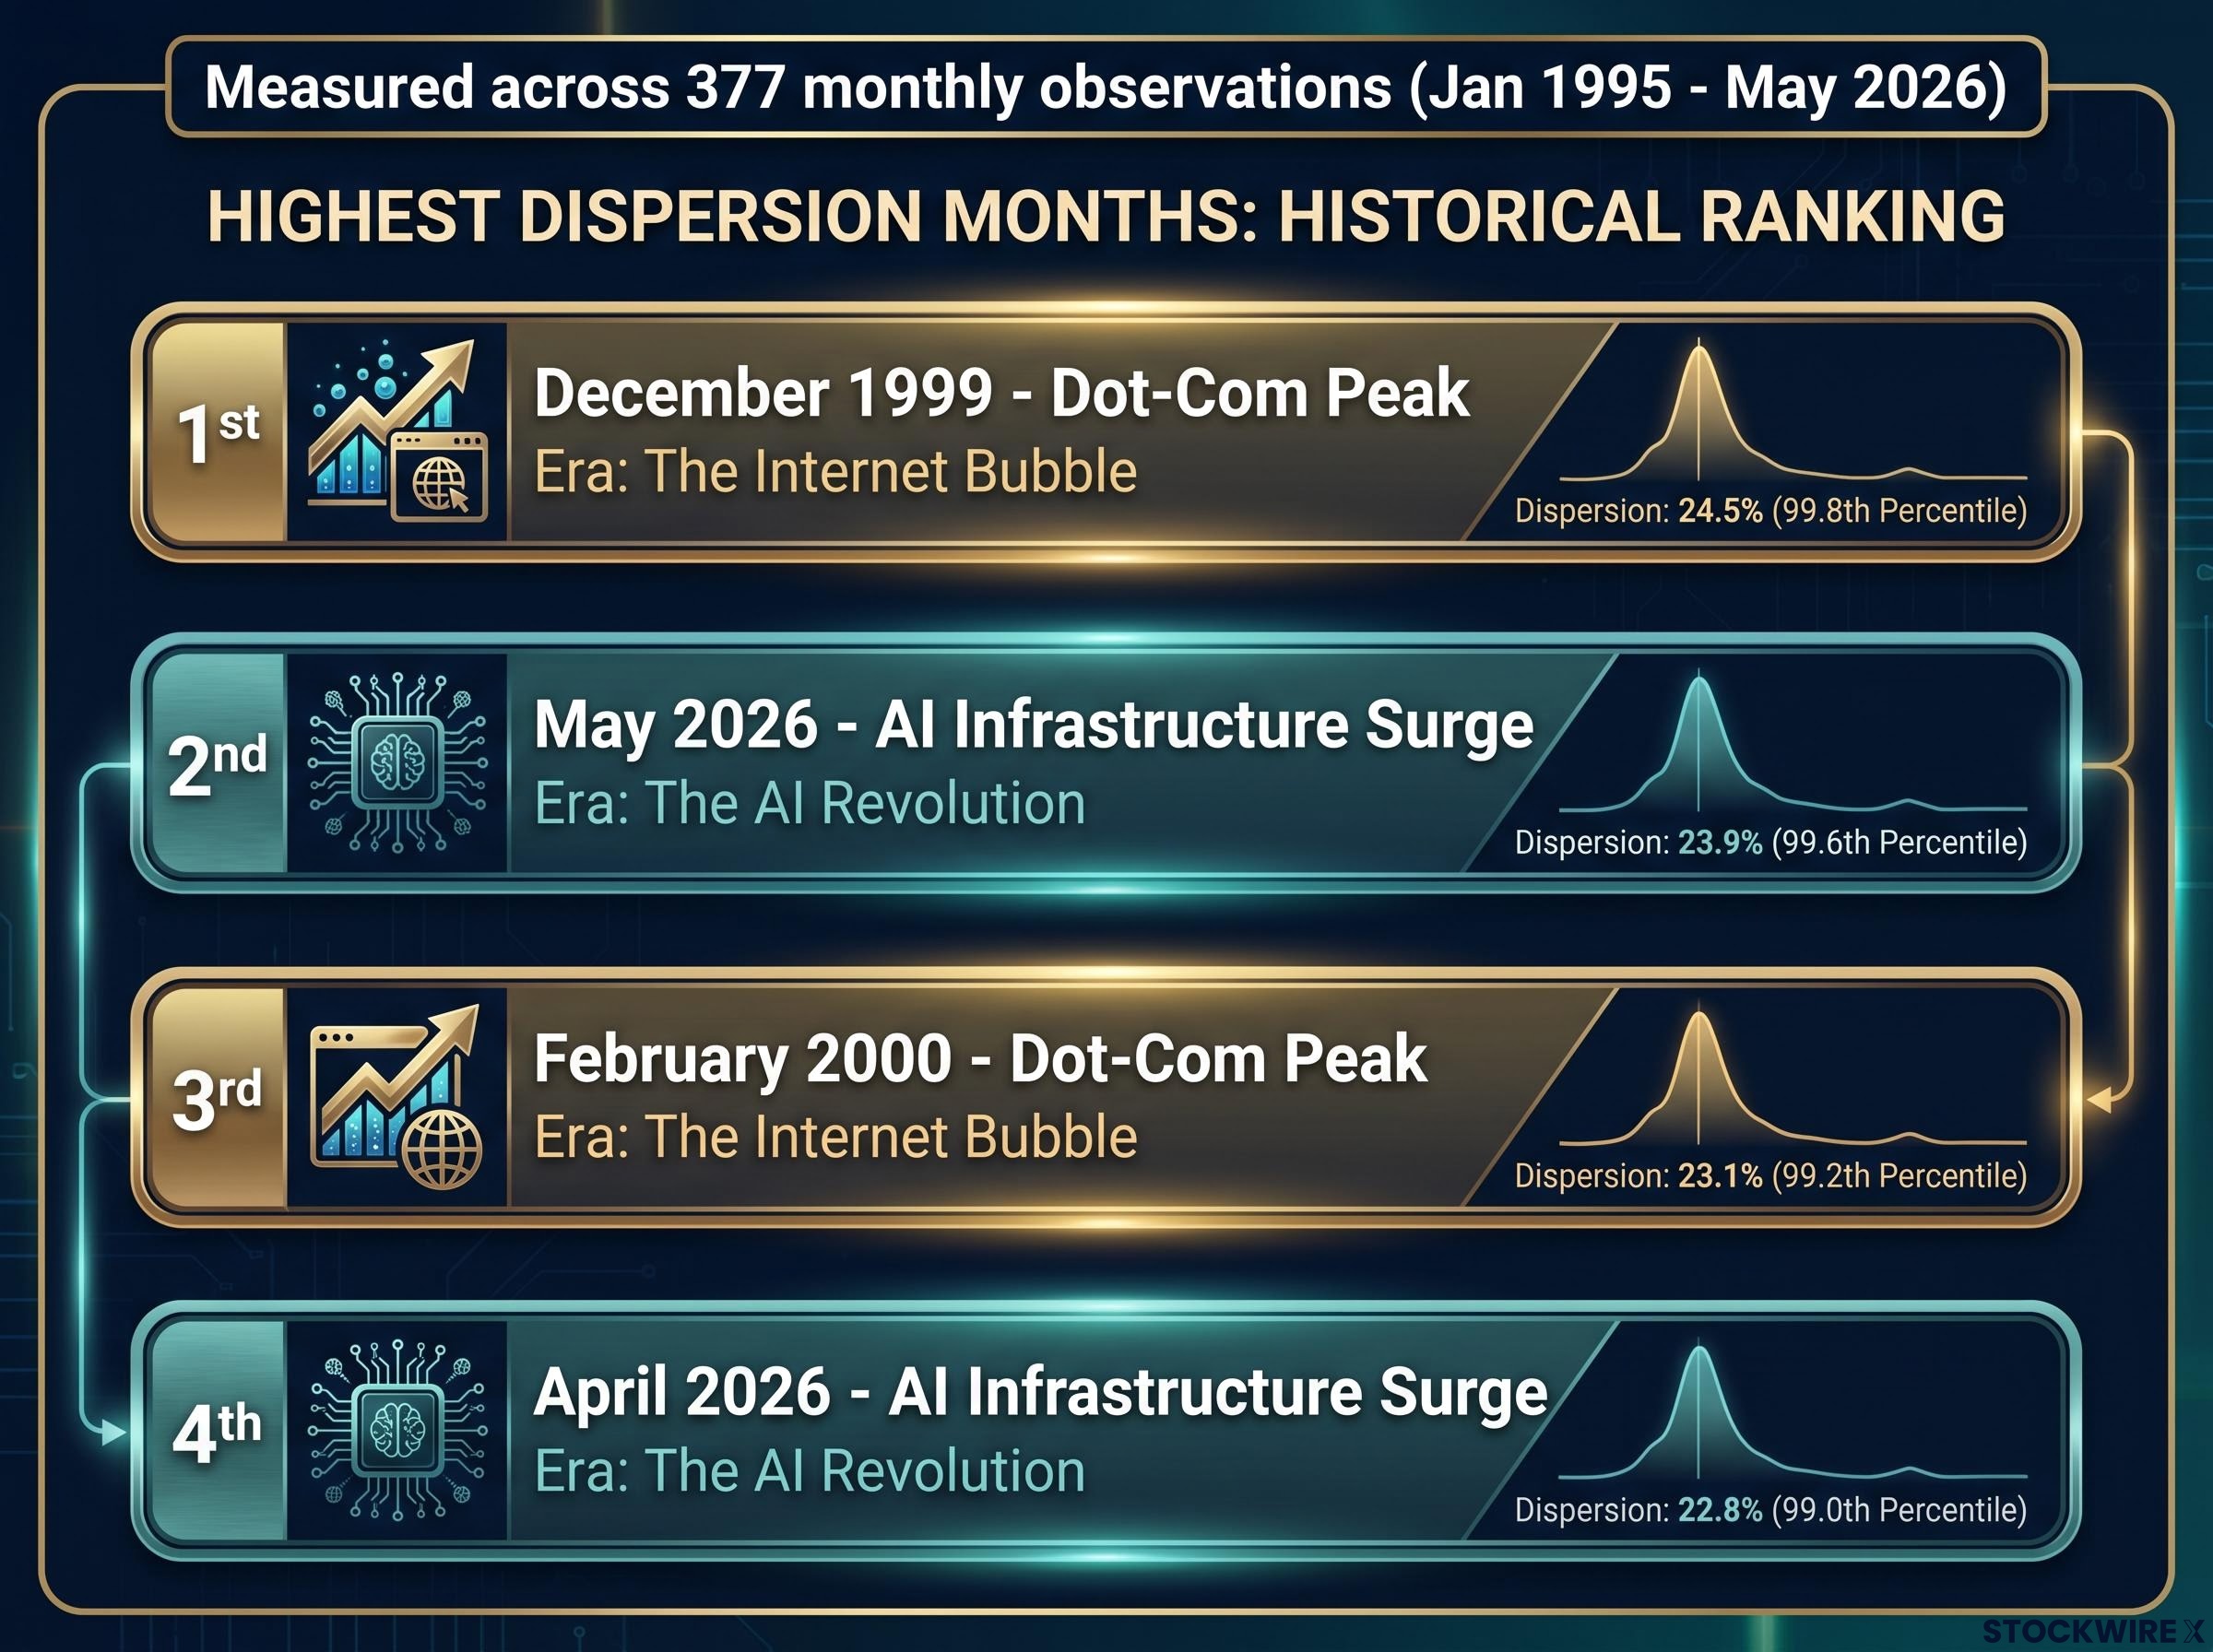
The dataset spans 377 monthly observations of the MSCI ACWI, from January 1995 through May 2026, measured using value-weighted cross-sectional standard deviation of monthly returns. The analysis, conducted by Owen A. Lamont, Senior Vice President and Portfolio Manager at Acadian Asset Management, ranks every month by dispersion magnitude.
The MSCI ACWI index methodology covers large and mid-cap equities across 23 developed and 24 emerging markets, capturing approximately 85% of the global investable equity opportunity, which is why value-weighted cross-sectional dispersion measured against it reflects the broadest available picture of global stock-level return divergence.
April 2026 ranked third highest on record. May 2026 ranked second.
The only months that exceeded them: December 1999 and February 2000, the statistical apex of the dot-com bubble.
Only December 1999 and February 2000 produced higher cross-sectional dispersion in global equities than May 2026, across 377 months of data.
The company these two months keep is exclusive. Across three decades covering the Asian financial crisis, the GFC, the COVID shock, and every growth scare in between, nothing else reached this tier. The four most extreme dispersion months in modern equity market history are now December 1999, May 2026, February 2000, and April 2026.
Daily dispersion readings remained elevated as June 2026 progressed. Forward-looking options pricing, as captured by the CBOE S&P 500 Dispersion Index, held near all-time highs through late June 2026, pointing to market expectations of continued above-normal dispersion in the near term.
| Rank | Month | Era | Descriptor |
|---|---|---|---|
| 1st | December 1999 | Dot-Com Peak | Technology euphoria at its statistical maximum |
| 2nd | May 2026 | AI Infrastructure Surge | Semiconductor supply chain stocks generated outsized returns |
| 3rd | February 2000 | Dot-Com Peak | Sustained divergence following the December 1999 extreme |
| 4th | April 2026 | AI Infrastructure Surge | Onset of the current high-dispersion regime |
For an allocator managing a global portfolio, this is a generational market condition, one that the quantitative record says has occurred at only one prior moment in modern equity history.
Across more than 800,000 individual stock-month observations since January 1995, Micron Technology ranked first among all stocks with index weights at or below 1% by magnitude of ACWI return contribution in May 2026. SK Hynix ranked fourth in the same universe over the same 30-year period.
Micron Technology ranked first among all stocks with index weights at or below 1% by ACWI return contribution, across more than 800,000 individual stock-month observations since January 1995.
This was not random. Both companies sit at the centre of the AI infrastructure supply chain:
The stocks that led dispersion in April and May 2026 exhibited a recognisable set of characteristics: elevated market beta, strong recent momentum, and a geographic footprint concentrated across the U.S., South Korea, and Taiwan. These attributes align closely with the semiconductor supply chain underpinning AI infrastructure investment. Certain large-cap technology equities posted monthly price gains of 50% to 100% during this period, a fact that goes directly to explaining both where individual stocks ranked and why aggregate dispersion reached historic levels.
The May 2026 event was not a generic technology rally. It was a precise, concentrated capital flow into the semiconductor layer of the AI stack. Whether the regime persists depends in part on whether that specificity holds.
The AI capex cycle sits at the centre of the durability question: hyperscalers including Microsoft, Google, Amazon, and Meta have committed a combined approximately $725 billion in 2026 capex guidance, yet Morningstar analysts have identified an 18-24 month lag before that spending converts to semiconductor revenue, a gap that bears directly on whether the capital flows driving dispersion are anchored in realised demand or running ahead of it.
The statistical parallel is precise. The four highest dispersion months in 30 years of ACWI history are December 1999, May 2026, February 2000, and April 2026. The structural intuition is also sound: both episodes involved technology-led enthusiasm producing extreme divergence between winners and the rest of the market.
Where the parallel holds:
Where it may diverge:
The semiconductor supercycle thesis received direct empirical backing during this period: Micron posted a record quarterly net income of $13.79 billion and Intel reached an all-time price high for the first time in 26 years, a contrast with the dot-com era’s dominant pattern of price gains running far ahead of any underlying earnings foundation.
With the CBOE S&P 500 Dispersion Index sitting near all-time highs through late June 2026, options pricing implied that investors were not anticipating a swift return to normal conditions, a pattern that echoes how dispersion behaved in the months following December 1999.
The source analysis by Owen A. Lamont at Acadian Asset Management explicitly does not make a valuation claim. It documents the dispersion phenomenon without asserting whether current prices are justified. This article follows the same discipline.
The question that actually matters for you is not whether 2026 looks like 2000, but whether the capital flows into AI semiconductors are anchored in durable demand or running ahead of it. The dispersion data tells you the regime exists. It does not tell you how it ends.
The CBOE Dispersion Index signal and the post-December 1999 historical precedent both point in the same direction: treat elevated dispersion as a regime characteristic to be monitored, not a transient spike to be waited out.
Active manager tracking error from concentration-related regulatory constraints compounded the problem during this period: under the Investment Company Act of 1940, individual fund positions are capped at 5% of assets, making it structurally impossible for most active funds to match benchmark weights in names like Nvidia that exceed 6-7% of index weight, independent of any dispersion-driven underweight in stocks like Micron or SK Hynix.
The central distinction this analysis builds is simple to state and consequential to miss: concentration and dispersion are not the same risk. An allocator who managed concentration exposure heading into 2026 was not thereby managing dispersion exposure. The two require different monitoring frameworks, different risk models, and different portfolio adjustments.
The forward-looking posture the evidence supports is equally direct. Treat elevated dispersion as a regime. Monitor the three variables outlined above. Hold the dot-com parallel as a reference frame rather than a prediction, and use it to ask the right question: whether the capital flows generating this dispersion are anchored in durable demand.
The CBOE Dispersion Index signal and the persistence of elevated daily dispersion into June 2026 mean the analytical work required by this regime is ongoing. The anomaly has been documented. The regime has not concluded.
This article is for informational purposes only and should not be considered financial advice. Investors should conduct their own research and consult with financial professionals before making investment decisions. Past performance does not guarantee future results. Financial projections are subject to market conditions and various risk factors.
Return dispersion is the cross-sectional standard deviation of individual stock returns within an index for a given period, weighted by market capitalisation. A high reading means some stocks surged dramatically while others lagged or fell, rather than most stocks moving in the same direction by roughly the same amount.
Market concentration describes how much index weight has accumulated in a small number of dominant stocks, a structural condition that builds over years. Return dispersion measures how widely individual stock returns diverge from one another in a given period and can spike within a single month, independent of any change in how the index weight is distributed.
Both companies sit at the centre of the AI infrastructure supply chain, with Micron producing DRAM and NAND flash memory and SK Hynix dominating High Bandwidth Memory production critical to AI accelerators. Their stock prices moved with such force that two names holding roughly 1.1% of index weight accounted for approximately 17% of the ACWI's total May 2026 return.
Across 377 monthly observations of the MSCI ACWI since January 1995, May 2026 ranked second highest by cross-sectional dispersion, exceeded only by December 1999. The four most extreme dispersion months in 30 years of global equity history are now December 1999, May 2026, February 2000, and April 2026.
Allocators should track factor exposure and attribution (since standard risk models calibrated to normal regimes underestimate tracking error from underweights in dispersion-driving stocks), the active management opportunity set (wider winner-loser gaps expand theoretical alpha available), and dispersion regime duration via forward-looking signals like the CBOE S&P 500 Dispersion Index, which remained near all-time highs through late June 2026.