
May PCE Inflation Hits Target, Keeping Fed on Hold
1 hr ago
Gold has crossed below $4,000 per ounce for the first time since November 2025, breaking a technical floor that had held for seven months. The breach is not a wobble. It is a clean breakdown of a level that had defined the lower boundary of gold’s trading range since late last year.
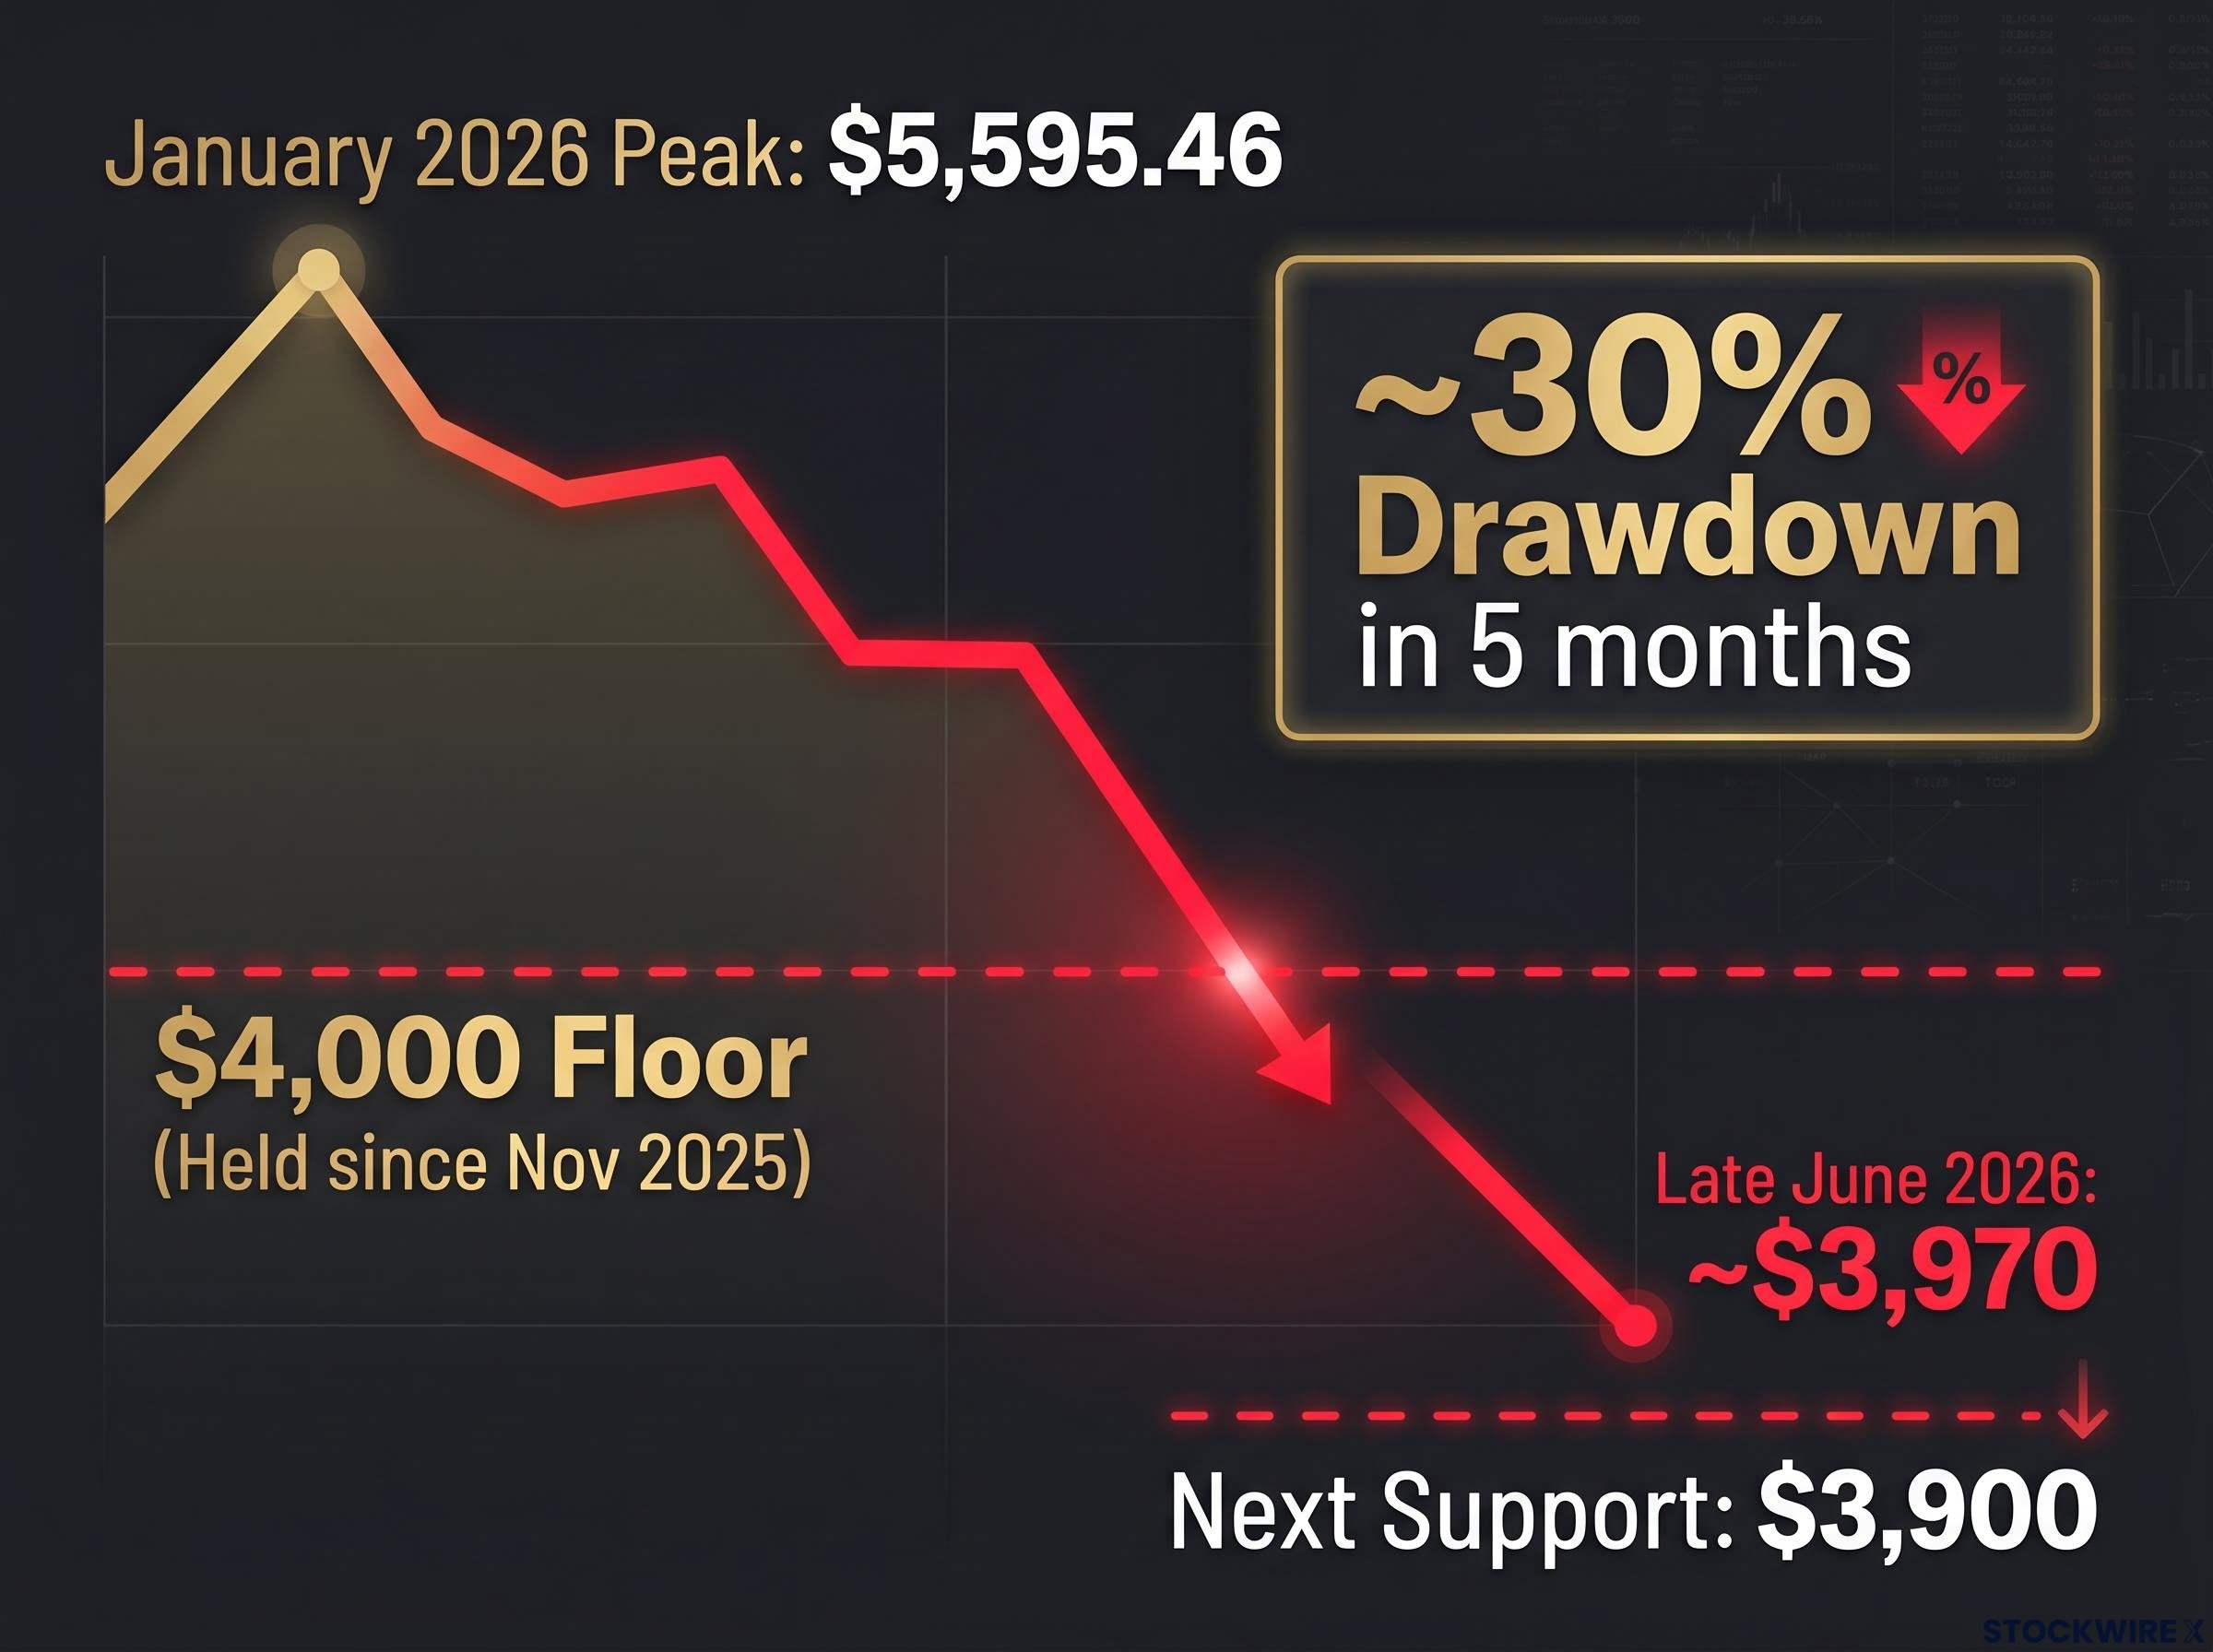
The scale of the move demands more than a headline. Gold hit an all-time high of $5,595.46 per ounce in January 2026. It is now trading at roughly $3,970. That is a drawdown of approximately 30% in five months, an extraordinary decline for an asset most investors hold precisely because it is supposed to be stable.
Here is what is driving the selloff, what it tells you about the current macro environment, and what to watch over the coming weeks.
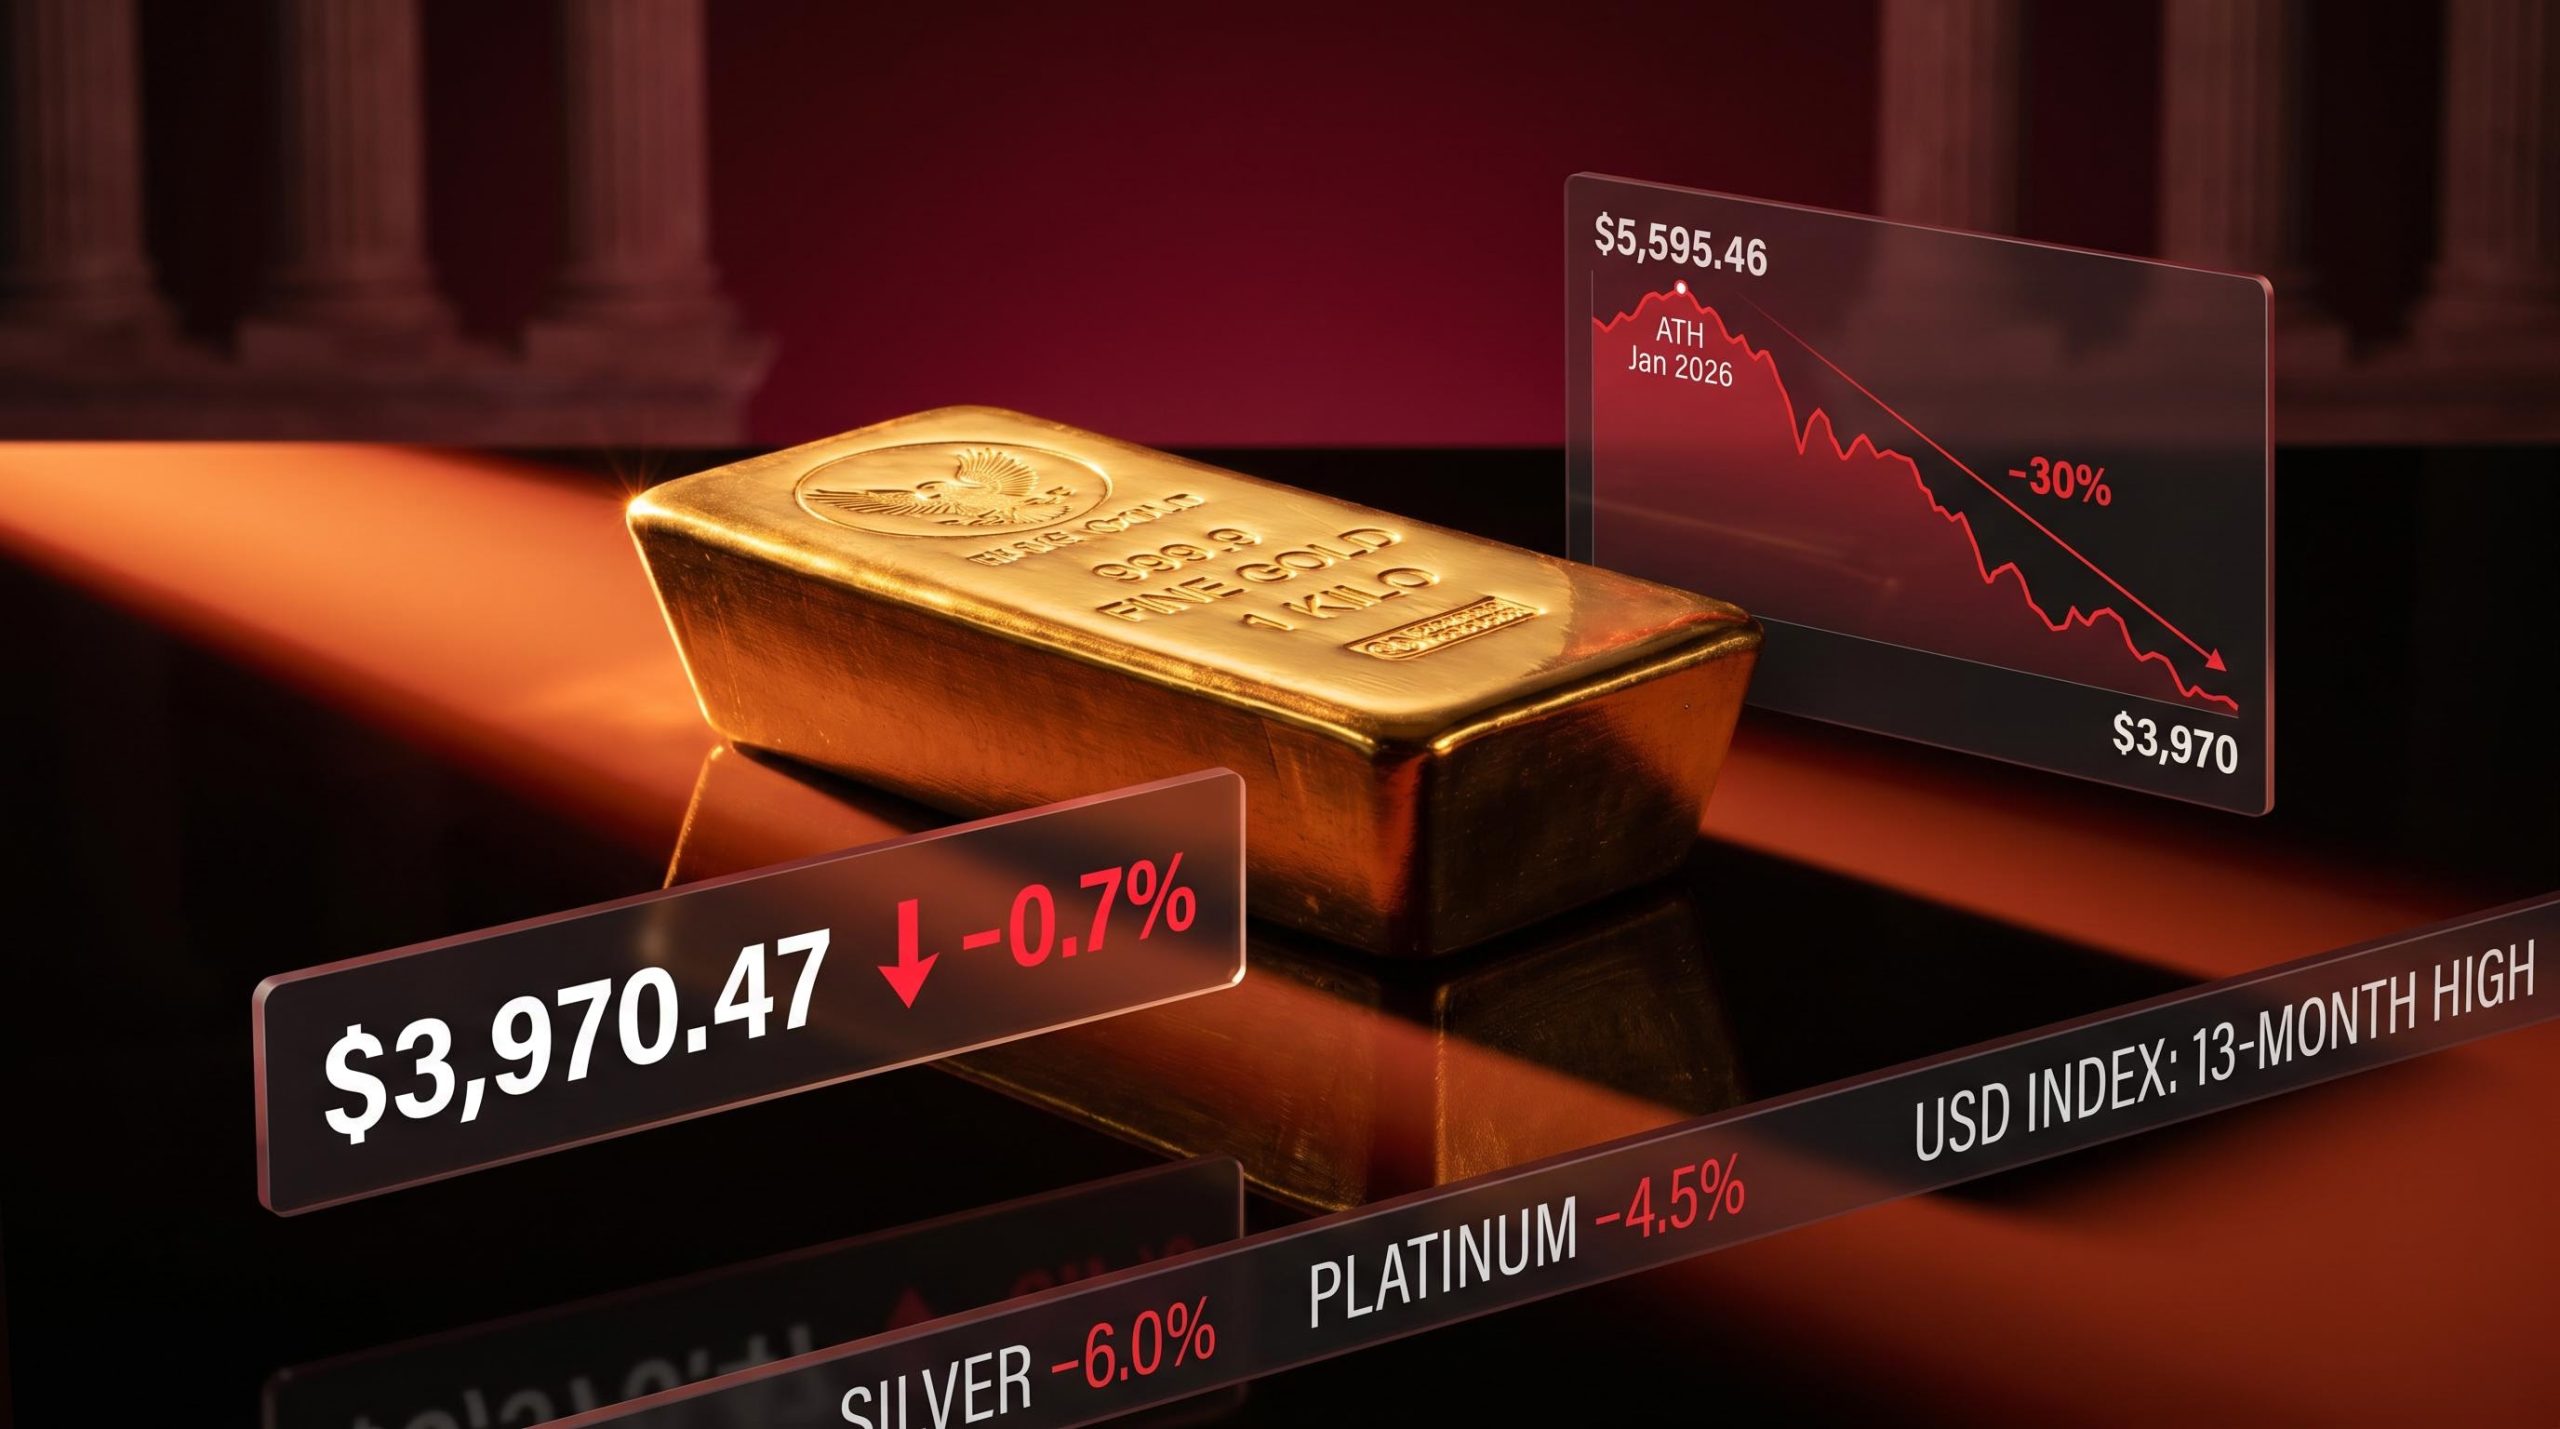
By 22:17 ET on 24-25 June 2026, spot gold had declined around 0.7% to $3,970.47 per ounce, per Investing.com reporting by Ayushman Ojha, while U.S. gold futures settled around 0.5% lower at $3,990.90 in the same session.
The $4,000 level had not been breached since November 2025. For seven months, it functioned as both a technical and psychological floor, a price below which buyers consistently stepped in. That support is now gone.
The drawdown in context: Measured against its January 2026 all-time high of $5,595.46 per ounce, gold has now given back roughly 30% of its value, marking the sharpest peak-to-trough retreat in years for a traditionally defensive asset.
Whatever force had kept gold above $4,000 since November has been overwhelmed. Until the metal reclaims that level convincingly, the psychological weight of a round-number floor is working against holders, not for them.
Gold’s decline is not a mystery if you understand the two mechanical forces pressing on it simultaneously. Both are structural, not sentiment-driven, and both are operating at multi-month extremes right now.
The first is dollar strength. Gold is priced globally in U.S. dollars, so when the dollar appreciates, international buyers face a higher effective price in their local currencies. That suppresses overseas demand even if nothing else about gold’s fundamentals has changed.
The second is opportunity cost. Gold pays no interest and no dividend. When Treasury yields and cash rates rise, holding gold becomes more expensive in relative terms, because every ounce you own is capital that could be earning yield elsewhere.
The dual pressure from bond yields and dollar strength has a documented precedent: the 2013 Taper Tantrum produced gold drawdowns of around 28% and silver declines exceeding 35% when both forces moved simultaneously in the same direction, a historical parallel that gives context to the speed of the current selloff.
ING analysts noted in a recent note that investor focus has moved away from safe-haven demand and towards the ramifications of higher borrowing costs and tighter financial conditions. The dollar at a 13-month high is not background noise. It is the single most consistent mechanical force pressing gold lower right now.
The rate expectations embedded in futures markets tell you where traders collectively believe policy is heading, and right now, their bet is pointed squarely at further tightening.
CME FedWatch data shows traders placing around a one-in-three chance on a rate rise at the July 2026 Fed meeting, with that figure climbing to roughly 66% for the September 2026 meeting.
The Fed tightening bias reflected in CME FedWatch probabilities is consistent with what FOMC minutes have signaled for months: committee members set a high bar for easing, requiring sustained disinflation toward 2% and meaningful labour market deterioration before a pivot, neither of which is currently in evidence.
| Fed Meeting | Rate Hike Probability | What It Means for Gold |
|---|---|---|
| July 2026 | ~33% (one-in-three) | Meaningful but not base case; gold vulnerable if odds rise |
| September 2026 | ~66% (two-thirds) | Base-case tightening already priced; gold under sustained pressure |
A 66% probability of a September rate hike means markets are not treating tightening as a tail risk. They are treating it as the base case, and that expectation is already embedded in the dollar strength and the gold selloff.
The next major data point is the Personal Consumption Expenditures (PCE) index, the Fed’s preferred measure of inflation, which markets are watching closely for signals on where policy heads next. A hotter reading reinforces the tightening case and pressures gold further. A softer reading could provide temporary relief by cooling rate-hike odds.
Gold’s decline is not happening in isolation. Silver and platinum both registered sharp losses across the same sessions, confirming that the selloff is a sector-wide macro repricing, not an unwind of gold-specific speculation.
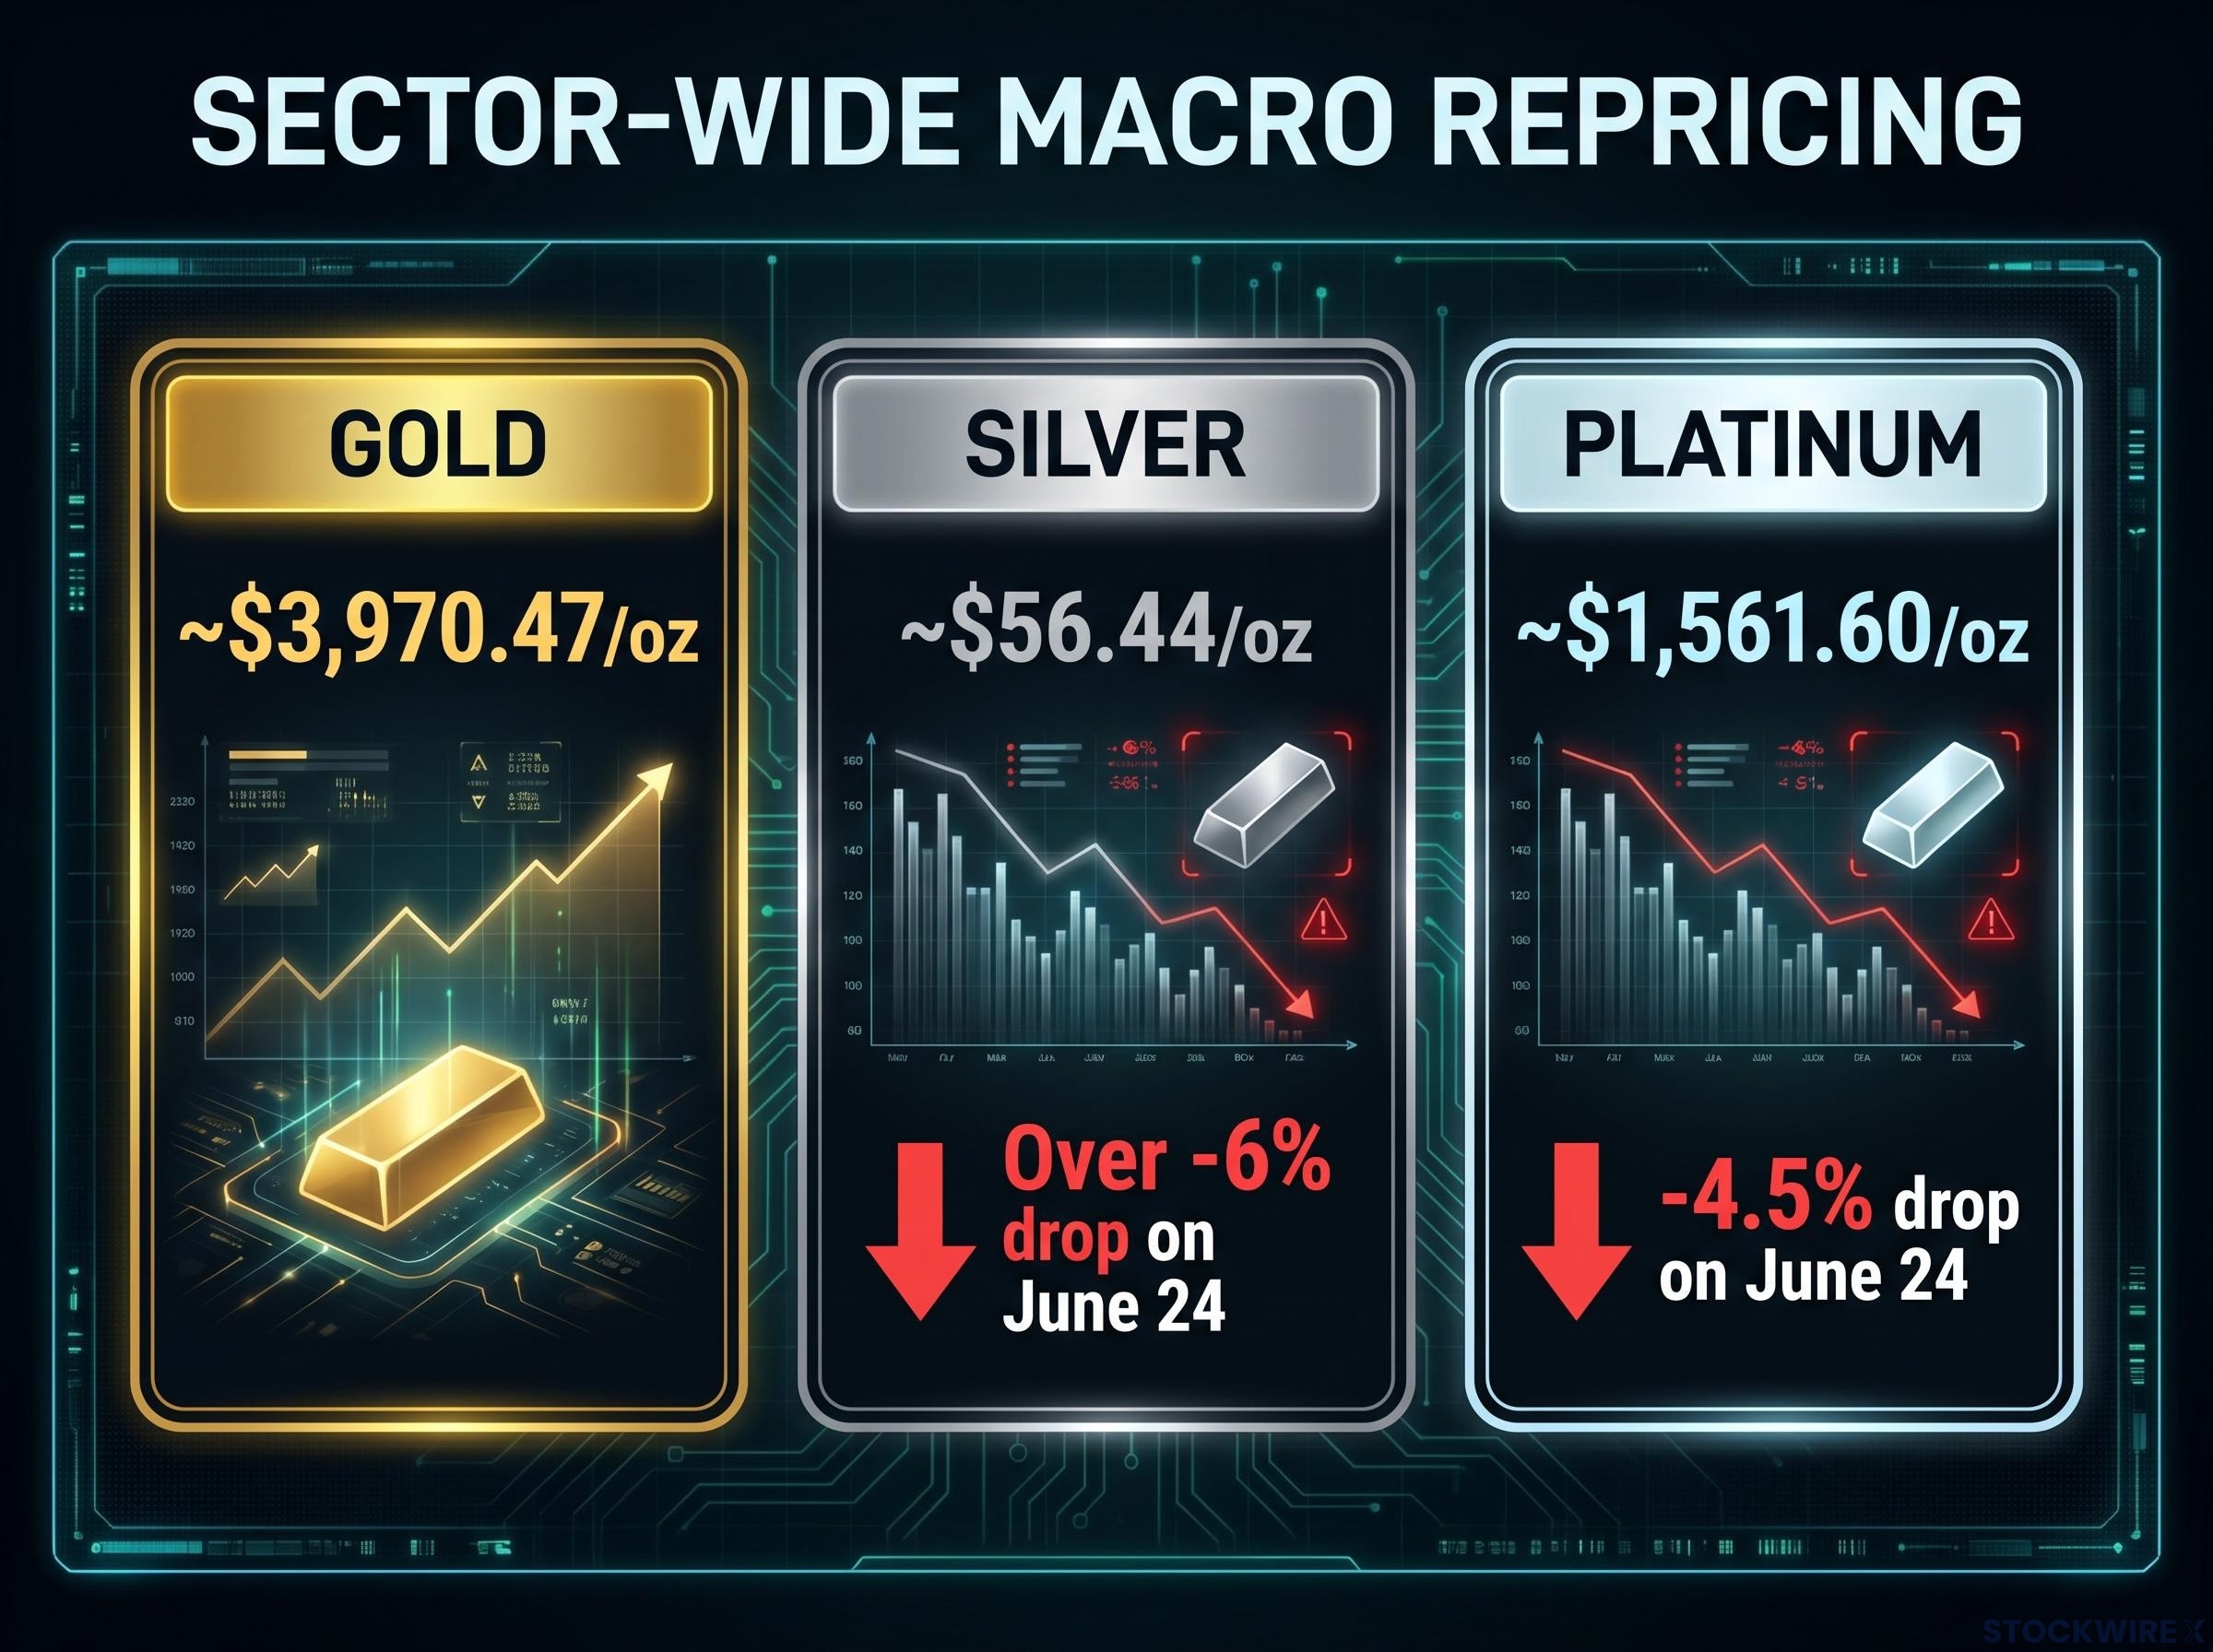
| Metal | June 24 Move | June 25 Move | Current Price |
|---|---|---|---|
| Gold | Sharp decline | –0.7% | ~$3,970.47/oz |
| Silver | –6%+ | –1.7% | ~$56.44/oz |
| Platinum | –4.5% | –1.5% | ~$1,561.60/oz |
Silver falling more than 6% in a single session on 24 June is particularly telling. According to ING analysts, the silver market is still forecast to run a supply deficit, though a number of its previously strong demand drivers are now losing momentum. When an asset with a structural supply shortage cannot hold its price against macro headwinds, it tells you that regime forces are overriding commodity fundamentals in the short run.
For investors holding diversified precious metals positions, the message is clear: rotating between gold, silver, and platinum is unlikely to provide shelter in this environment. The headwind is the macro backdrop itself.
Gold’s 30% decline from its January 2026 peak is not a single event. It is the result of three forces arriving in sequence, each compounding the one before it.
The geopolitical risk premium that accumulated during U.S.-Iran tensions was never a durable price floor; it was a conditional premium that unwound the moment diplomacy advanced, and that unwind accelerated the macro-driven selloff rather than competing with it.
When a previous bullish driver fades at the same moment a new bearish driver strengthens, prices can overshoot to the downside past what fundamentals alone would justify. That is the dynamic playing out now, and it explains both the speed and the depth of the decline.
Four catalysts and levels will determine gold’s near-term direction. Each is observable, and each will move the price:
The $3,900 level is the next line in the sand. A clean break below it would signal this is not a pullback but the start of a deeper move lower.
ING analysts framed the outlook in terms of two specific conditions required before gold stabilises: either the rates narrative breaks (weaker PCE, dovish Fed signals, or falling rate-hike probabilities) or a fresh wave of risk-off sentiment revives safe-haven demand at sufficient scale. As of late June 2026, neither condition appears imminent.
Gold is facing four simultaneous adverse forces that reinforce one another: a dollar at a 13-month high, elevated and potentially rising interest rates, easing geopolitical tensions removing safe-haven demand, and sector-wide precious metals weakness confirming the repricing is broad, not isolated.
The long-term structural case for gold, central bank buying, inflation hedging, diversification away from the dollar, may still be intact. But those forces are not the dominant driver of near-term price action. In this macro regime, they are overwhelmed.
For investors wanting to weigh the near-term selloff against institutional recovery forecasts, our dedicated guide to Wall Street gold price targets for 2026 covers the Goldman Sachs, UBS, and JPMorgan frameworks, including the central bank accumulation and rate-cut scenarios that underpin the bull case.
The path of least resistance remains lower until one of two things changes: either the inflation-and-rates narrative breaks, or a fresh wave of risk-off sentiment revives safe-haven demand. Neither appears imminent. The PCE release is the next scheduled moment when the near-term picture could meaningfully shift.
This article is for informational purposes only and should not be considered financial advice. Investors should conduct their own research and consult with financial professionals before making investment decisions. Past performance does not guarantee future results. Financial projections are subject to market conditions and various risk factors.
Gold is being squeezed by two simultaneous mechanical forces: a U.S. dollar index at a 13-month high, which raises gold's effective price for international buyers, and rising interest rates, which increase the opportunity cost of holding a non-yielding asset. A fading geopolitical risk premium from easing U.S.-Iran tensions has compounded the selloff.
The $4,000 level had acted as a technical and psychological floor since November 2025, a price at which buyers consistently stepped in over seven months. Its breach signals that the forces driving the selloff have overwhelmed that support, and the psychological weight of that round-number level now works against holders rather than for them.
Analysts are watching $3,900 per ounce as the next major technical threshold. A sustained break below that level would confirm the post-$4,000 breach is the start of a deeper leg lower, not a brief pullback.
CME FedWatch data shows roughly a 66% probability of a September 2026 rate hike, meaning markets are treating further tightening as the base case, not a tail risk. Higher rates make yield-bearing assets more attractive relative to non-yielding gold, and that expectation is already embedded in both dollar strength and the current gold selloff.
Silver dropped more than 6% in a single session on 24 June 2026 despite a structural supply deficit in that market, which confirms the selloff is a sector-wide macro repricing driven by dollar strength and rate expectations rather than a gold-specific unwind. When macro regime forces override commodity fundamentals this decisively, rotating between precious metals provides little shelter.


