
Eli Lilly at 40x Earnings: Expensive Stock, Underpenetrated Market
1 hr ago
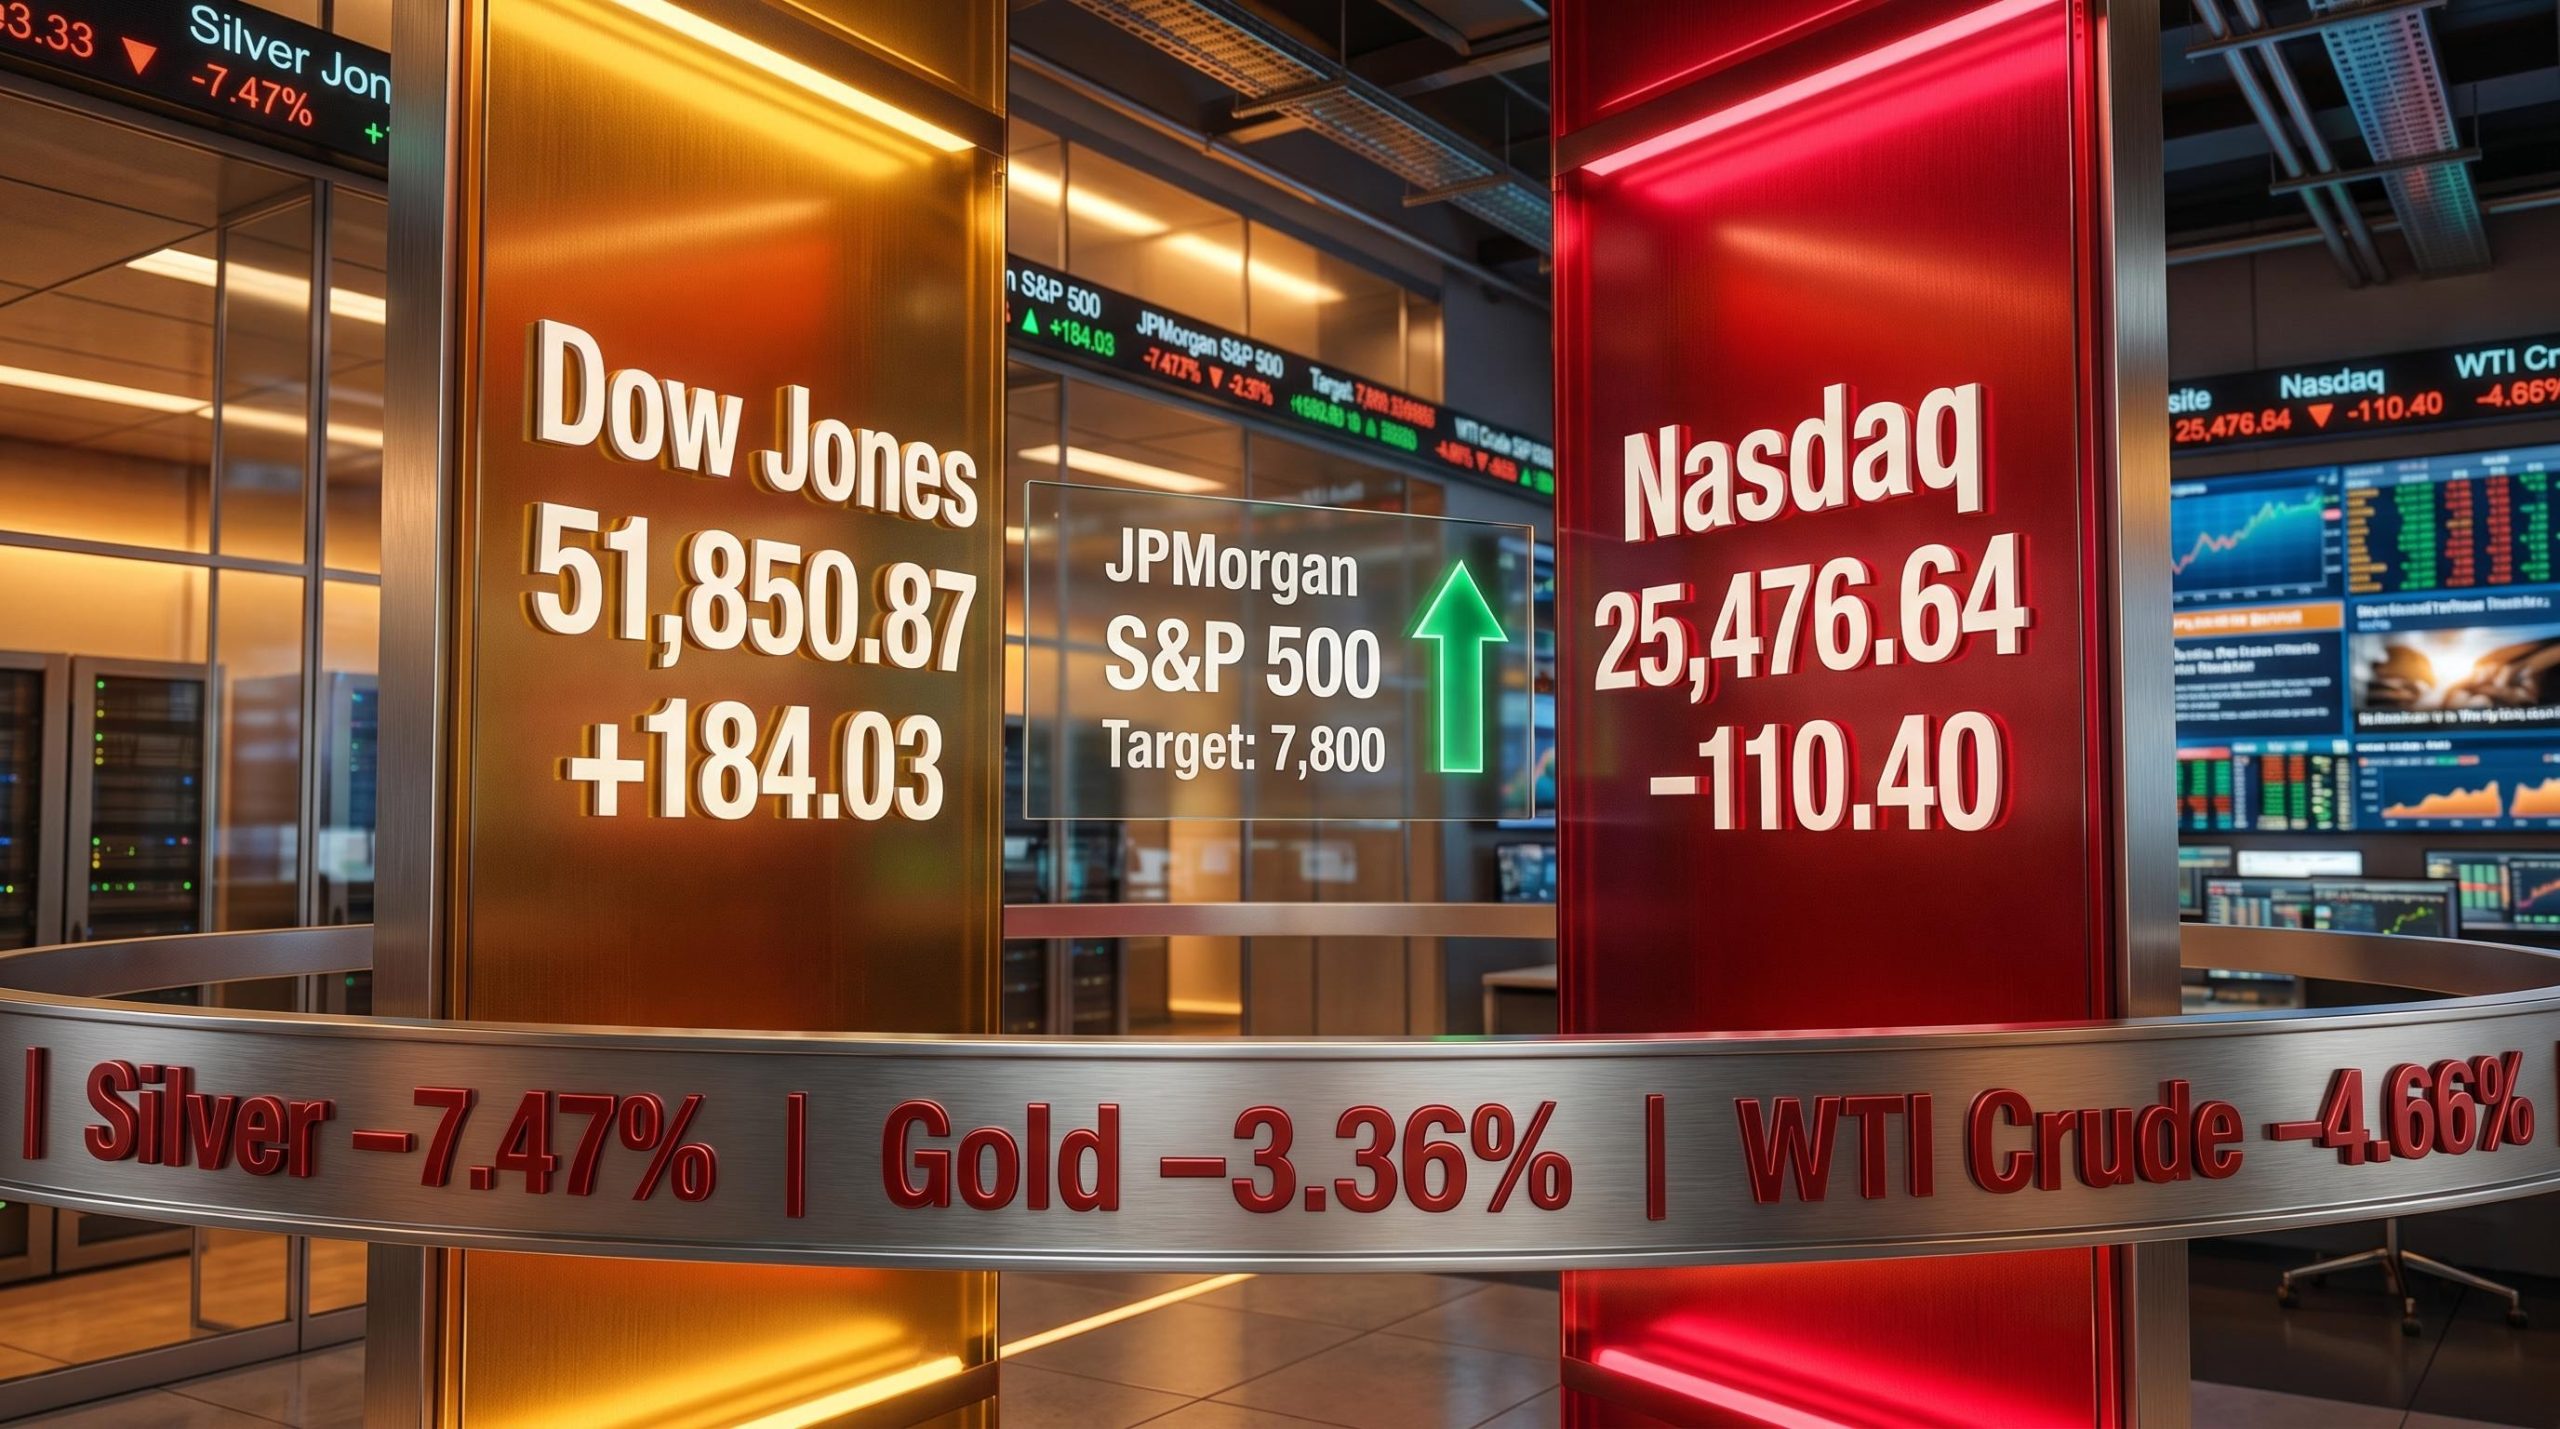
The Dow rose 184 points on 24 June 2026. The Nasdaq fell 110. Commodities sold off at their sharpest clip in months. And in the middle of all of it, JPMorgan raised its S&P 500 price target, describing the earnings environment as something with “no historical precedent.”
That combination does not resolve into a single headline. 24 June was a session that rewarded close reading over headline-scanning: three developments landed simultaneously, each operating on a different time horizon and telling a different story about where money moved, why, and what comes next.
Here is how to separate the short-term noise from the structural signals that actually matter to your positioning. Each of the three developments below carries a distinct implication, and mapping them onto the right time horizon is the difference between reacting and being prepared.
Start with what the indices did, not what any single one of them did. The Dow Jones Industrial Average closed at 51,850.87, up 184.03 points (+0.36%). The S&P 500 finished at 7,359.11, down 6.35 points (-0.09%). The Nasdaq Composite settled at 25,476.64, down 110.40 points (-0.43%).
| Index | Close | Change | % Change |
|---|---|---|---|
| Dow Jones Industrial Average | 51,850.87 | +184.03 pts | +0.36% |
| S&P 500 | 7,359.11 | −6.35 pts | −0.09% |
| Nasdaq Composite | 25,476.64 | −110.40 pts | −0.43% |
That spread is a rotation signal, not a directional risk-off move. The Dow is price-weighted across 30 blue-chip names with significant industrial and financial representation. The Nasdaq is market-cap-weighted with heavy technology concentration. When one rises and the other falls, it means money moved between sectors, not out of equities altogether.
The individual movers confirmed the pattern:
The high-multiple technology names that dominate the Nasdaq absorbed selling pressure while the broader blue-chip index held. That spread tells you institutional capital rotated away from growth, and reading that rotation is more useful for positioning decisions than reading either index result alone.
Institutional capital rotation out of high-multiple technology into traditional-economy sectors has been building throughout 2026, with energy gaining more than 22% year-to-date and industrials more than 16%, while the Morningstar US Market Index returned less than 1%, making the Dow-Nasdaq divergence on 24 June a continuation of a pattern rather than an isolated session anomaly.
Index reshuffles usually look like administrative housekeeping. A committee reviews the components, swaps one name for another, and the market moves on. The Alphabet-for-Verizon switch announced within the 24 June reporting window is different in character, even if the mechanics are familiar.
Verizon out, Alphabet in: the Dow’s composition story shifts from legacy connectivity to AI-era infrastructure in a single swap.
The Dow Jones Industrial Average (DJIA) is price-weighted, meaning a stock’s influence on the index is determined by its share price, not its market capitalisation. A stock trading at $200 exerts twice the influence of one trading at $100, regardless of company size. Alphabet’s exact weight will depend on its share price at the time of inclusion relative to the other 29 components, but the substitution shifts the index’s character meaningfully: out goes a legacy telecom, in comes a company operating across AI, cloud computing, search, and digital advertising.
Alphabet’s index weight in the Dow will be determined by its share price at inclusion relative to the other 29 components, and at the $340-$350 range where it has been trading, it would immediately rank among the top-tier price contributors, comparable to UnitedHealth and Goldman Sachs rather than sitting near the bottom as Verizon has.
Every fund and ETF tracking the Dow must buy Alphabet and sell Verizon on the effective rebalancing date. That creates predictable short-term flow dynamics: buying pressure on Alphabet shares and supply pressure on Verizon. For any investor holding a Dow-tracking fund, this change means their vehicle’s exposure to AI-adjacent technology increases automatically on the effective date, with no action required on their part. Index reshuffles are not passive events for passive investors.
The three major U.S. equity indices each use a different construction method, and that single design choice explains why the same trading session produced three different results on 24 June.
The DJIA is price-weighted across 30 large-cap stocks. Each component’s influence scales with its share price. The S&P 500 is market-capitalisation-weighted (where each company’s weight reflects its total market value) across 500 stocks, meaning the largest companies by size dominate. The Nasdaq Composite is also market-cap-weighted, but its component list skews heavily toward technology.
Price-weighted index mechanics mean that a stock trading at $400 exerts roughly eight times the influence of one trading at $50, regardless of how large either company is by market capitalisation, which is why a handful of high-priced components can move the DJIA in a direction that conflicts with broader market sentiment.
| Index | Construction | Components | 24 June Performance |
|---|---|---|---|
| DJIA | Price-weighted | 30 | +0.36% |
| S&P 500 | Market-cap-weighted | 500 | −0.09% |
| Nasdaq Composite | Market-cap-weighted (tech-heavy) | 3,000+ | −0.43% |
When you buy a fund that tracks the Dow, you are not buying the same slice of the American economy as when you buy an S&P 500 tracker. The Dow gives you 30 names weighted by price; the S&P 500 gives you 500 names weighted by size. That distinction is foundational to any informed index-investing decision, and sessions like 24 June make the practical consequence visible: same market, three different readings.
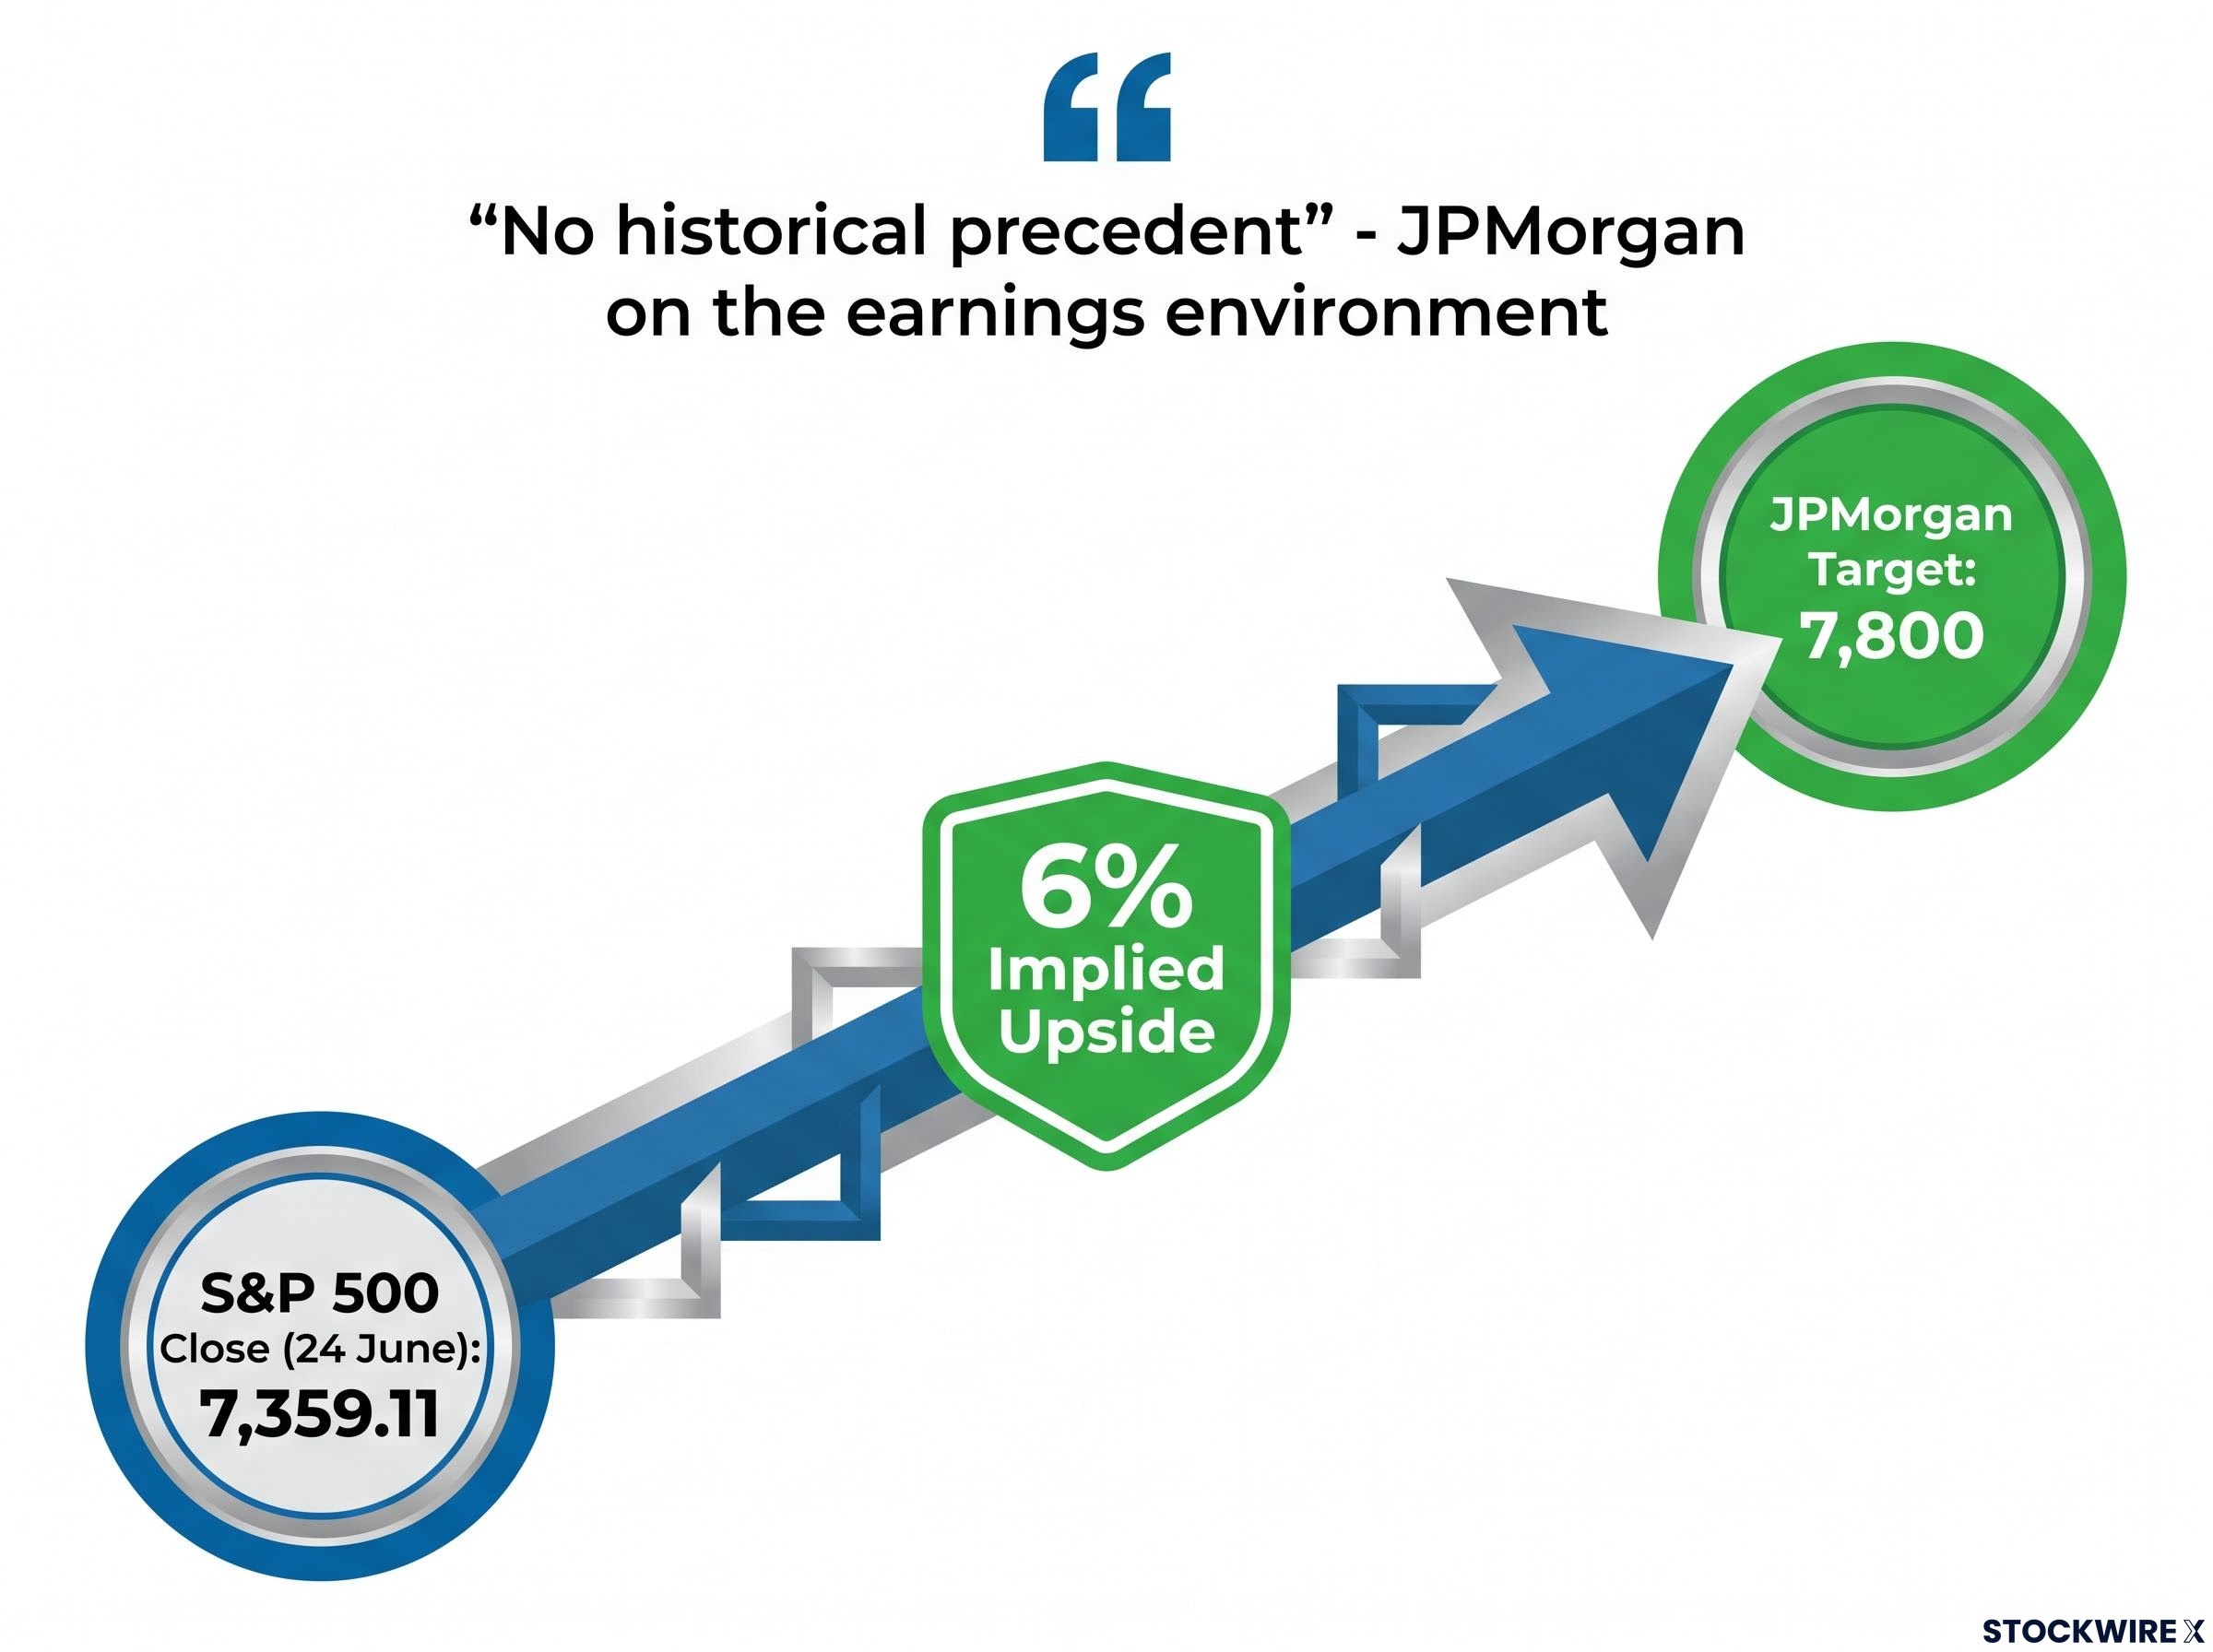
JPMorgan raised its S&P 500 price target to 7,800. At the 24 June close of 7,359.11, that implies approximately 6% upside from here.
The number matters less than the reasoning behind it.
JPMorgan described the current earnings revision environment as having “no historical precedent.”
That language is worth pausing on. Major institutional banks do not use phrases like “no historical precedent” casually. When JPMorgan frames a call in those terms, it signals that the institution’s research team could not find a prior cycle that matches the current earnings upgrade trajectory, and they are willing to put that assessment on a published target.
Supporting data from the same session reinforced the thesis:
Micron’s result is the kind of data point that makes JPMorgan’s language concrete. AI infrastructure spending is converting to earnings, not just multiple expansion, in specific semiconductor names. A price target revision of this nature from a major bank is less a prediction and more a signal that large capital allocators are leaning into the AI earnings cycle. That tells you something about where institutional money may be positioned heading into the next quarter.
Past performance does not guarantee future results. Financial projections are subject to market conditions and various risk factors.
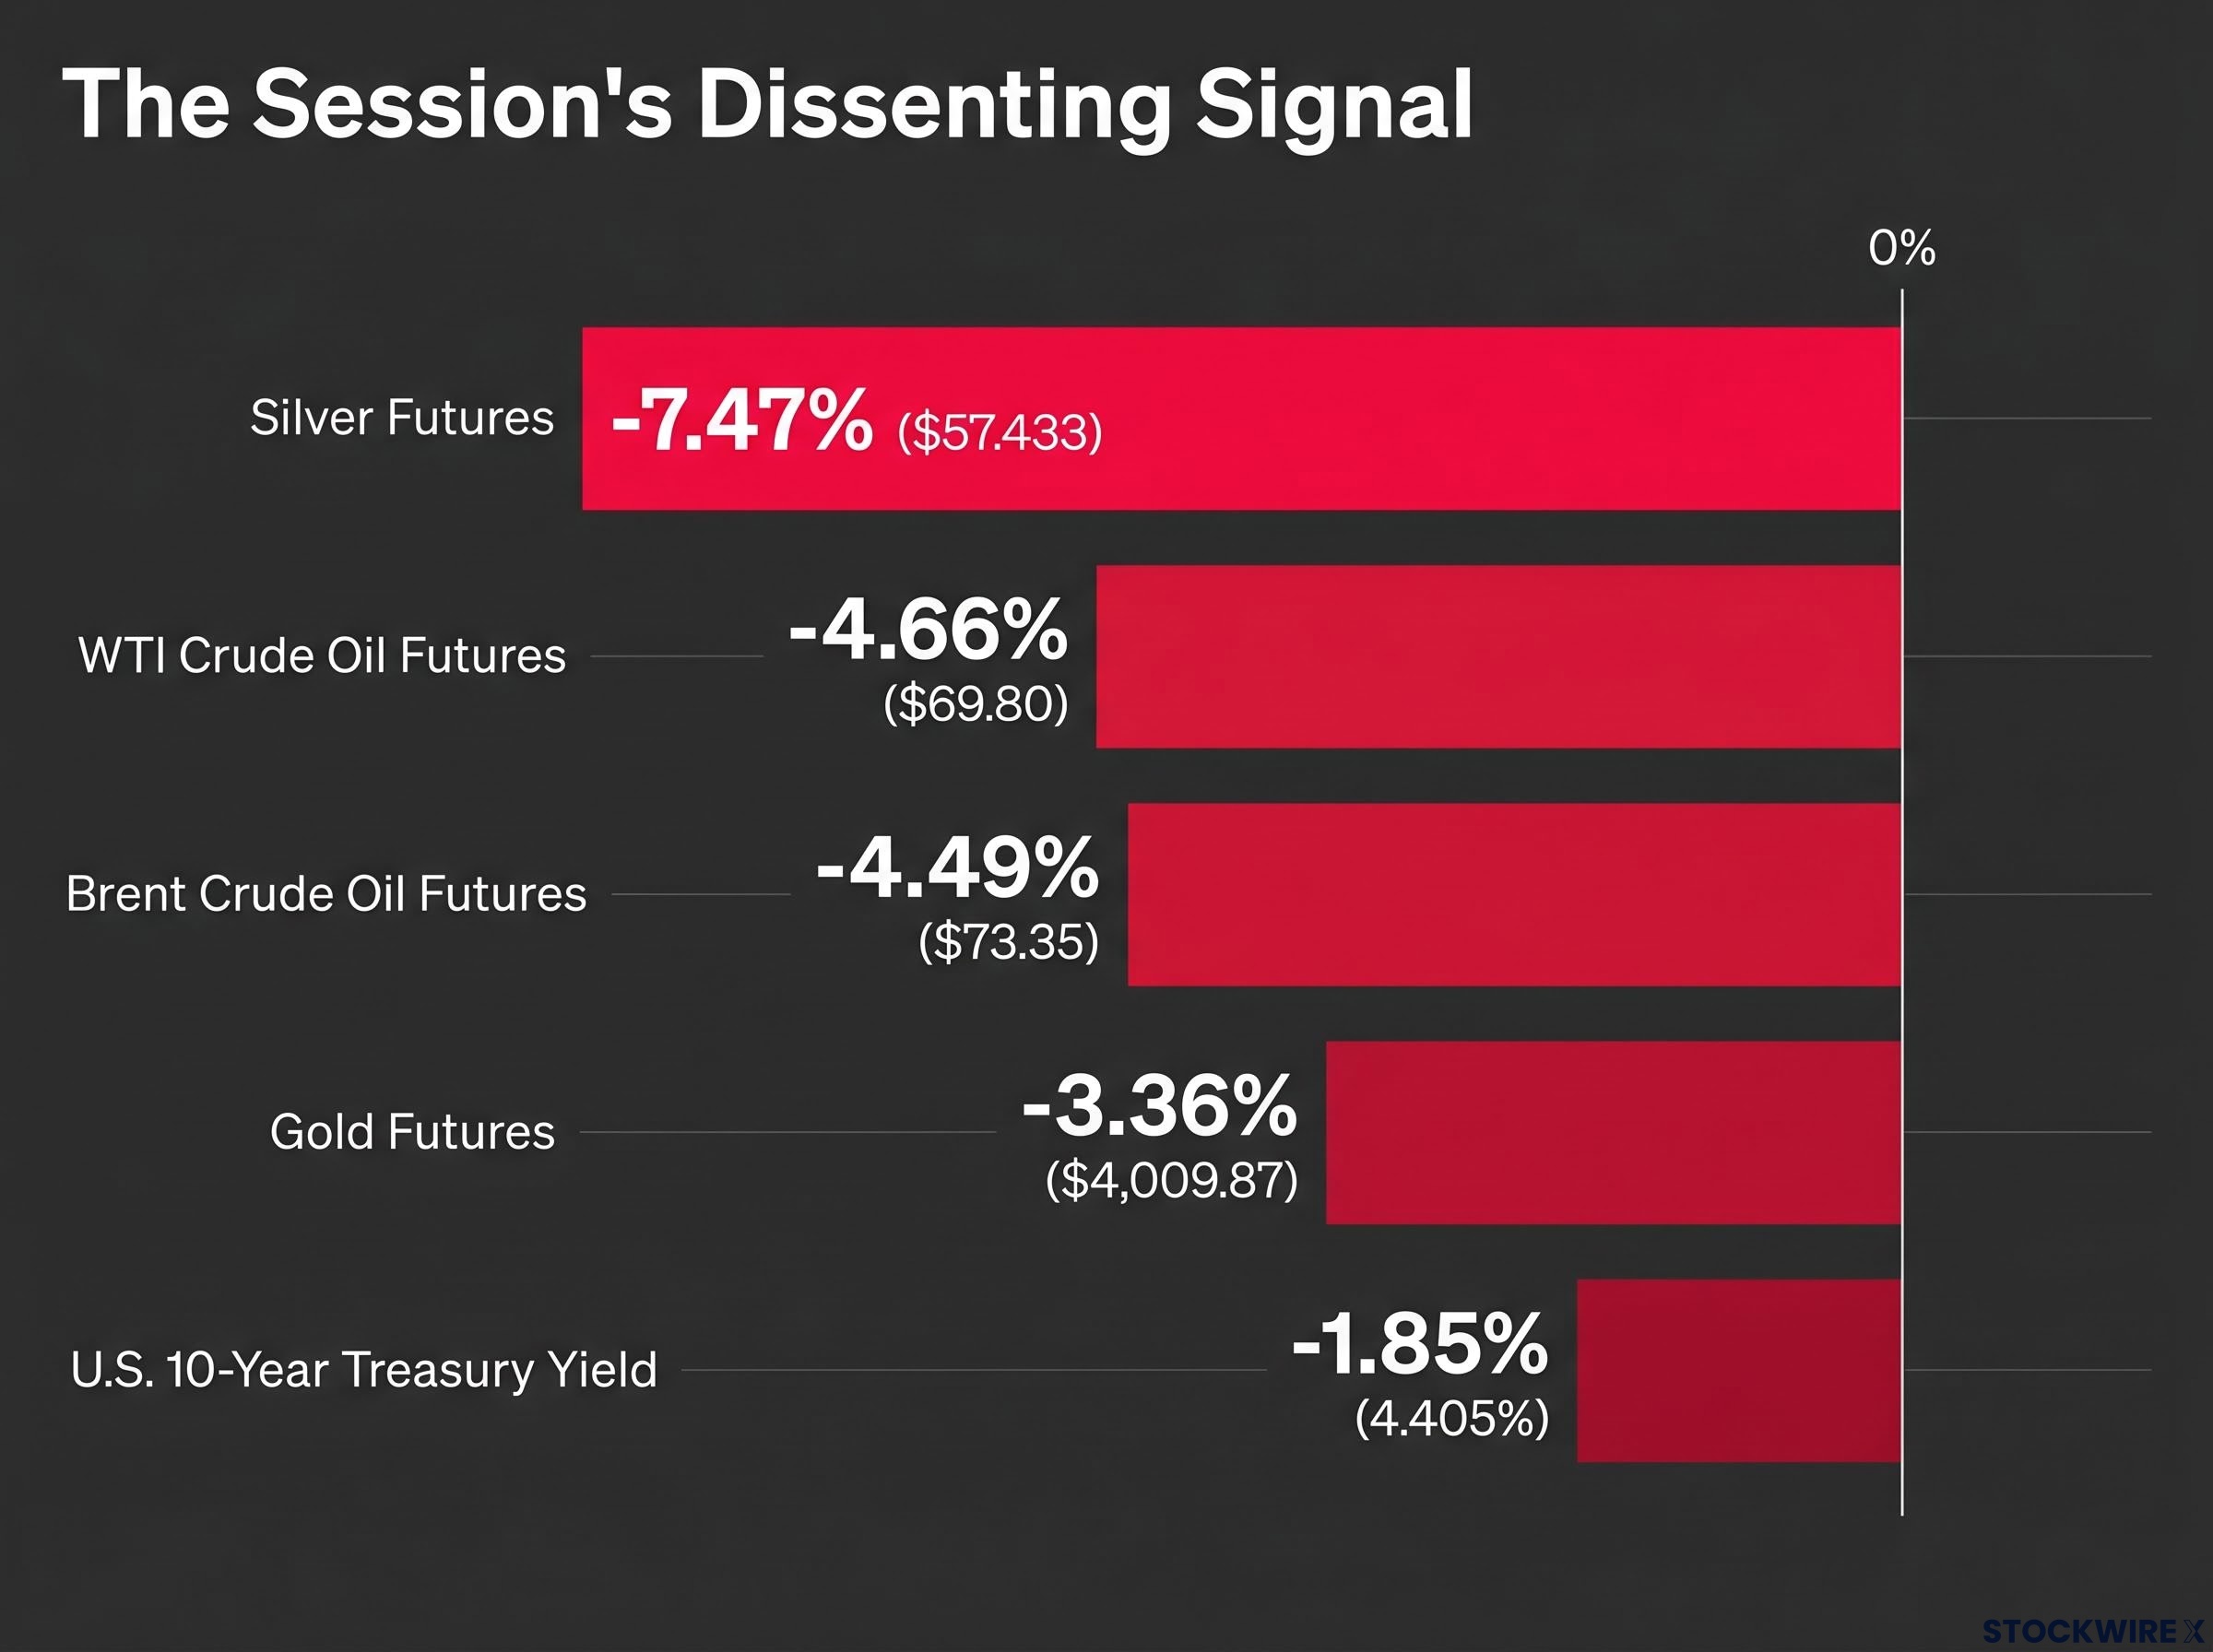
While JPMorgan was raising its equity target, the commodity complex was sending a sharply different message. This was not a minor pullback.
| Asset | Settlement Price | % Change |
|---|---|---|
| Gold Futures | $4,009.87 | −3.36% |
| Silver Futures | $57.433 | −7.47% |
| WTI Crude Oil Futures | $69.80 | −4.66% |
| Brent Crude Oil Futures | $73.35 | −4.49% |
| U.S. 10-Year Treasury Yield | 4.405% | −1.85% (approx.) |
Silver’s 7.47% decline was the sharpest single-asset move of the session. Silver trades as both an industrial metal and a precious metal, which means a selloff of that magnitude carries a dual signal: weakening industrial demand expectations and reduced inflation hedging appetite, simultaneously.
When commodities fall broadly and Treasury yields decline at the same time, the readings range from a flight-to-quality bid to demand concerns to disinflation dynamics. Each of those interpretations carries different implications for equities.
This does not invalidate JPMorgan’s earnings revision thesis. But a session where silver drops 7.5% and Treasury yields fall simultaneously is not background noise. It is a macro signal that deserves a place in any investor’s assessment of whether the bullish earnings-revision environment is durable or whether a demand headwind is forming beneath the surface.
AI infrastructure commodity demand creates a structural tension with the short-term commodity selloff: hyperscalers are projected to spend over $700 billion on physical infrastructure in 2026 alone, embedding multi-year consumption across copper, uranium, and critical minerals, which means a single session’s selloff in gold and silver may be decoupled from the longer structural demand curve that AI capital expenditure is creating.
These statements are speculative and subject to change based on market developments and company performance.
Three developments, three time horizons. Separating them is the practical output of this session’s stock market analysis.
The earnings revision story and the commodity-rates signal are not necessarily contradictory, but they pull in different directions. Which narrative gains confirmation over the coming sessions will shape positioning more than any single day’s index result.
This article is for informational purposes only and should not be considered financial advice. Investors should conduct their own research and consult with financial professionals before making investment decisions.
A split-tape session is when major indices move in opposite directions simultaneously, signalling sector rotation rather than a broad market directional move. On 24 June 2026, the Dow rising 0.36% while the Nasdaq fell 0.43% indicated institutional capital rotating out of high-multiple technology names into blue-chip industrials and financials, not a wholesale exit from equities.
JPMorgan raised its S&P 500 target to 7,800, citing an earnings revision environment it described as having no historical precedent, implying approximately 6% upside from the 24 June close of 7,359.11. The call was supported by Micron Technology reporting record profitability driven by AI memory demand, providing concrete evidence that AI infrastructure spending is converting to earnings rather than just multiple expansion.
Every fund and ETF tracking the Dow must buy Alphabet and sell Verizon on the effective rebalancing date, creating predictable buying pressure on Alphabet shares and supply pressure on Verizon. Because the Dow is price-weighted and Alphabet has been trading in the $340-$350 range, it would immediately rank among the top-tier price contributors in the index, meaningfully shifting the Dow's exposure toward AI and technology.
Silver's 7.47% single-session decline, gold's 3.36% drop, and crude oil falling over 4% alongside falling Treasury yields point toward demand concerns, disinflation dynamics, or a flight-to-quality bid, each of which carries different implications for the bullish earnings thesis. The selloff does not invalidate JPMorgan's earnings revision call, but its persistence across subsequent sessions would indicate a demand headwind forming beneath the surface.
A price-weighted index like the Dow Jones Industrial Average gives more influence to stocks with higher share prices regardless of company size, meaning a stock at $400 exerts roughly eight times the pull of one at $50. A market-cap-weighted index like the S&P 500 weights each company by its total market value, so the largest companies dominate, which is why the same session on 24 June produced three different index results across the Dow, S&P 500, and Nasdaq.