Two Index Changes on 29 June, Two Very Different Flow Stories
9 hrs ago
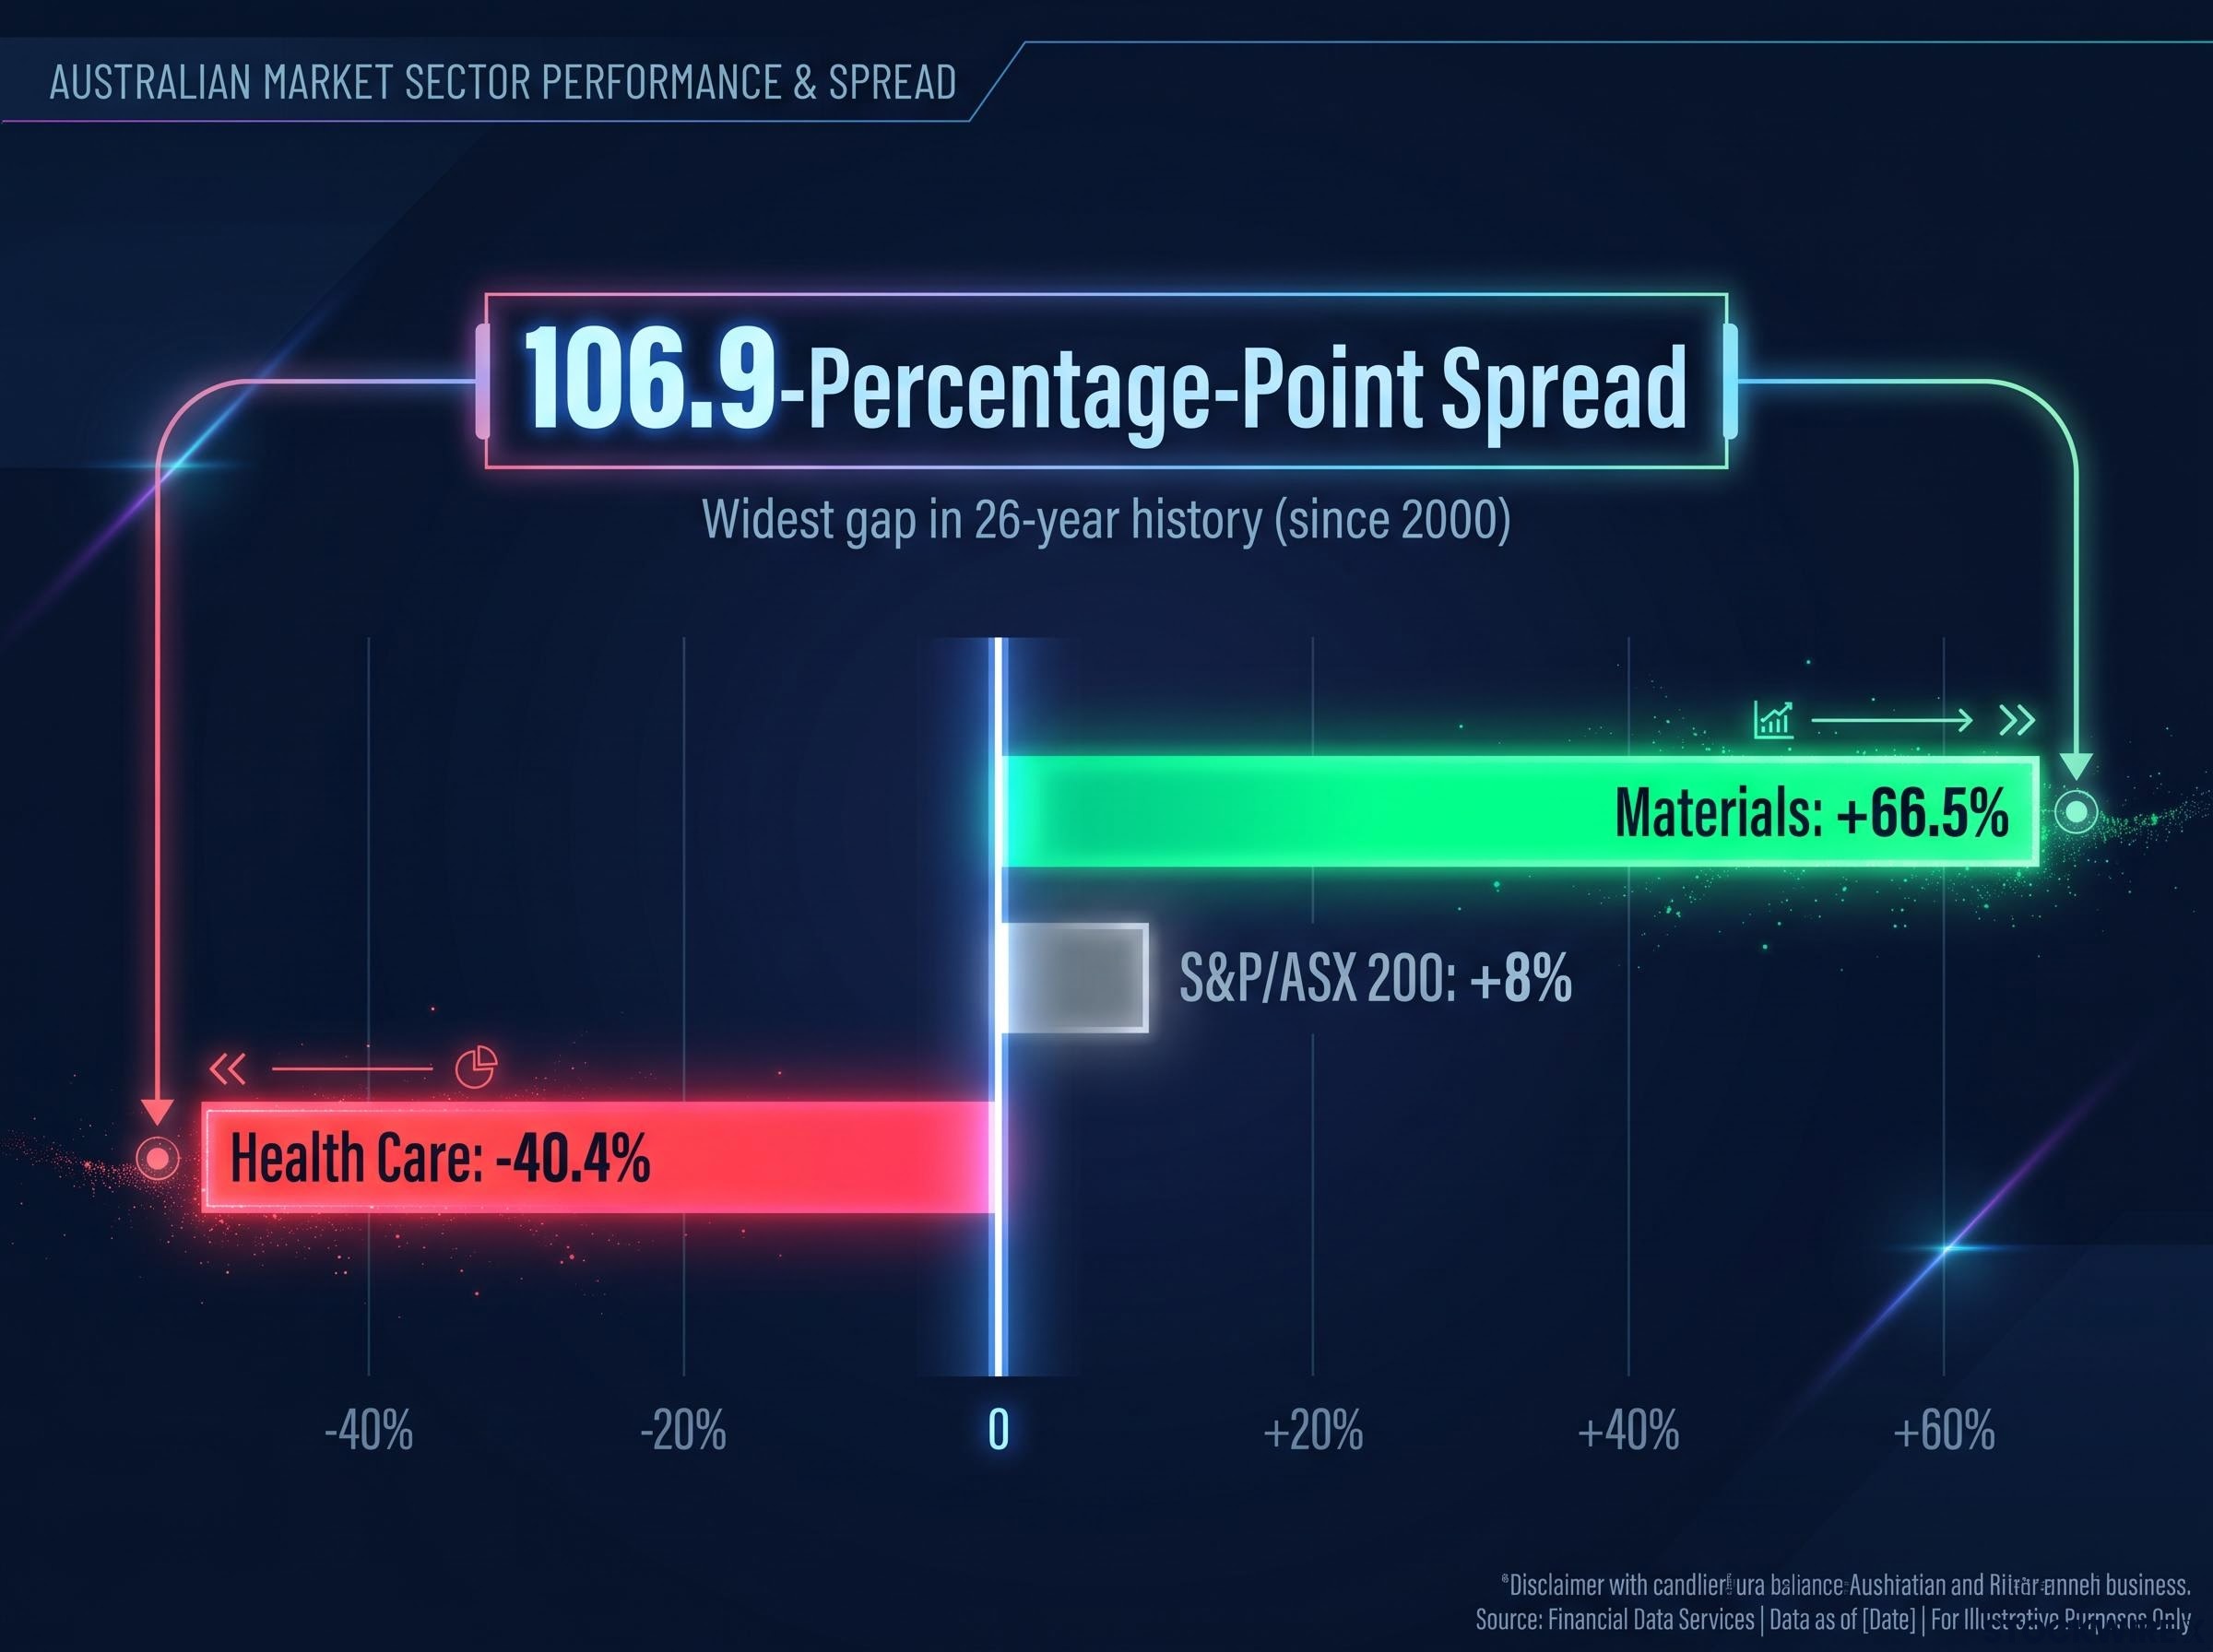
The S&P/ASX 200 returned approximately 8% in FY2026. On its own, that number barely warrants a headline. Underneath it sat a market more fractured than at any other point across the index’s 26-year lifespan: a 106.9-percentage-point chasm separating the top and bottom sectors, a reading that has not been surpassed since the XJO’s inception.
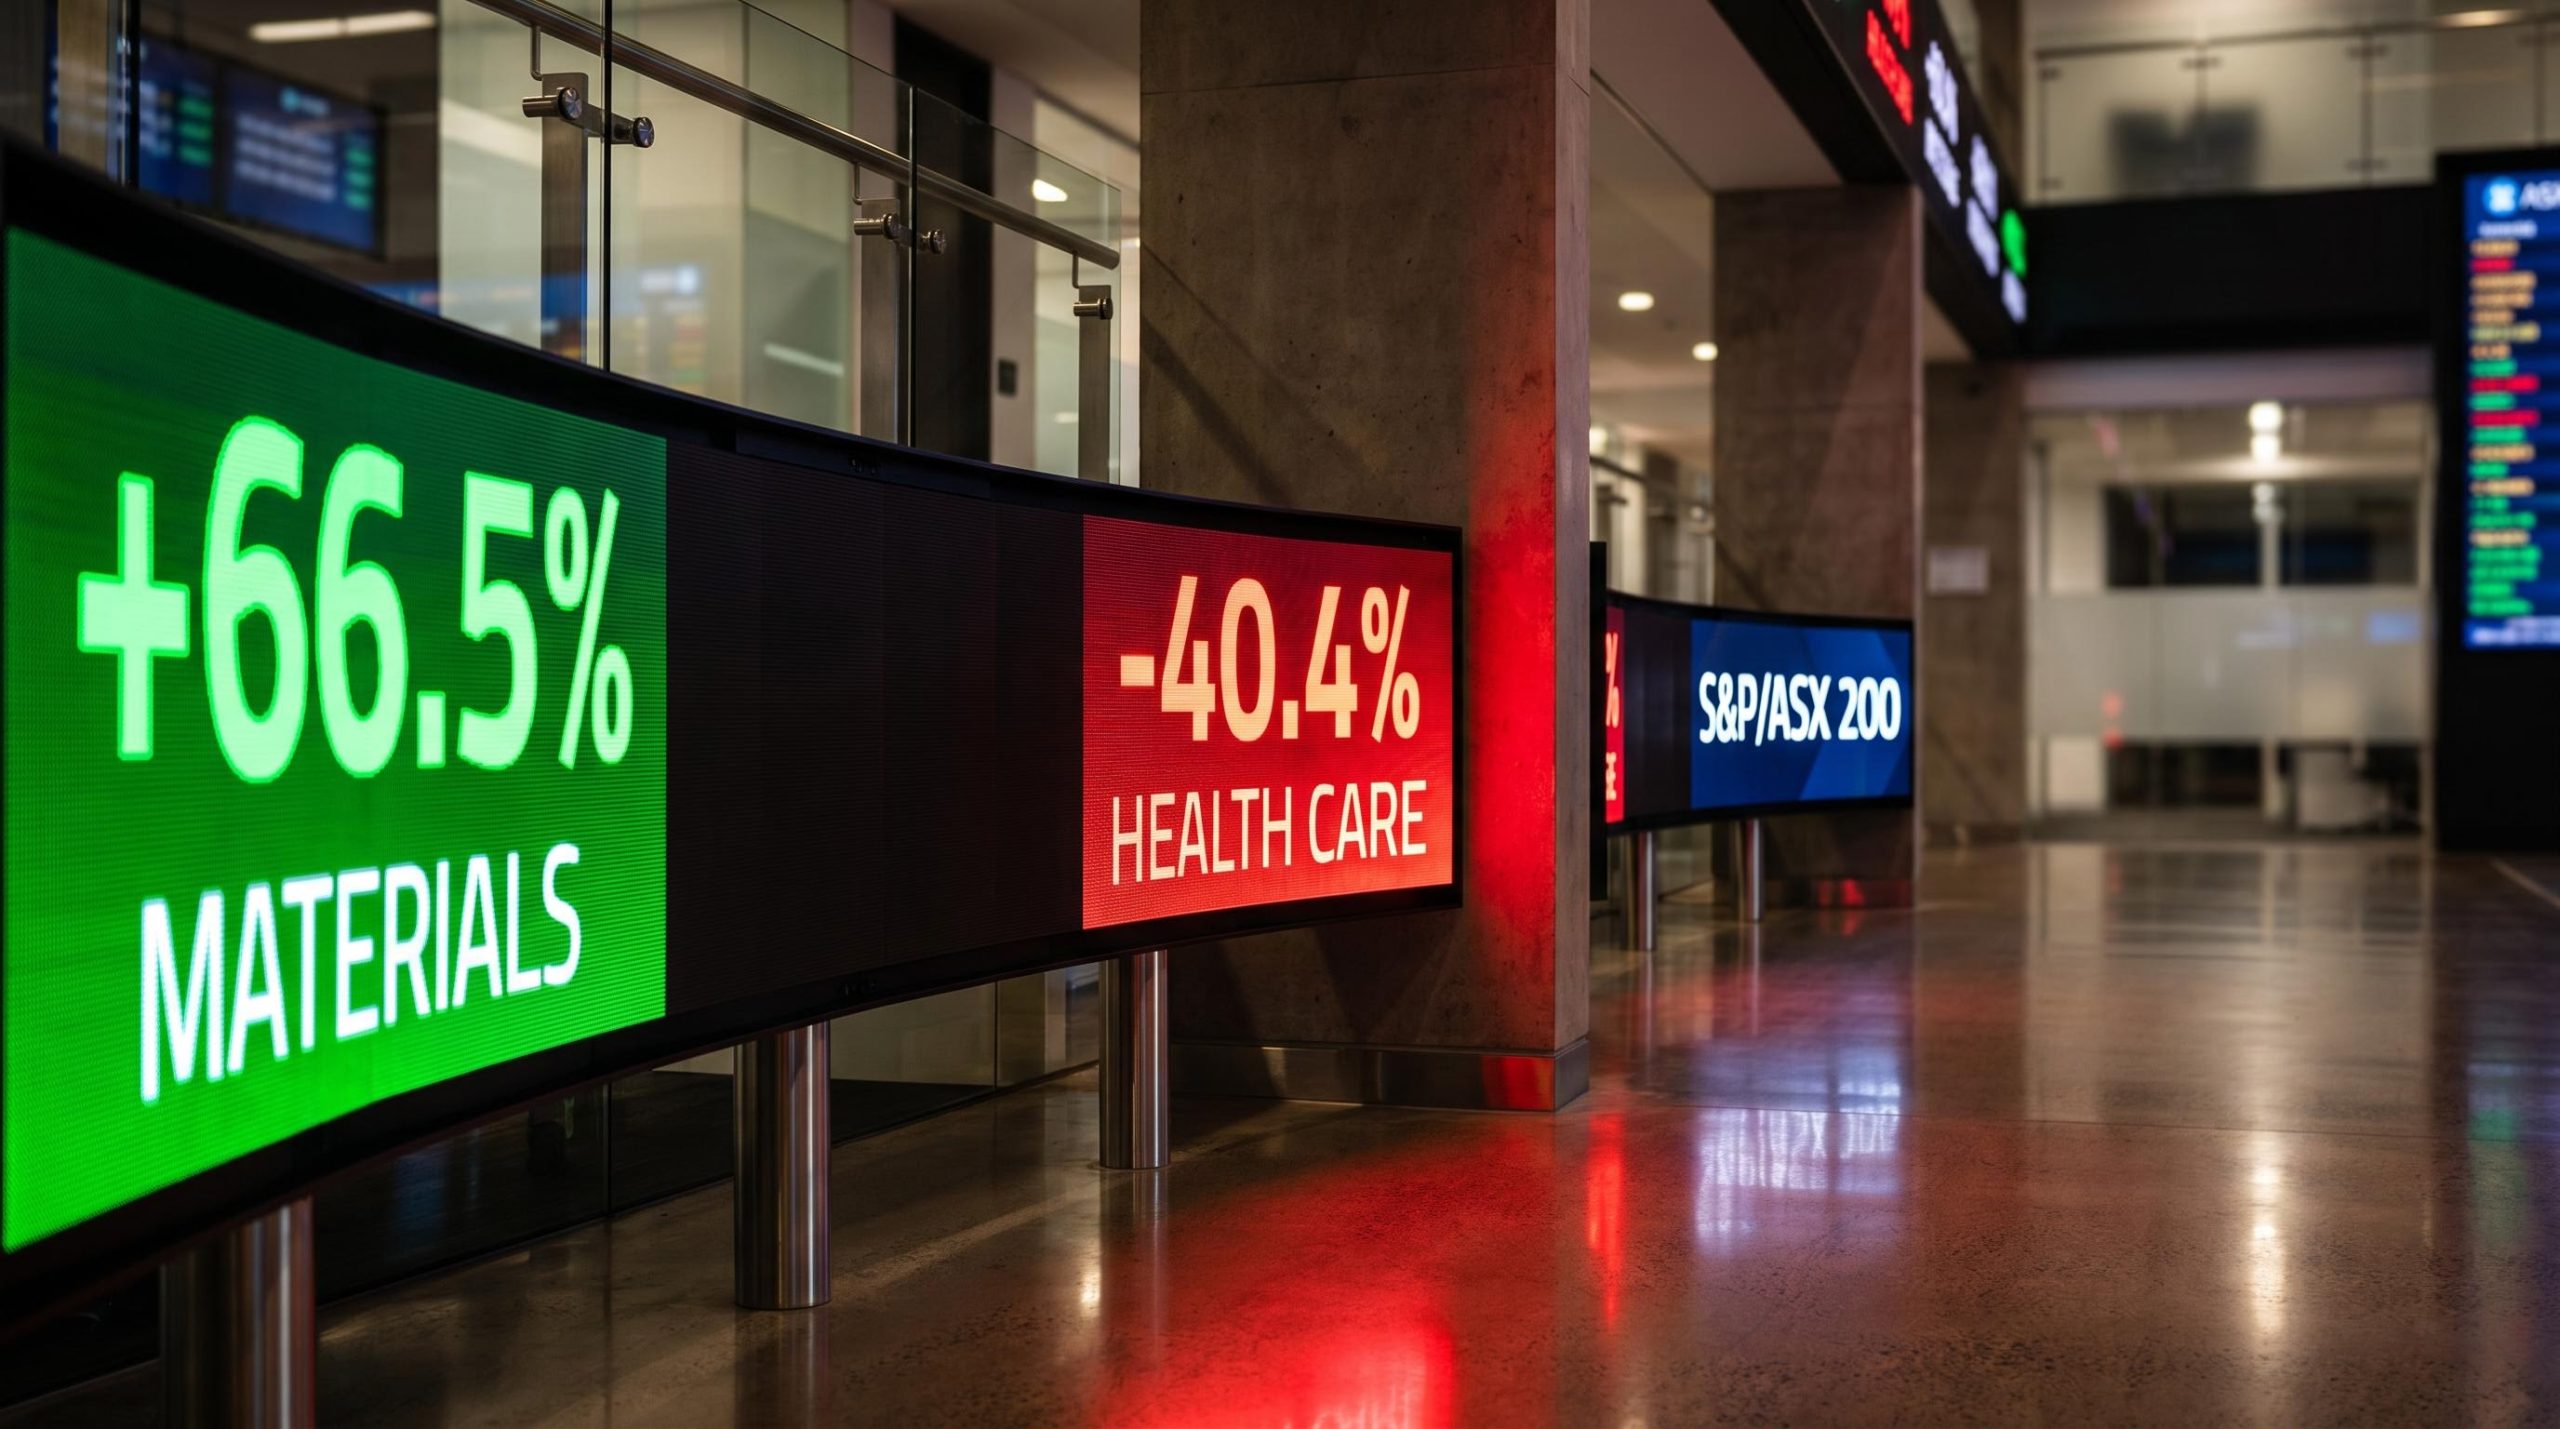
That gap matters for anyone with superannuation, a share portfolio, or money in a managed fund. The Materials sector returned approximately +66.5%. Health Care returned approximately -40.4%. Nearly 44% of ASX 300 companies lost money over the year while the headline index drifted higher. The index number was not representative of what most investors actually experienced.
What follows breaks down how this record divergence happened, what it reveals about the limits of standard diversification, and what three disciplines separated investors who navigated FY2026 well from those who did not. This is not a historical post-mortem. It is a practical framework you can apply before FY2027 begins.
Start with the headline. The S&P/ASX 200 delivered a total return of approximately 8% for FY2026, a figure that, in most years, would signal a steady, unremarkable twelve months. This was not most years.
Materials returned approximately +66.5%, driven by a commodity cycle that rewarded exposure to hard assets. Health Care returned approximately -40.4%, punishing investors in the sector with the sharpest drawdown on the index. At 106.9 percentage points, the spread between those two figures set a record for the full dataset going back to the S&P/ASX 200’s launch in 2000, based on Norgate Data analysis by Carl Capolingua.
Record sector spread: The 106.9-percentage-point gulf between Materials and Health Care stands as the broadest sector performance range across all 26 years of ASX data, exceeding every comparable 12-month window on record, including those covering the dot-com crash, the GFC, COVID-19, and the Russia-Ukraine shock.
Among the approximately 300 stocks in the ASX 300, 131 finished FY2026 in negative territory on a total return basis, accounting for roughly 43.7% of the index. Drops of 60%, 70%, and even 80% were far from rare at the bottom of the performance table, despite the headline index finishing higher on the year.
Your personal result almost certainly diverged from that 8% figure. Whether it was better or worse depended entirely on how your portfolio was positioned across sectors.
Sector divergence beneath flat index returns is a recurring pattern, not a one-off anomaly: in Week 26 of 2026, the ASX 200 posted a 0.28% weekly gain while utilities, healthcare, and consumer staples pressed fresh 52-week highs and energy stocks simultaneously fell to 52-week lows, a split that mirrors the same structural fracture this article documents at the annual level.
| Sector | FY2026 Total Return (approx.) |
|---|---|
| Materials | +66.5% |
| S&P/ASX 200 (index) | +8% |
| Financials (mid-range) | Near index |
| Health Care | -40.4% |
The scale of FY2026’s divergence is the story, but the mechanism behind it determines whether the pattern persists, reverses, or intensifies. Understanding what drove each extreme matters directly for how you position heading into FY2027.
The Materials surge rode a commodity cycle that rewarded hard-asset exposure as demand conditions tightened. Once the momentum was visible, algorithmically driven sector rotation amplified it. Capital flowed into what was already winning, compressing the timeline of the outperformance and accelerating the gap beyond what fundamentals alone would have produced.
The June 2026 ASX sector rotation that shifted institutional capital from domestic bank dividends into globally exposed technology and base metals names illustrates the mechanism precisely: the S&P/ASX 200 closed nearly flat on 2 June 2026 while 184 stocks declined against 99 advancing, a breadth reading that captures the internal fracture the headline figure conceals.
Within the full 26-year dataset ranked by standard deviation of sector returns on a rolling 12-month basis, the first two quarters of FY2026 placed 4th and 5th respectively among the most internally volatile periods on record. This was not a slow drift apart. It was a fast, algorithmically accelerated rotation that passive investors had little time to respond to.
Historically, extreme sector divergences of this magnitude have only appeared alongside major market disruptions:
FY2026 now sits in that company. Looking at rolling 12-month sector performance ranges, the March 2026 quarter claimed 10th position in the all-time dispersion rankings.
Health Care’s -40.4% result was not simply a case of capital rotating elsewhere. The sector experienced company-level earnings deterioration across several major constituents, compounding the damage from sentiment-driven selling. When fundamental problems and momentum-driven capital flight hit simultaneously, the drawdown accelerated beyond what either force would have produced alone.
The distinction matters for FY2027 positioning. A sector that fell because capital temporarily rotated away may rebound quickly. A sector where earnings deteriorated needs evidence of fundamental repair before the valuation discount becomes an opportunity rather than a signal of continuing problems.
Diversification did its core job. It did not do what most investors assume it does.
A broadly diversified ASX portfolio likely landed near the index return of approximately 8%. No catastrophic single-sector exposure. No ruin. The foundational promise of spreading risk across sectors held. That is the good news.
Part of what made FY2026’s divergence so damaging for passive domestic portfolios is a structural problem predating it: ASX index concentration in Financials and Materials leaves the index with almost no exposure to the technology, healthcare, and consumer sectors that dominate global benchmarks, so sector-level shocks land on a narrower base than most investors assume.
The bad news is what diversification required of investors emotionally. Consider the dollar example:
$10,000 allocated to Materials at the start of FY2026 grew to approximately $16,650. $10,000 allocated to Health Care fell to approximately $5,960. The combined result: approximately $22,600, a mathematically acceptable outcome, but one that required watching nearly half of one leg’s value disappear while trusting the overall portfolio to deliver.
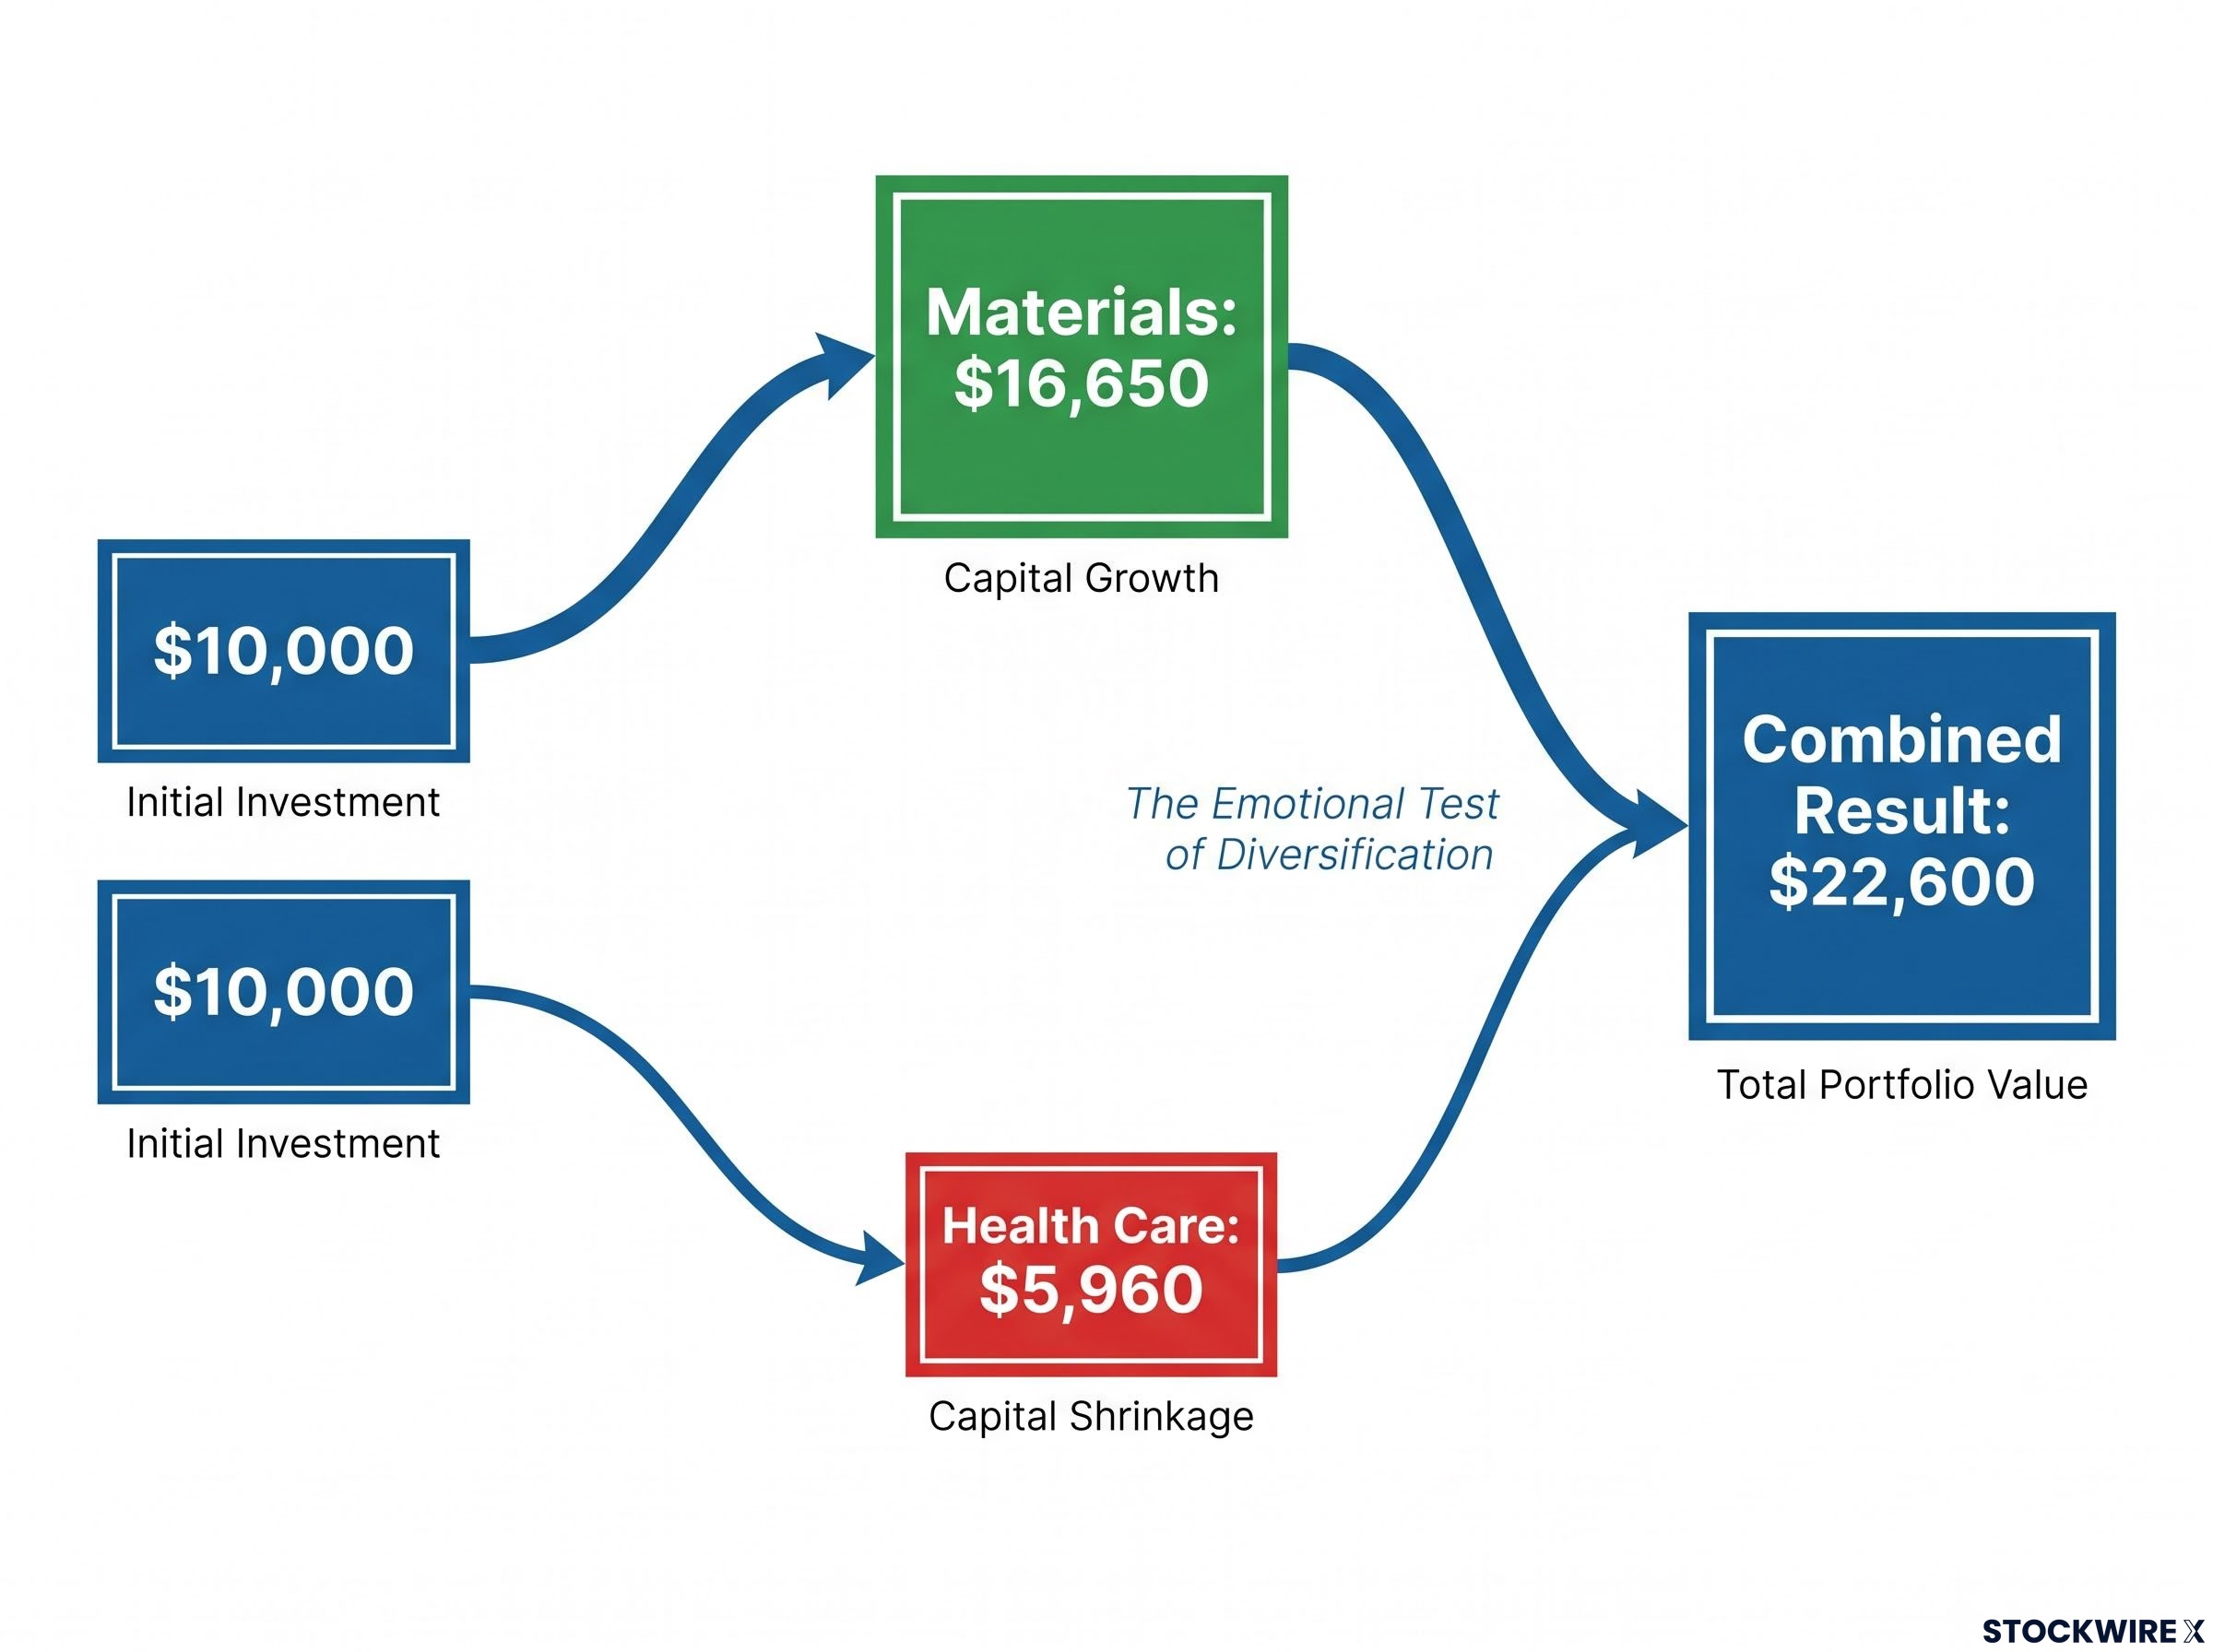
A passive buy-and-hold approach meant retaining large losing positions while other holdings generated strong gains. That is a behavioural challenge most investors underestimate when markets are calm.
FY2026 exposed a distinction that every Australian investor needs to understand:
The emotional tolerance required to hold through that experience, without panic-selling the losers or chasing the winners, is the gap between theory and practice.
Passive investing rests on a core assumption from modern portfolio theory (MPT), the idea that combining assets with different return profiles smooths your overall outcome. Gains in one area offset losses in another. Over time, the net result is a more stable return than any individual holding would deliver.
That assumption was built for a world where sector rotation is gradual, where shifts play out over quarters or years, giving investors time to review, rebalance, and adjust. FY2026 did not operate in that world.
The S&P/ASX index methodology governs how constituent stocks are weighted on a float-adjusted market capitalisation basis and sets the rebalancing schedule that determines when sector exposures are formally reset, a process that operates on a quarterly cycle and sits well behind the pace at which algorithmically driven rotations moved during FY2026.
Before going further, four terms are worth defining clearly:
Algorithmic and momentum-driven trading strategies operate on a simple principle: capital is deployed into sectors that are gaining and withdrawn from those that are falling, with both actions executed far more rapidly than any human process permits. When a sector begins outperforming, algorithmic capital flows into it, accelerating the move. When a sector begins underperforming, the same systems exit, deepening the drawdown.
The result is sector rotation that moves faster and more extremely than underlying economic conditions alone would produce. In FY2026, this dynamic meant the divergence between Materials and Health Care widened at a pace that outstripped the quarterly review cycles most passive investors rely on. By the time a passive investor’s next statement arrived, the rotation had already moved materially.
These three practices are not replacements for diversification. They sit on top of it. Each addresses a specific risk that FY2026 exposed, and each comes with a rule of thumb you can apply this week.
| Discipline | Rule of Thumb | FY2026 Risk Addressed |
|---|---|---|
| Sector momentum monitoring | Review at each quarterly statement | Algorithmically accelerated rotation outpacing passive review cycles |
| Position sizing | Cap single stocks at 3-5% of portfolio | Individual stock declines of 60-80% |
| Active rebalancing | Rebalance at 5-percentage-point deviation | Winners becoming overweights; losers compounding unchecked |
These are not expert-level tactics. They are minimum-maintenance practices any Australian investor can implement with a spreadsheet and a quarterly calendar reminder.
For investors ready to put the 5-percentage-point deviation rule into practice, our comprehensive walkthrough of portfolio rebalancing for Australian investors covers the full execution sequence, including how to use super and SMSF structures to rebalance at the concessional 15% tax rate, which asset classes have emerged as credible destinations for trimmed equity positions in the current rate environment, and how to combine calendar-based reviews with a drift-threshold trigger.
If you can answer these three questions with specific, evidence-based responses, you are materially better positioned for FY2027 than an investor who relies on a vague sense that their portfolio is “diversified enough.”
Extreme divergences have historically unwound eventually, but when and how they do so is rarely predictable in advance. Position for sustained elevated dispersion in FY2027 rather than banking on conditions normalising quickly.
FY2026 does not discredit diversification. It retires the idea that diversification alone is sufficient.
The 106.9-point record spread is not simply a statistical outlier to note and move on from. It signals the kind of environment that algorithm-driven capital flows can generate repeatedly, with money rotating between sectors at a speed and intensity that sits well beyond the pace most passive strategies were originally calibrated to handle. Those algorithmic dynamics are embedded in the structure of modern markets, not passing distortions that will self-correct.
What “being diversified” needs to mean for Australian investors has shifted. Diversification remains the foundation, but it now requires three complementary layers to function as intended: momentum awareness, position discipline, and active rebalancing. Without those layers, diversification is a partial answer in markets capable of producing 106.9-point spreads.
Diversification retains its value as a risk management foundation, but used in isolation it falls short as a complete tool in markets capable of the extremes FY2026 produced.
The shift this analysis asks of you is conceptual: from thinking of diversification as a destination (“I am diversified”) to thinking of it as a foundation that requires active maintenance. Australian investors who make that update are better equipped to build portfolios that survive not just the next normal year, but the next extreme one.
This article is for informational purposes only and should not be considered financial advice. Investors should conduct their own research and consult with financial professionals before making investment decisions. Past performance does not guarantee future results.
The gap between the best and worst performing ASX sectors in FY2026 reached 106.9 percentage points, the widest in the S&P/ASX 200's 26-year history, with Materials returning approximately +66.5% and Health Care returning approximately -40.4%.
Health Care's -40.4% result was driven by a combination of company-level earnings deterioration across major constituents and momentum-driven selling, meaning the sector did not simply suffer from capital rotating elsewhere but faced genuine fundamental damage that requires repair before the valuation discount becomes an opportunity.
Algorithmic strategies deploy capital into outperforming sectors and exit underperforming ones far faster than any human process, accelerating rotations well beyond what underlying economic conditions alone would produce and outpacing the quarterly review cycles most passive investors rely on.
The three practices are monitoring sector momentum at each quarterly statement, capping individual stock exposure at approximately 3-5% of total portfolio value, and rebalancing whenever any sector drifts more than 5 percentage points from its target weight.
Diversification still protected investors from catastrophic single-sector loss, but FY2026 demonstrated it must be paired with three active layers: momentum awareness, position sizing discipline, and trigger-based rebalancing, to function as intended in markets capable of 106.9-point sector spreads.