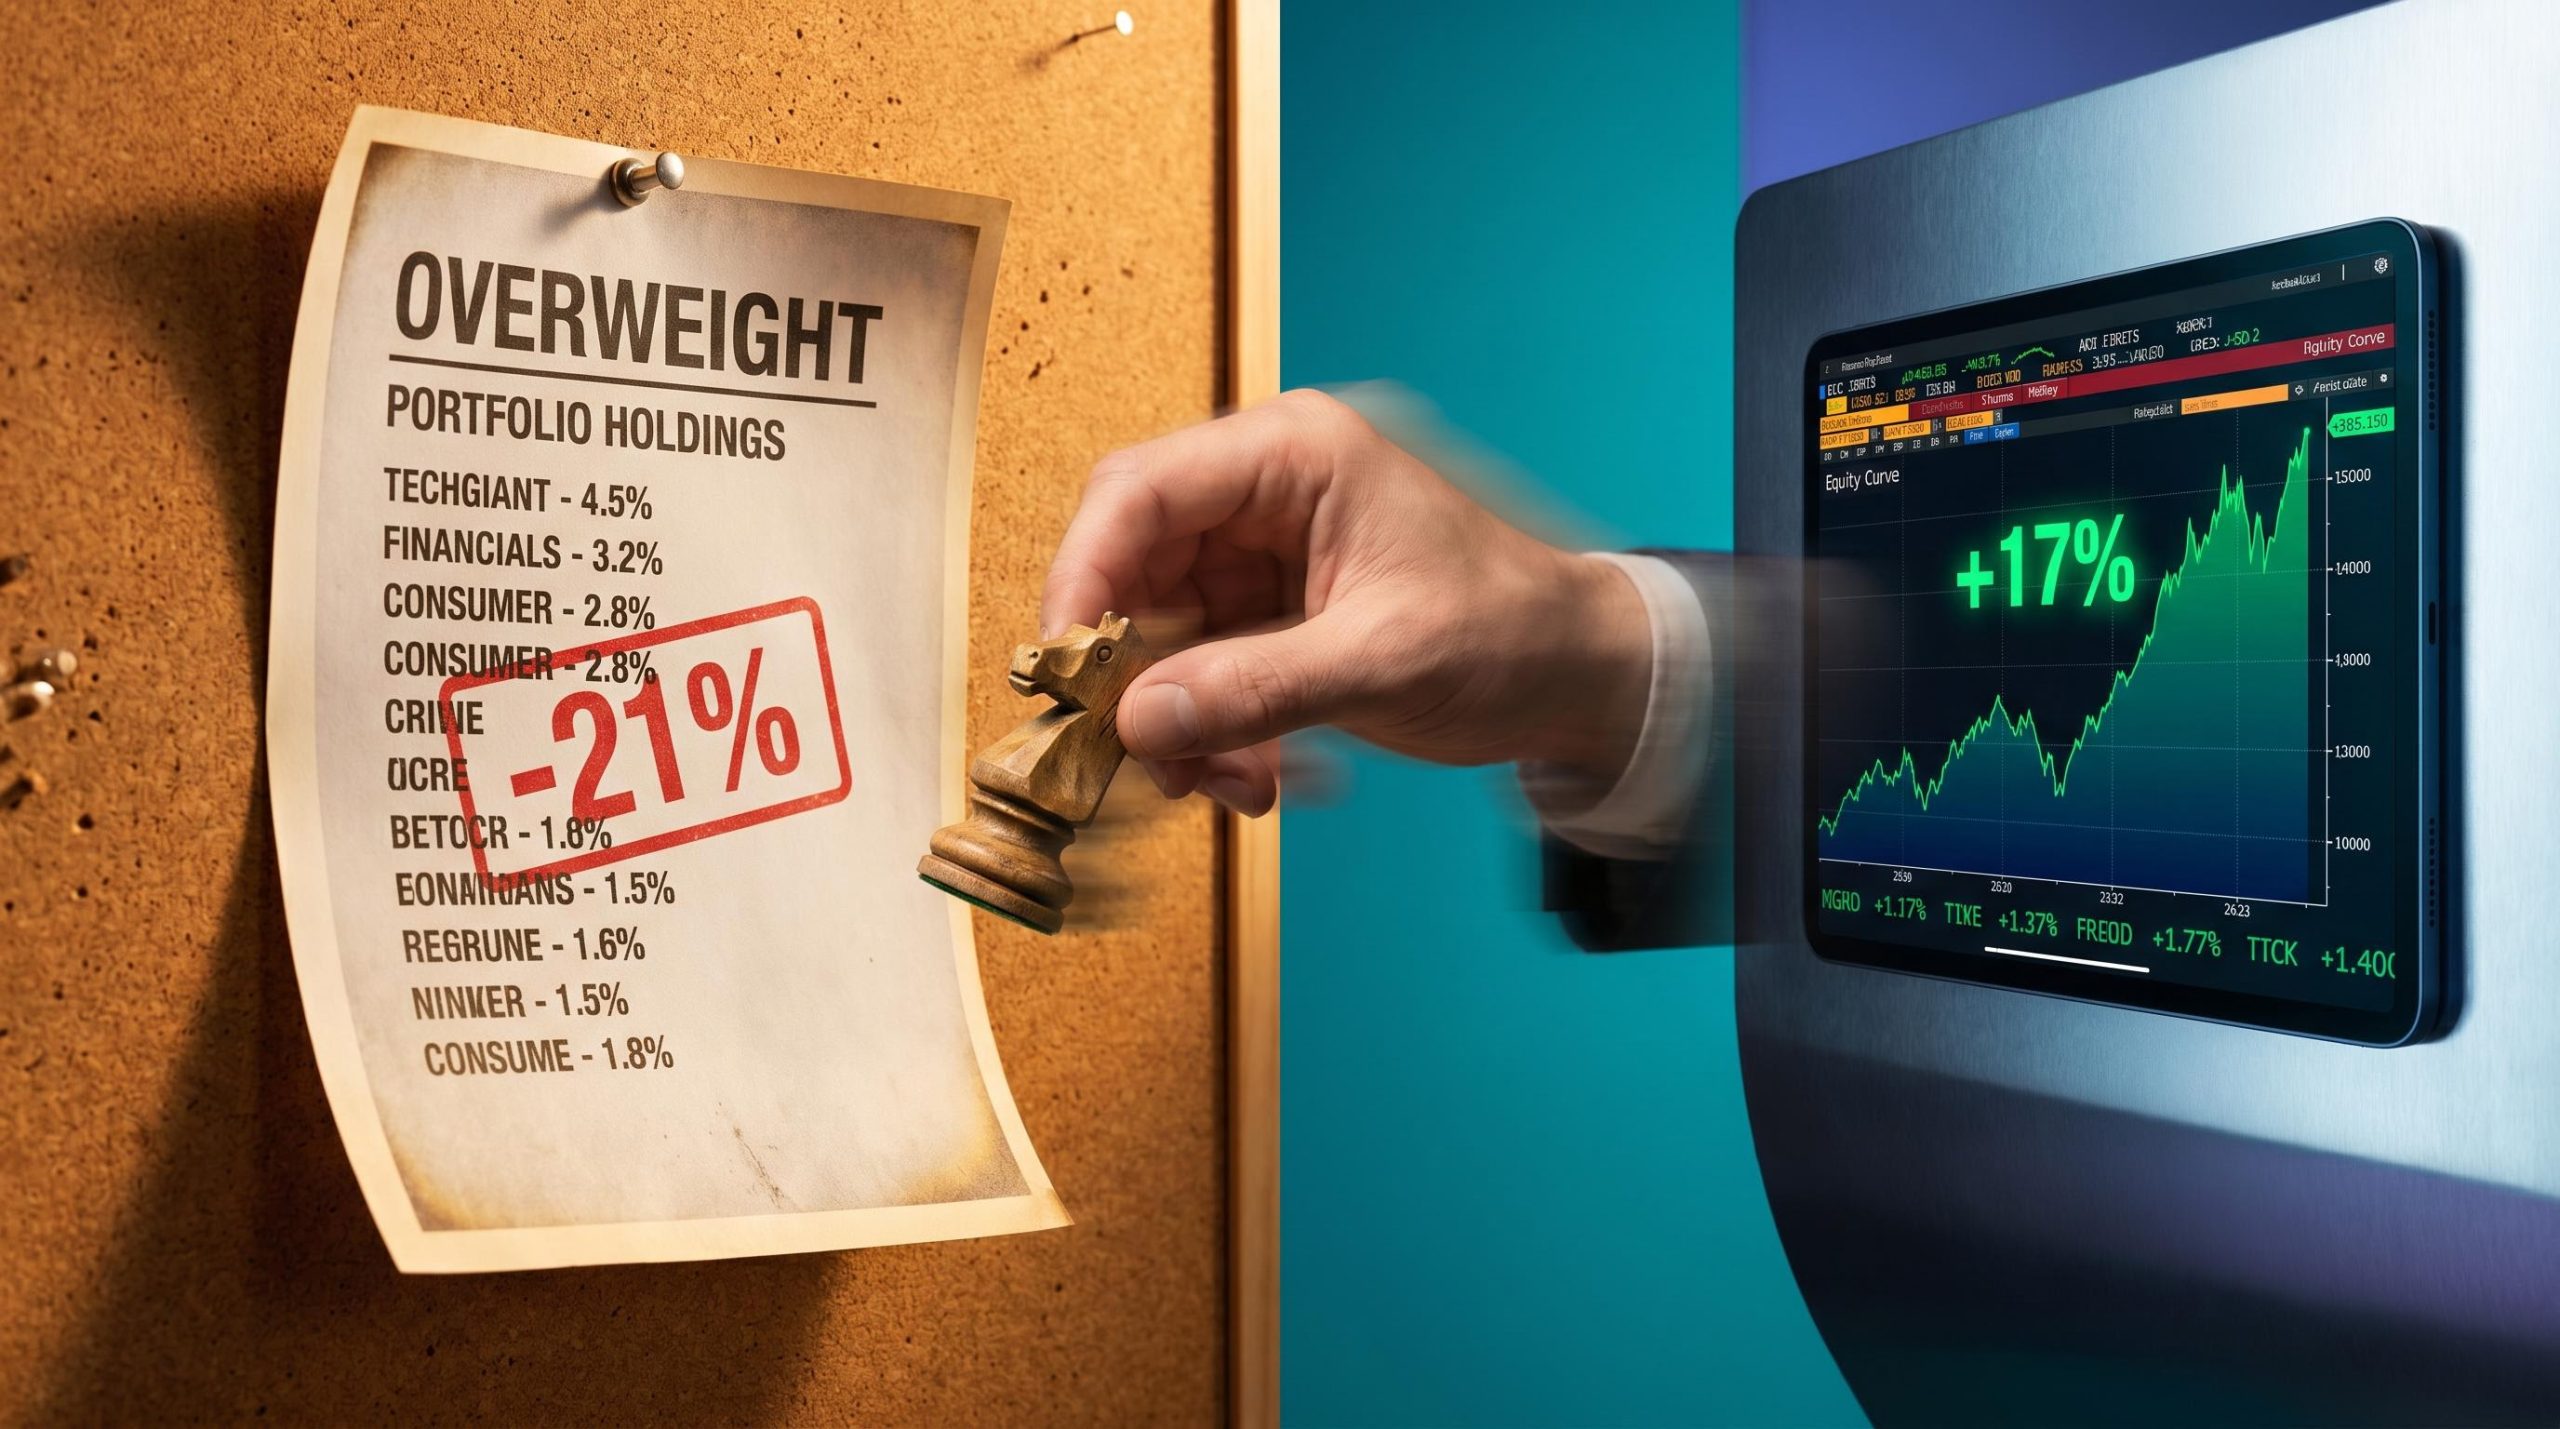
Two portfolios. Same underlying fund manager data. One down roughly 21%, the other up roughly 17%. The gap between them, approximately 38 percentage points, did not come from better information, better timing, or better access. It came from a different question asked of the same numbers.
Morgan Stanley tracked 62 Australian active equity funds from January 2025 through to a research note published on 22 June 2026, and the findings land squarely on a habit most retail investors share: copying what professional fund managers hold. That instinct, the study suggests, produced one of the worst possible outcomes available from the same dataset. The strategy that worked was not about what managers owned. It was about what they were doing right now. What follows shows you exactly what separates a fund manager’s holdings from their trades, why that distinction matters far more than it sounds, and what you should actually do with publicly available positioning data the next time you encounter it.
A tale of two portfolios built from the same data
The numbers deserve to sit on their own for a moment.
Static holdings basket (copying current overweights): approximately -21% Trade-following basket (tracking monthly position changes): approximately +17%
That is a gap of roughly 38 percentage points from two strategies built on the same raw information, the monthly fact sheets of the same 62 funds, measured against the same benchmarks (ASX 200, ASX 300, and All Ordinaries).
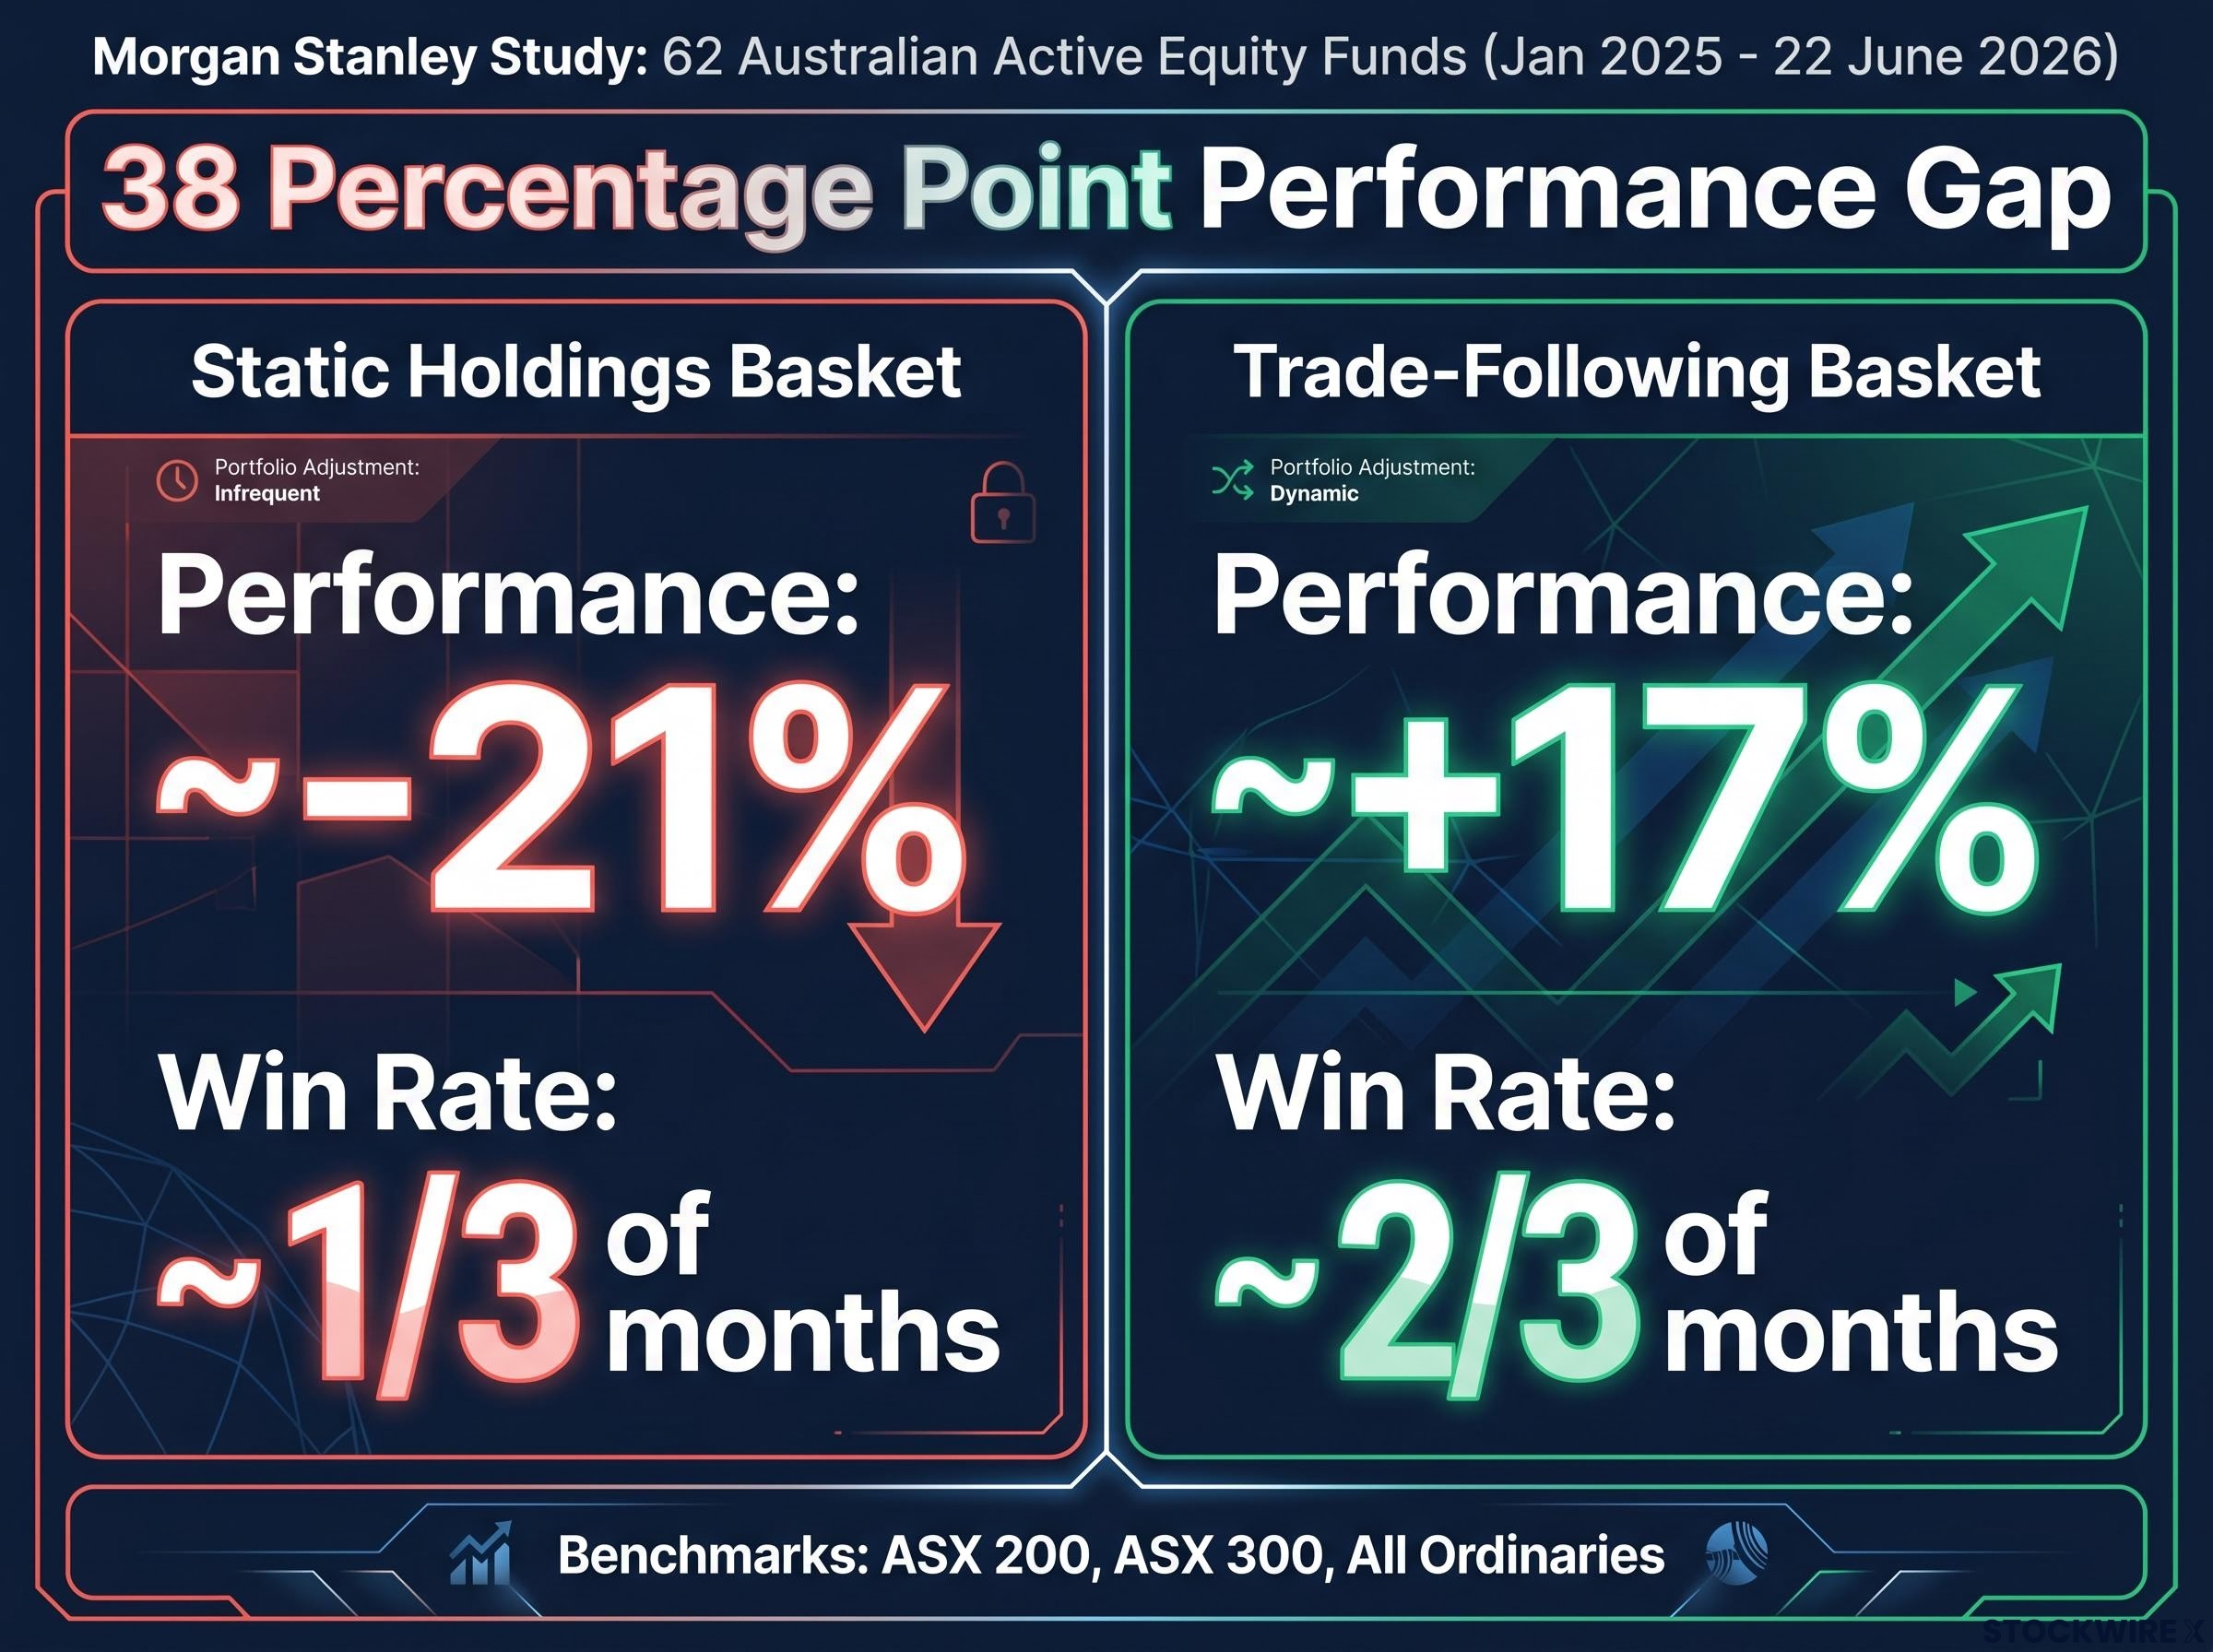
The trade-following approach outperformed in roughly two-thirds of the months measured, suggesting consistency rather than a single lucky stretch.
| Strategy | Construction method | Performance | Win rate |
|---|---|---|---|
| Static holdings basket | Replicate top overweight positions | Approximately -21% | Roughly one-third of months |
| Trade-following basket | Long largest monthly increases, short largest monthly reductions | Approximately +17% | Roughly two-thirds of months |
Neither strategy had an information advantage over the other. The difference was entirely about whether you treated the data as a level (what they own) or a direction (what they are changing). That distinction is at the core of everything that follows.
When big ASX news breaks, our subscribers know first
How collective positioning turned into a costly consensus
Before the mechanism, the positioning itself. The 62-fund cohort, in aggregate, shared a clear tilt:
- Overweight defensive sectors and stocks
- Notably underweight Australian banks
- Underweight parts of large-cap cyclicals
Then the market did the opposite. A bank-led, large-cap rally dominated the period from January 2025 through mid-2026. The very sectors the cohort had avoided were the sectors that drove returns.
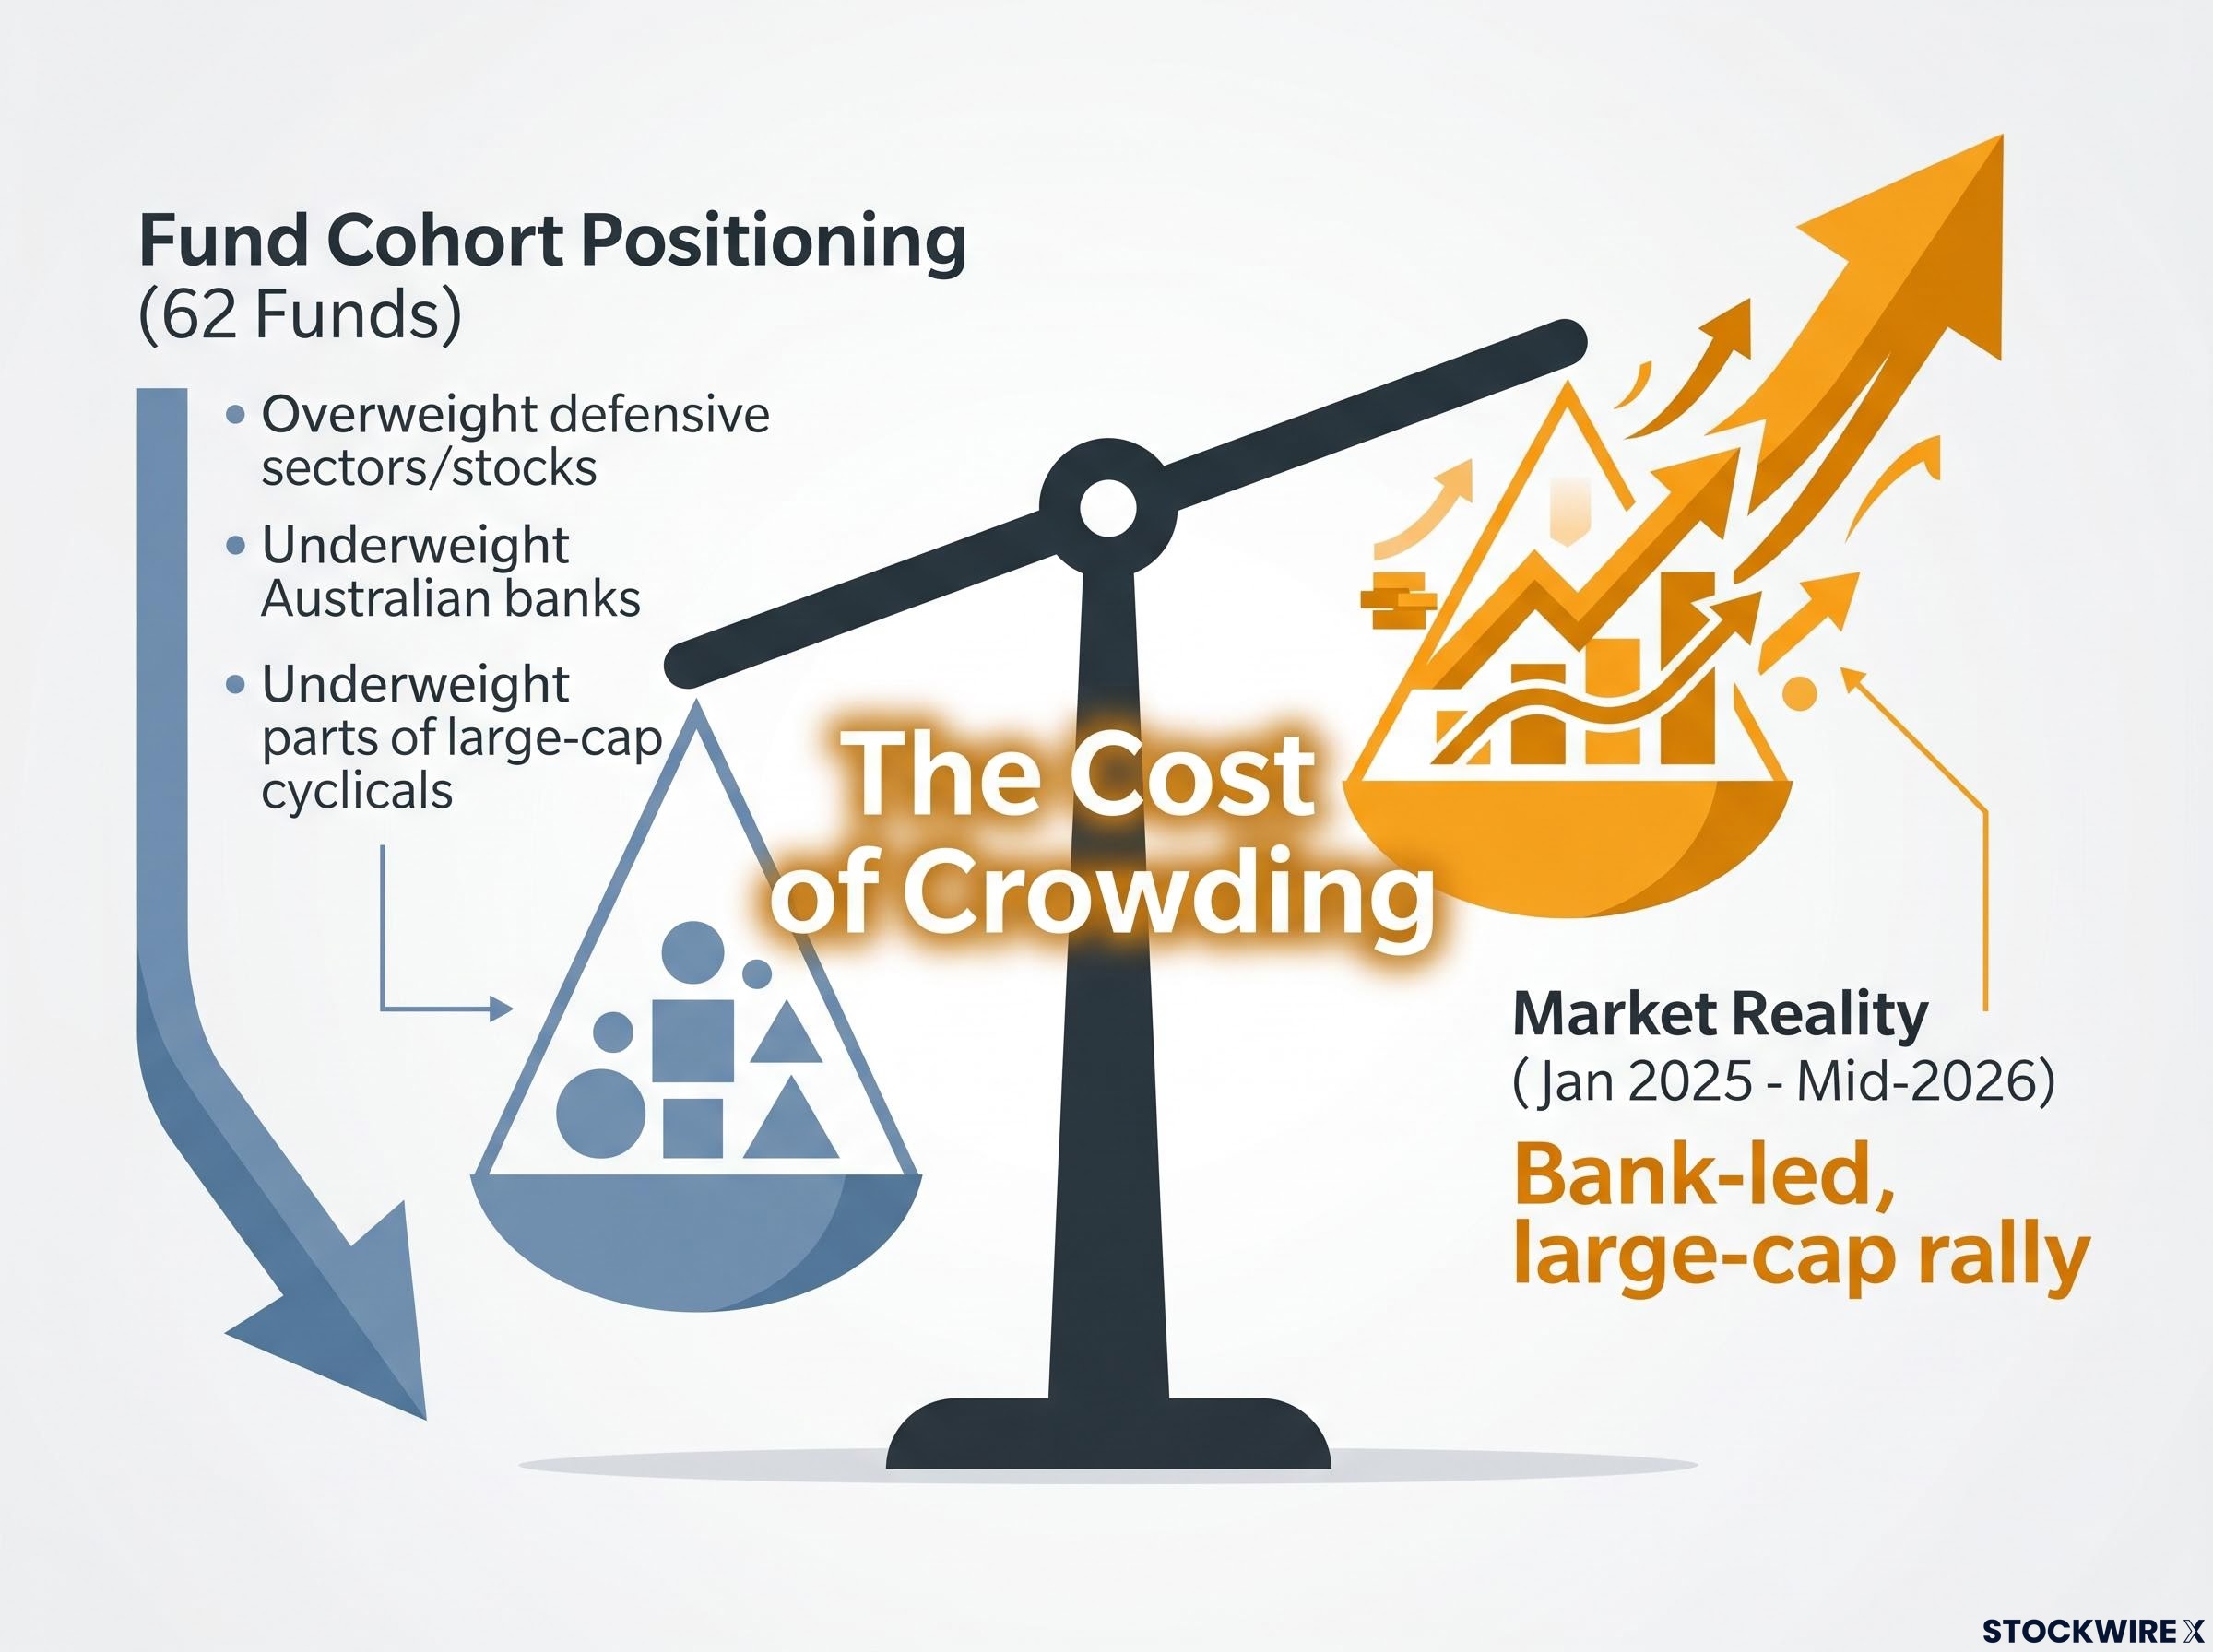
That misalignment alone would have been painful for the funds themselves. But for a retail investor mechanically copying those overweight positions, the damage compounded. When 62 funds share the same defensive tilt, replicating their holdings does not diversify across 62 independent views. It concentrates a portfolio into a single collective bet. The word for this is crowding, and crowding means that when the group is wrong, everyone copying them is wrong in exactly the same way.
Crowded institutional positioning is not unique to the Australian cohort: the June 2026 BofA Global Fund Manager Survey recorded 80% of global managers naming long semiconductors as the most crowded trade ever, a concentration that triggered a rotation out of technology and into inflation-resilient alternatives across a single survey cycle.
Within the Australian sharemarket, active equity funds sit behind only superannuation and offshore investors in terms of aggregate ownership, making their collective positioning carry real market weight. That weight cuts both ways: when the cohort leans one direction and the market moves the other, the mismatch is not a rounding error. It is structural.
The defensive tilt that proved costly across the 62-fund cohort sits within a broader pattern: active fund underperformance in Australia has persisted at rates above 74% in recent years, with SPIVA data showing the misses concentrated in large-cap equity where passive capital competes most directly.
The read here is not that these managers made a bad call. The defensive tilt was not irrational. It became a structural liability only when mechanically replicated, because copying crowded positioning amplifies mistakes at scale.
Why the direction of a trade carries more information than its size
A fund manager increases their position in a stock by 2% in a given month. That is a decision made under current market conditions, with current information, reflecting current conviction. It is live.
Now consider a different signal: the same manager holds a 6% overweight in a stock. What does that tell you? It could mean they are deeply convicted. It could mean they were convinced six months ago and have not revisited it. It could mean they want to sell but are managing the exit slowly to avoid moving the price.
Levels versus changes: the question the data is actually answering
A manager holding a large position in a stock for 18 months tells you nothing about their current view unless you also know whether they added to it, held it flat, or trimmed it last month. “What does this fund own?” and “What is this fund currently doing?” are different questions. Only the second is answered by trade data.
The trade-following basket is built on this distinction. It goes long the stocks receiving the largest aggregate monthly increases across the cohort and short those seeing the largest aggregate reductions, using the delta rather than the level.
Static holdings conflate three categories that should be kept separate:
Professional fund screening frameworks evaluate manager quality through people, process, and parent structure before performance data enters the picture, which matters here because a manager with structural process weaknesses is more likely to produce the anchored, inertia-driven top-holdings lists that the Morgan Stanley study identifies as the least useful signal.
- Legacy bets: positions held from a previous thesis that may no longer be active
- Anchored positions: holdings maintained partly due to behavioural inertia rather than ongoing conviction
- Genuinely current, high-conviction ideas: the actual signal
Anchoring, the tendency to hold existing positions longer than you would choose if starting from scratch, is well documented in behavioural finance. It means top holdings lists are contaminated by past decisions that look like current ones. When you copy a fund manager’s top-10 list, you are likely getting the least current part of their thinking. The most current decisions are the ones that changed the portfolio, not the ones that stayed put.
This reframes the concept of “smart money” away from ownership and toward decision-making. It is a lens you can apply whenever you encounter fund positioning data, not just in this study period.
What the study period does not prove, and why that matters
Before carrying the finding too far, three limitations deserve honest acknowledgement:
- Regime specificity: the approximately 17-18 month period strongly favoured large-cap stocks and Australian banks. A risk-off environment or a stretch of defensive-sector outperformance could narrow or reverse the gap between the two strategies.
- Replicability barriers: the trade-following basket is a long-short construction requiring short-selling capability and involving transaction costs that most retail investors cannot easily replicate.
- Disclosure lag: by the time a reported position increase appears in a publicly available fact sheet, the manager may already be trimming. Retail investors are always working with a delayed signal.
The sample of 62 funds, while substantial, is not the full universe of Australian active equity managers. And the figures of approximately -21% and +17% are specific to this regime, not forward-looking benchmarks.
None of this invalidates the core insight that direction carries more signal than level. But it does mean you should treat trade-following data as a coarse directional lens rather than a precise investment signal. The distinction between levels and changes is durable. The magnitude of the gap is regime-dependent.
How retail investors should actually read fund manager positioning data
The Morgan Stanley findings convert into three practical reframings you can apply the next time a fund manager disclosure crosses your screen:
- Treat top-10 holdings lists as historical artefacts. They show where conviction was, not where it is. A published list of largest positions tells you about accumulated past decisions, many of which may reflect inertia more than active endorsement.
ASIC’s financial product disclosure requirements govern what Australian managed fund operators must publish and when, establishing the legal framework that makes monthly fact sheets and position data accessible to retail investors in the first place.
- Ask whether multiple managers are adding to the same name over several consecutive months. Widespread ownership in a single reporting period is static. Persistent, multi-month buying across several managers is dynamic. Morgan Stanley’s findings suggest the second carries meaningfully more signal than the first.
- Use this as a risk-management lens. If your portfolio has heavy overlap with stocks that professional managers are collectively trimming, you may be accumulating concentrated exposure to crowded, exiting positions. The sectors the cohort collectively avoided during the study period, particularly Australian banks, turned out to represent the actual opportunity.
This article is for informational purposes only and should not be considered financial advice. Investors should conduct their own research and consult with financial professionals before making investment decisions.
The practical implication is not that you should attempt to replicate long-short fund flow strategies from your brokerage account. It is that you should change the question you ask when reading professional disclosures. Stop asking “what do they own?” Start asking “what are they currently doing?”
What the Morgan Stanley data changes about reading professional conviction
“Smart money” is not a photograph. It is a stream. The Morgan Stanley data, published 22 June 2026, gives that distinction a quantified face: approximately 38 percentage points of difference between treating professional positioning as a snapshot and treating it as a sequence of live decisions.
This does not make active fund managers infallible. Their trade data is not a reliable short-term timing tool, and disclosure lags mean even the freshest publicly available signal is already ageing. But the study identifies a more useful way to extract information from publicly available data, and that is worth carrying forward.
Ranked by aggregate ownership of ASX-listed shares, active Australian equity managers place third overall, sitting below superannuation and offshore investors, yet they trade more frequently than either group. Their directional decisions will continue to generate meaningful aggregate flow data. The question is whether you read it as a list of names to copy or a pattern of decisions to interpret.
For readers who want to see the same levels-versus-changes distinction applied to the most scrutinised public disclosures in global markets, our full explainer on reading 13F filings examines how Berkshire Hathaway tripled its Alphabet position in Q1 2026 while Pershing Square fully exited, and what the structural timing lag in those filings means for anyone trying to replicate institutional trades.
The distinction between levels and changes sounds small. Over 17-18 months and 62 funds, it was worth 38 percentage points. That is the gap between following what professionals own and understanding what they are actually telling you with their trades.
Past performance does not guarantee future results. The strategy outcomes described reflect a specific market regime and are not indicative of expected future returns.