The Smartphone Market Paradox: Volume Falls, Value Climbs
16 mins ago
Global smartphone shipments are set to hit their lowest annual volume since 2013, yet Apple just grew Q1 unit sales in both the United States and China simultaneously. Counterpoint Research is projecting a 13.9% contraction in global smartphone shipments for full-year 2026, a figure Citi highlighted in a same-day research note following an industry expert consultation. The contraction is being driven by demand pull-forward effects from earlier upgrade cycles and elevated memory costs, pressures that are falling disproportionately on Android device manufacturers. What follows unpacks what the data says about Apple’s structural divergence from the rest of the industry, why Android OEMs are bearing the brunt of the downturn, and what the China share story means for AAPL investors tracking the company’s long-term trajectory.
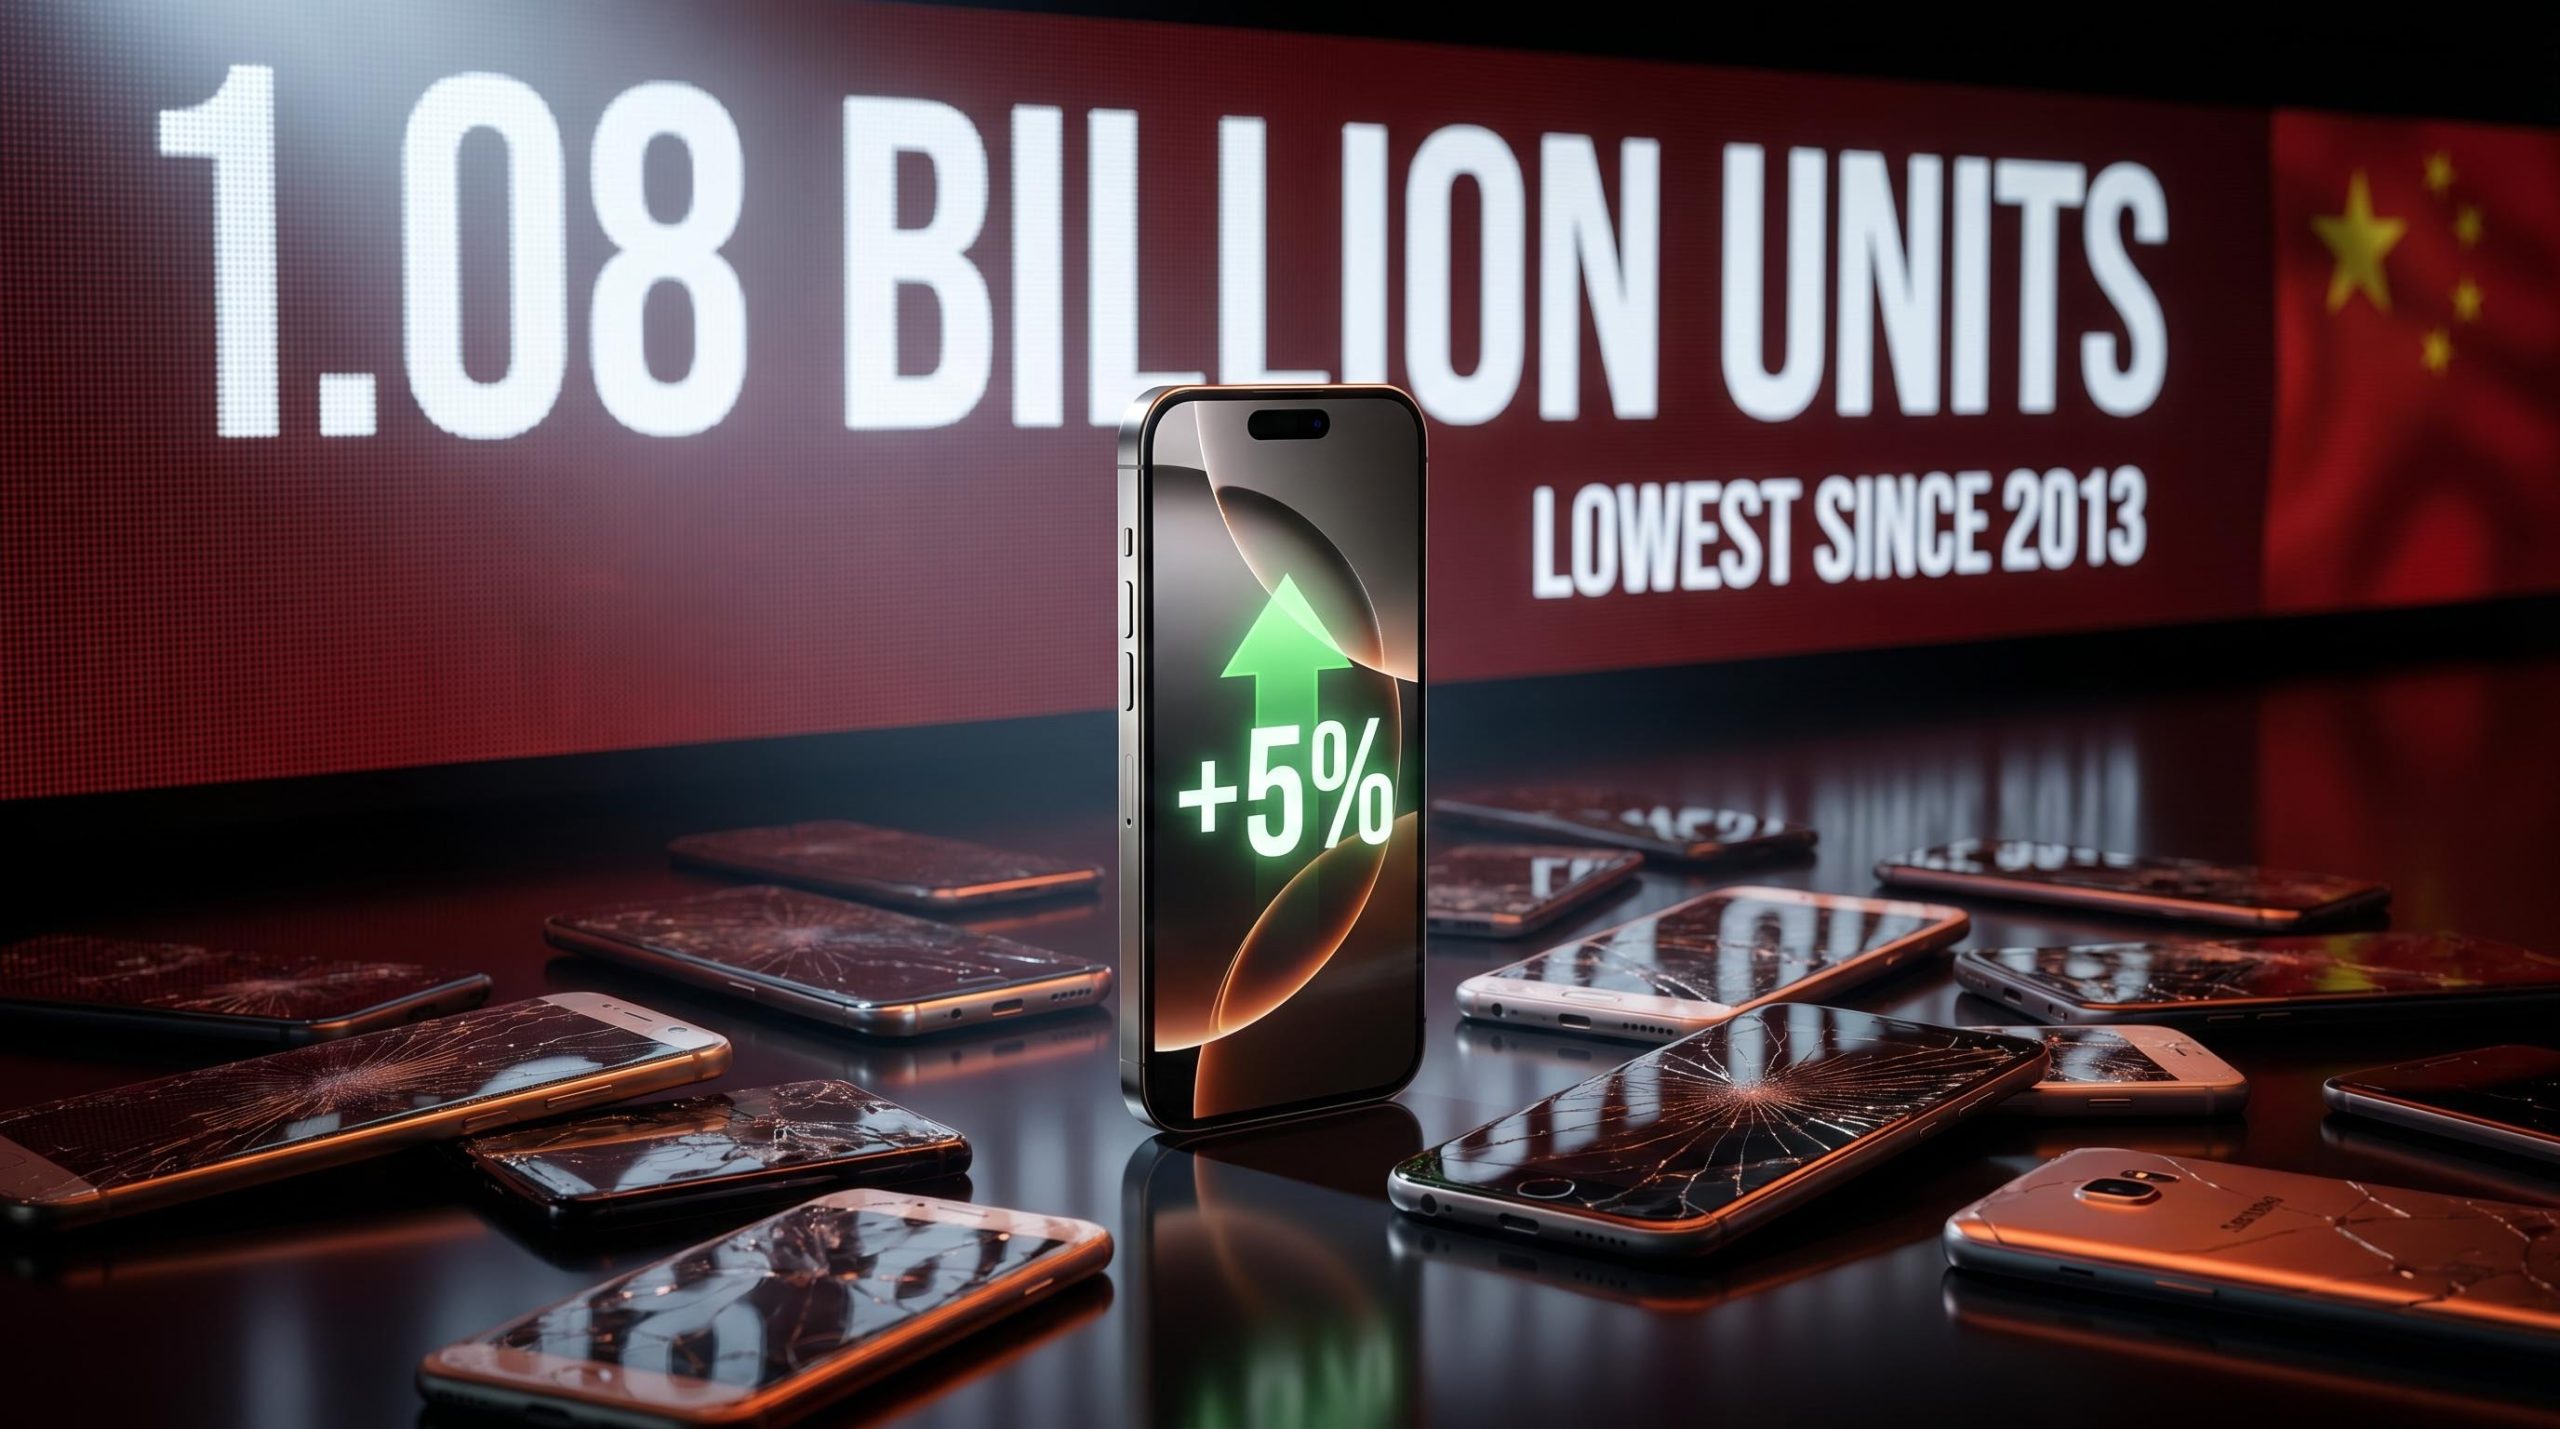
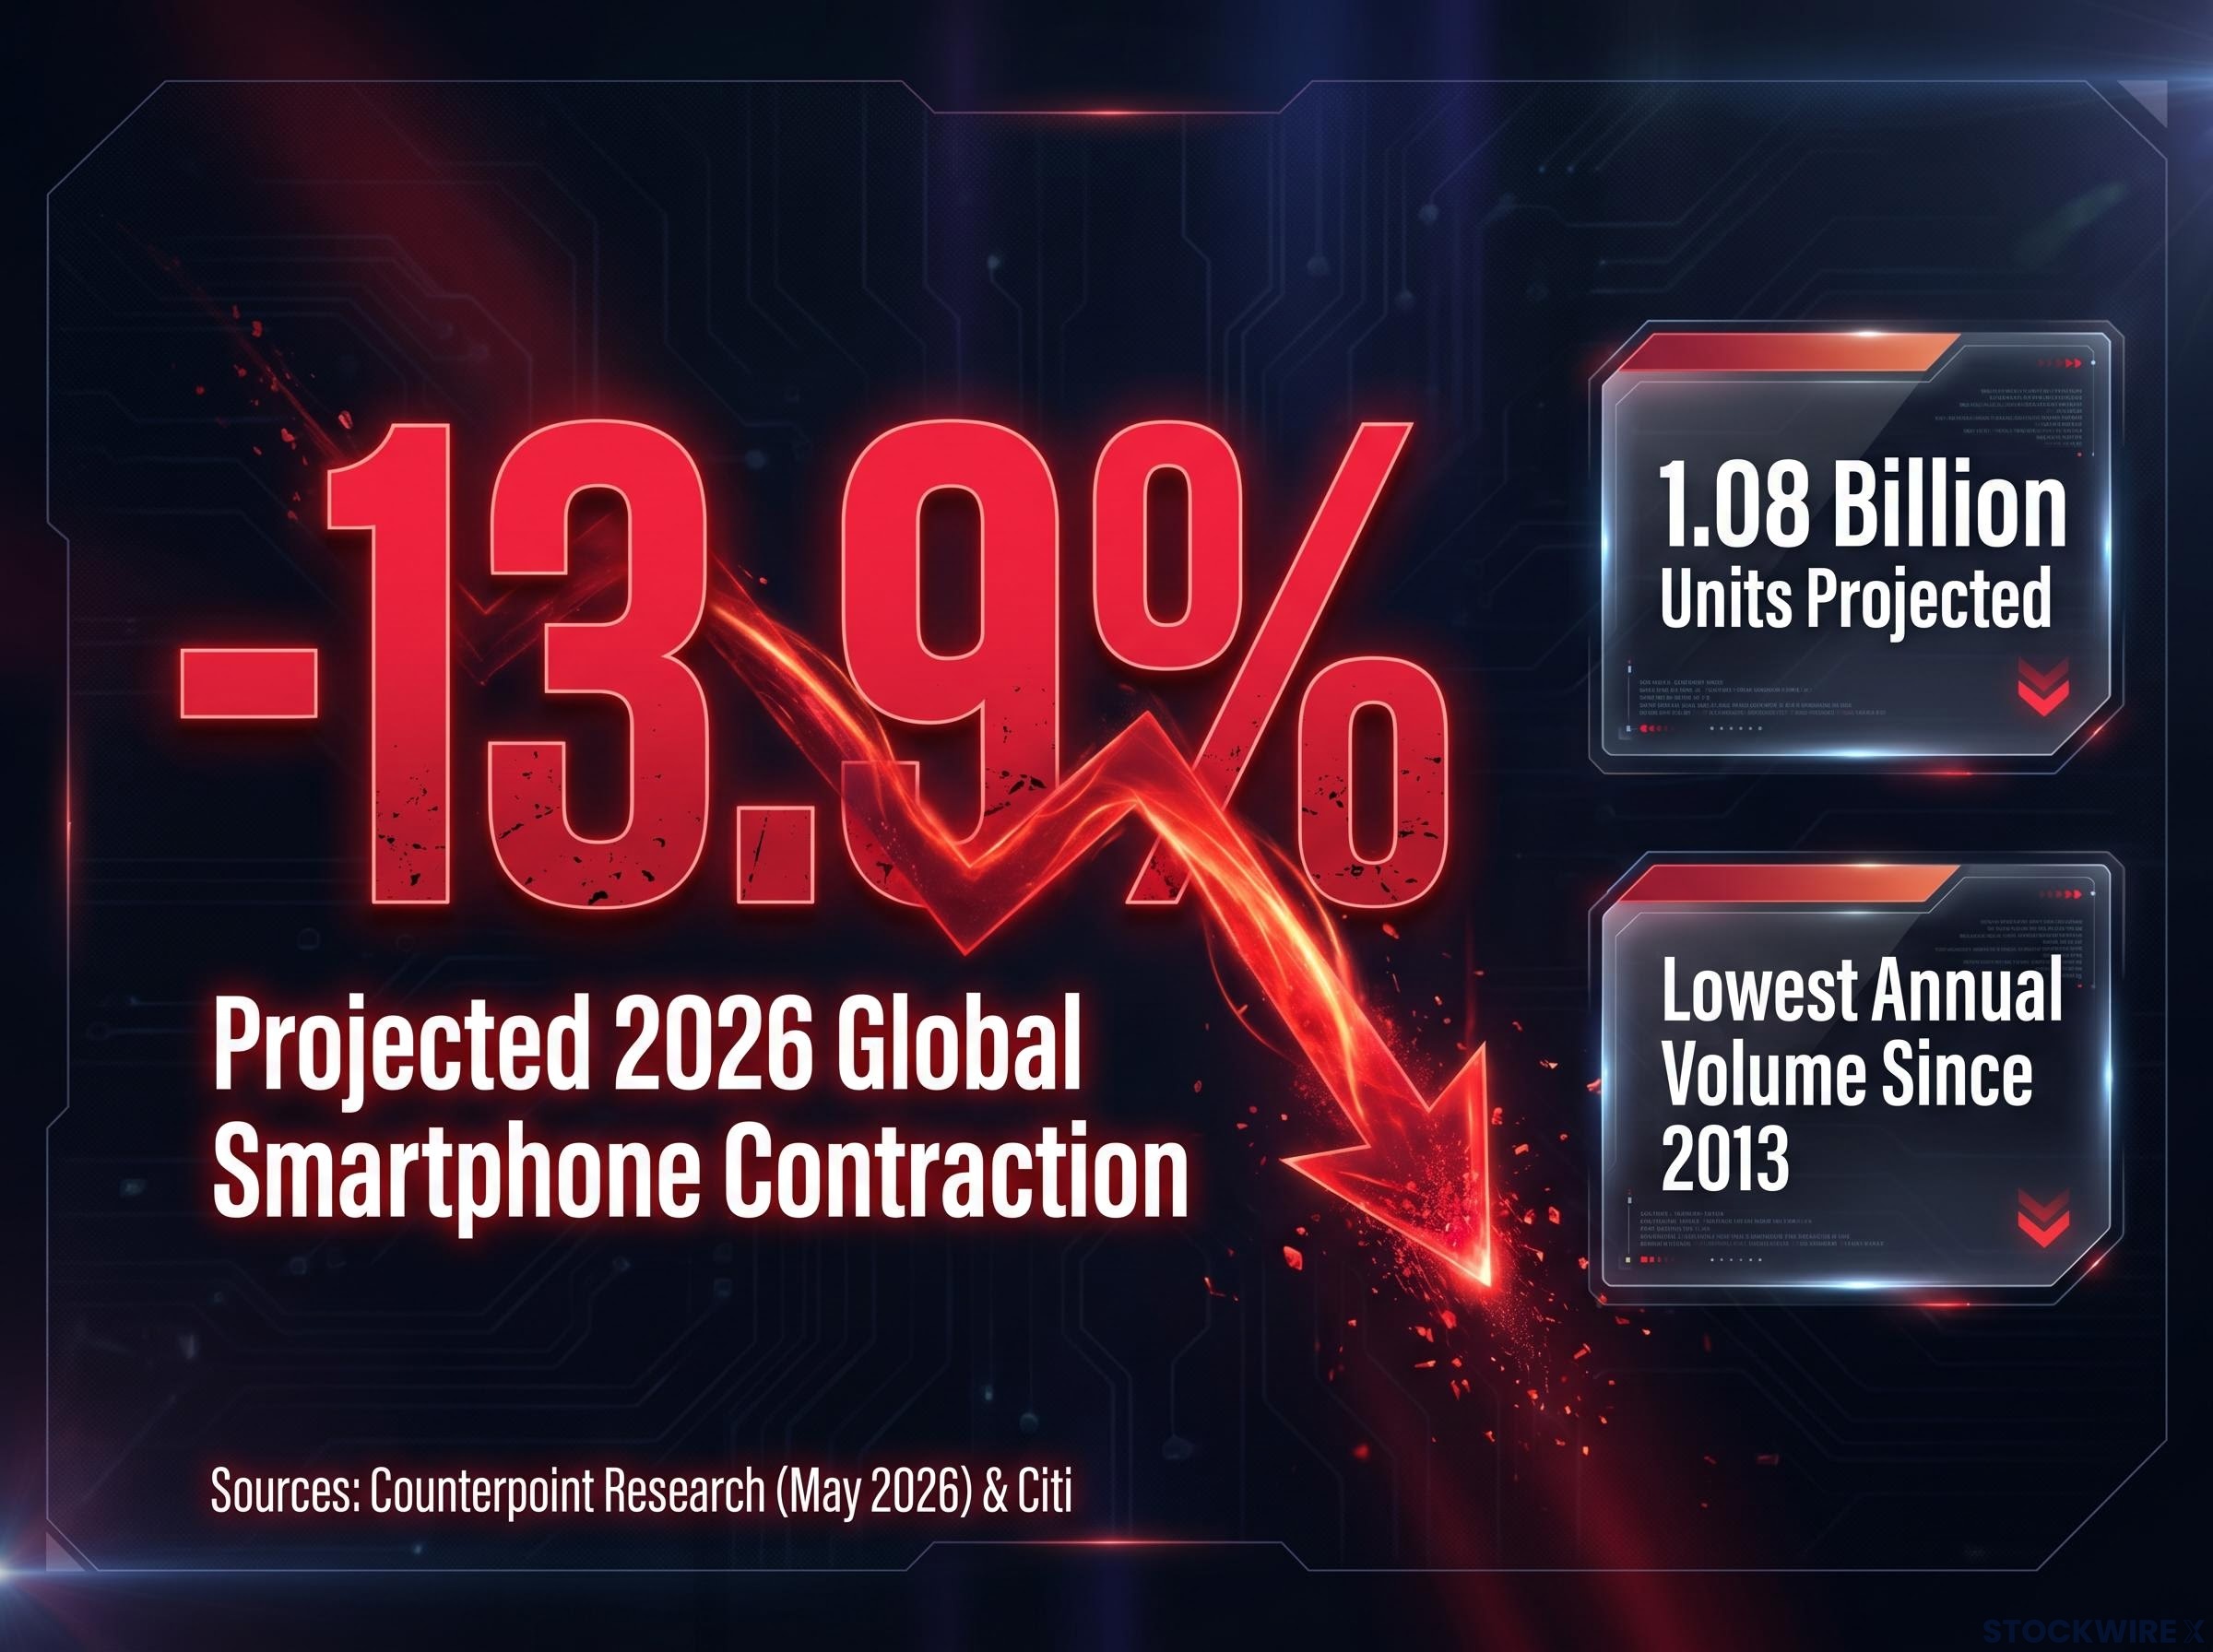
The scale of the projected decline is difficult to overstate. Counterpoint Research, in a report published on 31 May 2026, forecast global smartphone shipments to fall 13.9% year-over-year in 2026, dropping volumes to approximately 1.08 billion units.
Counterpoint Research projects global smartphone shipments will fall 13.9% year-over-year in 2026, to approximately 1.08 billion units, the lowest annual volume since 2013. Citi cited the figure in a research note the same day.
Two forces are compressing the market simultaneously. Demand pull-forward from earlier upgrade cycles has left fewer buyers in the pipeline, and elevated memory costs are squeezing margins across the supply chain. The pain, however, is not evenly distributed.
What makes this contraction different from a typical cyclical dip is how it is sorting the industry. Share is consolidating toward a smaller set of premium-positioned brands, and the company absorbing less damage than any other major manufacturer is Apple.
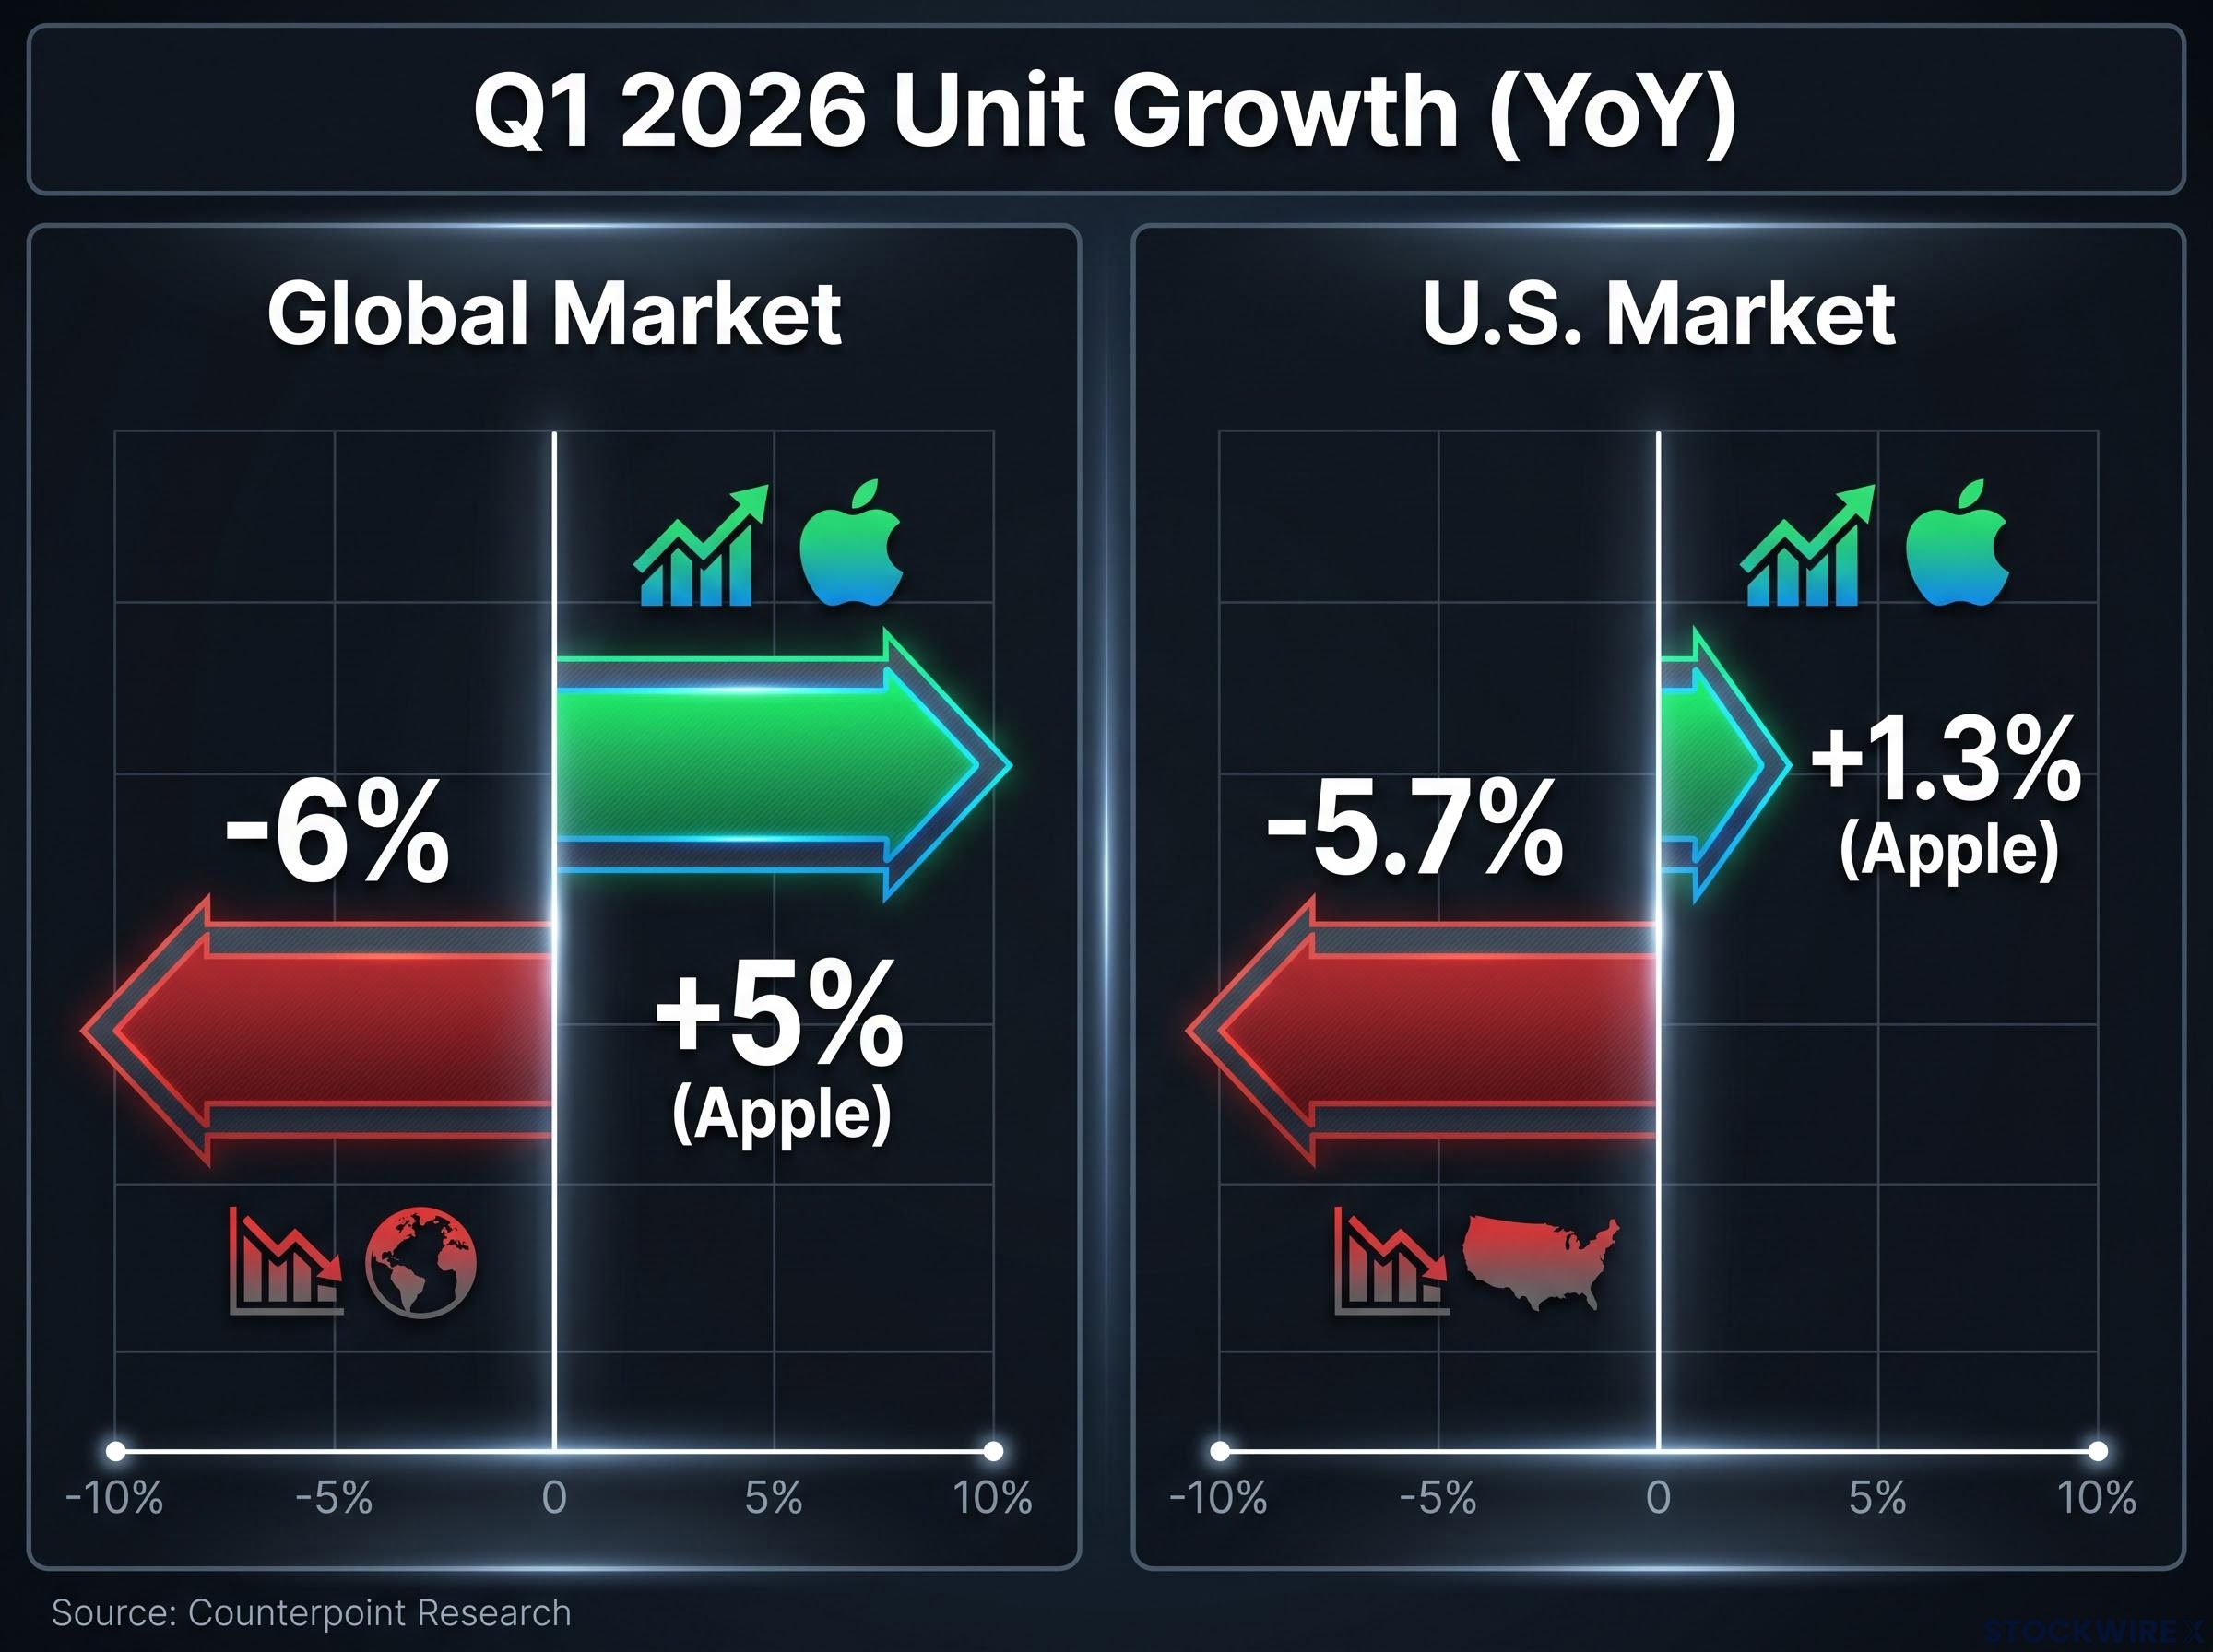
Apple grew global shipments approximately 5% year-over-year in Q1 2026, according to Counterpoint Research, while the overall global market declined approximately 6%. That gap, roughly 11 percentage points of relative outperformance, is the widest Apple has recorded in a non-launch quarter.
The company captured approximately 21% of global smartphone shipments in Q1 2026, the first time it has led a post-holiday quarter. Leading in Q4 (which includes the iPhone launch window and holiday gifting) is expected. Leading in Q1 is not, and it suggests demand for iPhones is running on structural drivers rather than seasonal ones.
Apple’s fiscal Q2 earnings, reported on 1 May 2026, confirmed the shipment leadership with $111.2 billion in record quarterly revenue and iPhone revenue of $56.99 billion, up 21.7% year on year, translating the unit share gains documented in Counterpoint’s data into financial results that beat Wall Street consensus on every headline metric.
Counterpoint Research Q1 2026 shipment data confirms Apple captured approximately 21% of global smartphone shipments in the quarter, marking the first time the company has led a post-holiday quarter and representing roughly 11 percentage points of outperformance relative to a market that contracted approximately 6%.
| Market | Q1 2026 unit growth (YoY) | Apple share / OS share | Source |
|---|---|---|---|
| Global market | -6% (approx.) | N/A | Counterpoint Research |
| Apple global | +5% (approx.) | ~21% shipment share | Counterpoint Research |
| U.S. market | -5.7% (approx.) | N/A | Counterpoint Research |
| Apple U.S. | +1.3% (approx.) | ~59-61% iOS share | Counterpoint Research; Statcounter |
In the United States, Apple’s iPhone unit sales grew approximately 1.3% year-over-year in Q1 2026 while the broader U.S. smartphone market fell approximately 5.7%, according to Counterpoint Research. Statcounter Global Stats places iPhone OS share in the U.S. at roughly 59-61% over the same period. Citi’s research note characterised Apple as having recorded incremental year-over-year growth in April 2026 and anticipated to continue gaining share.
The divergence between Apple and its Android competitors is not a matter of timing or luck. It is structural, and it traces back to where each side of the industry competes and how their business models are built.
Android OEMs are concentrated in mid- and low-end price bands, precisely the segments where demand pull-forward effects and inventory overhang have been most severe. Emerging markets, where Android vendors hold dominant share, have experienced the sharpest unit declines. The memory cost dynamic compounds the pressure: Android vendors compete heavily on hardware specifications and pricing, making them structurally more exposed to component cost swings than a vertically integrated competitor.
Apple’s insulation rests on three factors:
Understanding why Apple is insulated, not just that it is, matters for assessing durability. A broad market recovery would lift Android OEM volumes, but it would not close the structural gap in margin composition or vertical integration that is driving the current divergence.
The most counterintuitive number in the Q1 2026 data belongs to China.
iPhone shipments in China grew approximately 20% year-over-year in Q1 2026, the fastest growth rate among major vendors, according to Reuters and Counterpoint Research, despite an overall decline in the Chinese smartphone market.
This is not an isolated quarter. Apple had already reclaimed a leading competitive position in China’s smartphone market in Q4 2025, driven by strong demand for the iPhone 17 lineup, according to Counterpoint Research. The Q1 2026 acceleration is a continuation of that momentum, not a one-off.
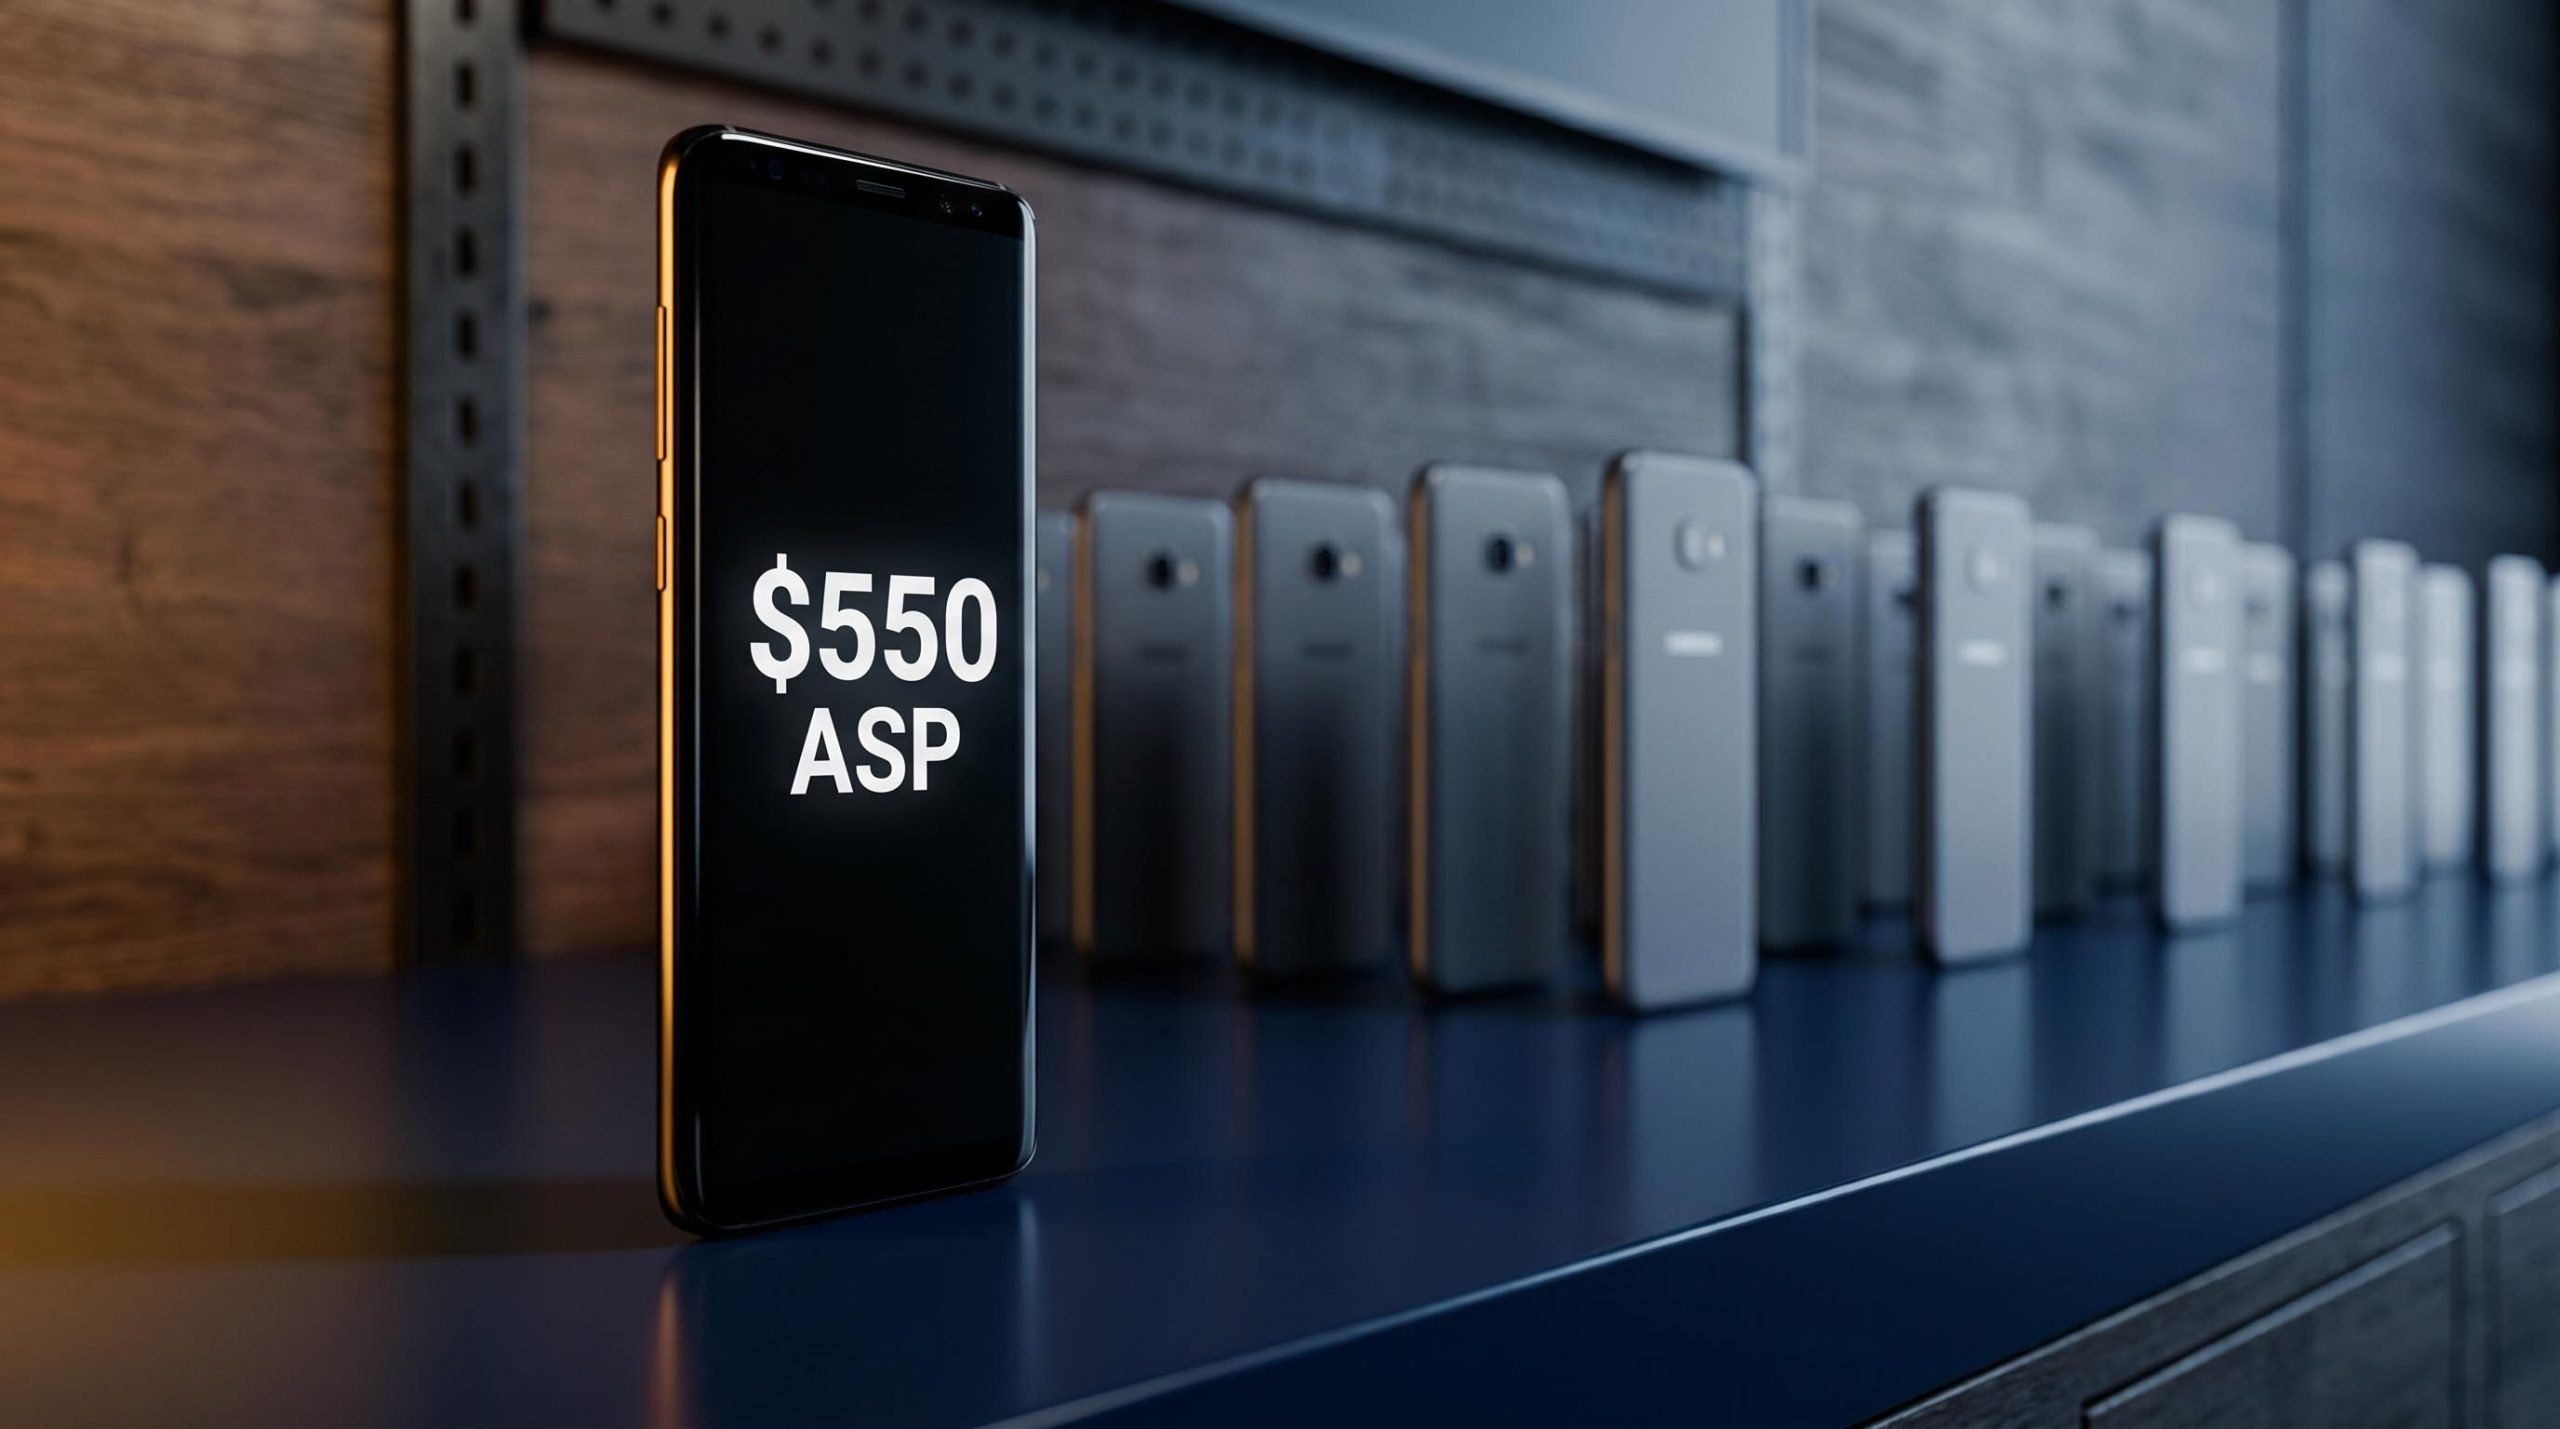
Citi’s research note, drawing on channel checks and proprietary consultation, identified the $300-$600 mid-range price band as the segment supporting Apple’s broader accessibility in China. Older and refurbished iPhone models falling into this tier via carrier promotions, subsidies, and instalment plans represent a plausible on-ramp for first-time or value-conscious iPhone buyers.
China is Apple’s second-largest market and historically its most volatile. A 20% growth quarter in a declining market suggests the iPhone 17 upgrade cycle is running considerably hotter there than the macro environment would predict.
The budget and refurbished channel narrative is strategically compelling, but it requires honest handling of where the evidence is strong and where it remains inferential.
The mechanism is straightforward: older-generation iPhones and refurbished units reaching the $300-$600 price tier through carrier promotions and instalment plans create an entry pathway for cost-conscious Chinese consumers. Once inside the ecosystem, these users become full participants in Apple’s services flywheel, purchasing apps, subscribing to services, and eventually upgrading to newer hardware.
Services margins are significantly higher than hardware margins. That dynamic means users acquired at lower average selling prices still contribute meaningful lifetime value, reinforcing the logic of installed-base expansion even when near-term hardware revenue per unit is modest.
The investment case emerging from the 2026 smartphone contraction rests on three pillars:
Citi’s research note characterised Apple as anticipated to continue gaining market share going forward, framing the outperformance as structural rather than a single-quarter observation.
One risk warrants flagging. The China budget-channel tailwind is based on channel checks and proprietary analysis rather than publicly quantified data, and investors should weigh it accordingly. The well-documented evidence, global share gains, U.S. iOS penetration, and China’s 20% shipment growth, stands on its own. The refurbished and older-model accessibility narrative adds optionality around services revenue, AI feature adoption, and ecosystem cross-sell, but it remains less fully documented than the headline growth figures.
Valuation and AI monetisation concerns weighed on AAPL shares even after the record result, with the stock falling approximately 1.3% in extended trading as investors flagged the unresolved question of how Apple Intelligence converts its growing installed base into incremental services revenue, a gap that sits alongside the risks noted in this analysis.
This article is for informational purposes only and should not be considered financial advice. Investors should conduct their own research and consult with financial professionals before making investment decisions.
The outperformance case rests on multiple independent data sources: Counterpoint Research, Reuters, Statcounter, and Citi’s institutional research. No single analyst view or bullish narrative carries it alone.
If the structural pressures on Android OEMs, memory costs, mid-range demand softness, and inventory overhang, persist through 2026, Apple’s relative advantage is unlikely to reverse quickly. The competitive dynamics favouring the company are embedded in business model architecture, not market sentiment.
The next data point for investors tracking AAPL: whether the iPhone 17 upgrade cycle momentum in China and the United States carries through to Q2 and Q3 2026 shipment data. The structural case says it should. The numbers will confirm whether it does.
Investors tracking whether iPhone 17 momentum carries through to the next reporting window will find our full explainer on Apple’s Q3 guidance outlook, which examines the 14-17% growth guidance that nearly doubled Wall Street’s 9.5% consensus estimate and the memory-chip supply constraints that represent the primary variable between the bull and bear scenarios for the second half of 2026.
Forward-looking statements regarding market share trends and upgrade cycle momentum are subject to change based on market developments, competitive dynamics, and macroeconomic conditions.
Counterpoint Research projects global smartphone shipments will fall 13.9% year-over-year in 2026, dropping to approximately 1.08 billion units, which would be the lowest annual volume since 2013.
Apple grew global shipments approximately 5% year-over-year in Q1 2026 while the overall market declined approximately 6%, capturing roughly 21% of global smartphone shipments, the first time Apple has led a post-holiday quarter.
iPhone shipments in China grew approximately 20% year-over-year in Q1 2026, driven by strong demand for the iPhone 17 lineup and mid-range accessibility through carrier promotions, subsidies, and instalment plans for older and refurbished models in the $300-$600 price band.
Android OEMs are concentrated in mid- and low-end price bands where demand pull-forward and inventory overhang have hit hardest, and they lack Apple's vertical integration, pricing power, and services revenue buffer that insulate it from component cost swings.
The key indicator for AAPL investors is whether iPhone 17 upgrade cycle momentum in China and the U.S. carries through to Q2 and Q3 2026 shipment data, with Citi characterising Apple's outperformance as structural rather than a single-quarter observation.