Apple’s AI Bet Is a Services Play, Not an iPhone Supercycle
37 mins ago

No major broker currently holds a buy rating on Westpac shares, and the average 12-month analyst price target sits below where the stock is trading today. For investors focused on capital growth, that combination is a clear warning. Yet for Australian investors who prioritise franked dividend income, the calculus looks different. The gap between a cash yield of approximately 4.6% and a grossed-up yield of approximately 6.5% is not a rounding error; it is the difference between a stock that screens as fairly valued and one that still earns its place in an income-oriented portfolio. This analysis breaks down the current broker landscape for Westpac (ASX: WBC), walks through a practical $8,000 investment scenario using FY2027 forecasts, and assesses how Citi’s neutral-but-constructive $37.50 price target reshapes the total return picture for investors weighing the bank as an income-plus-capital holding.
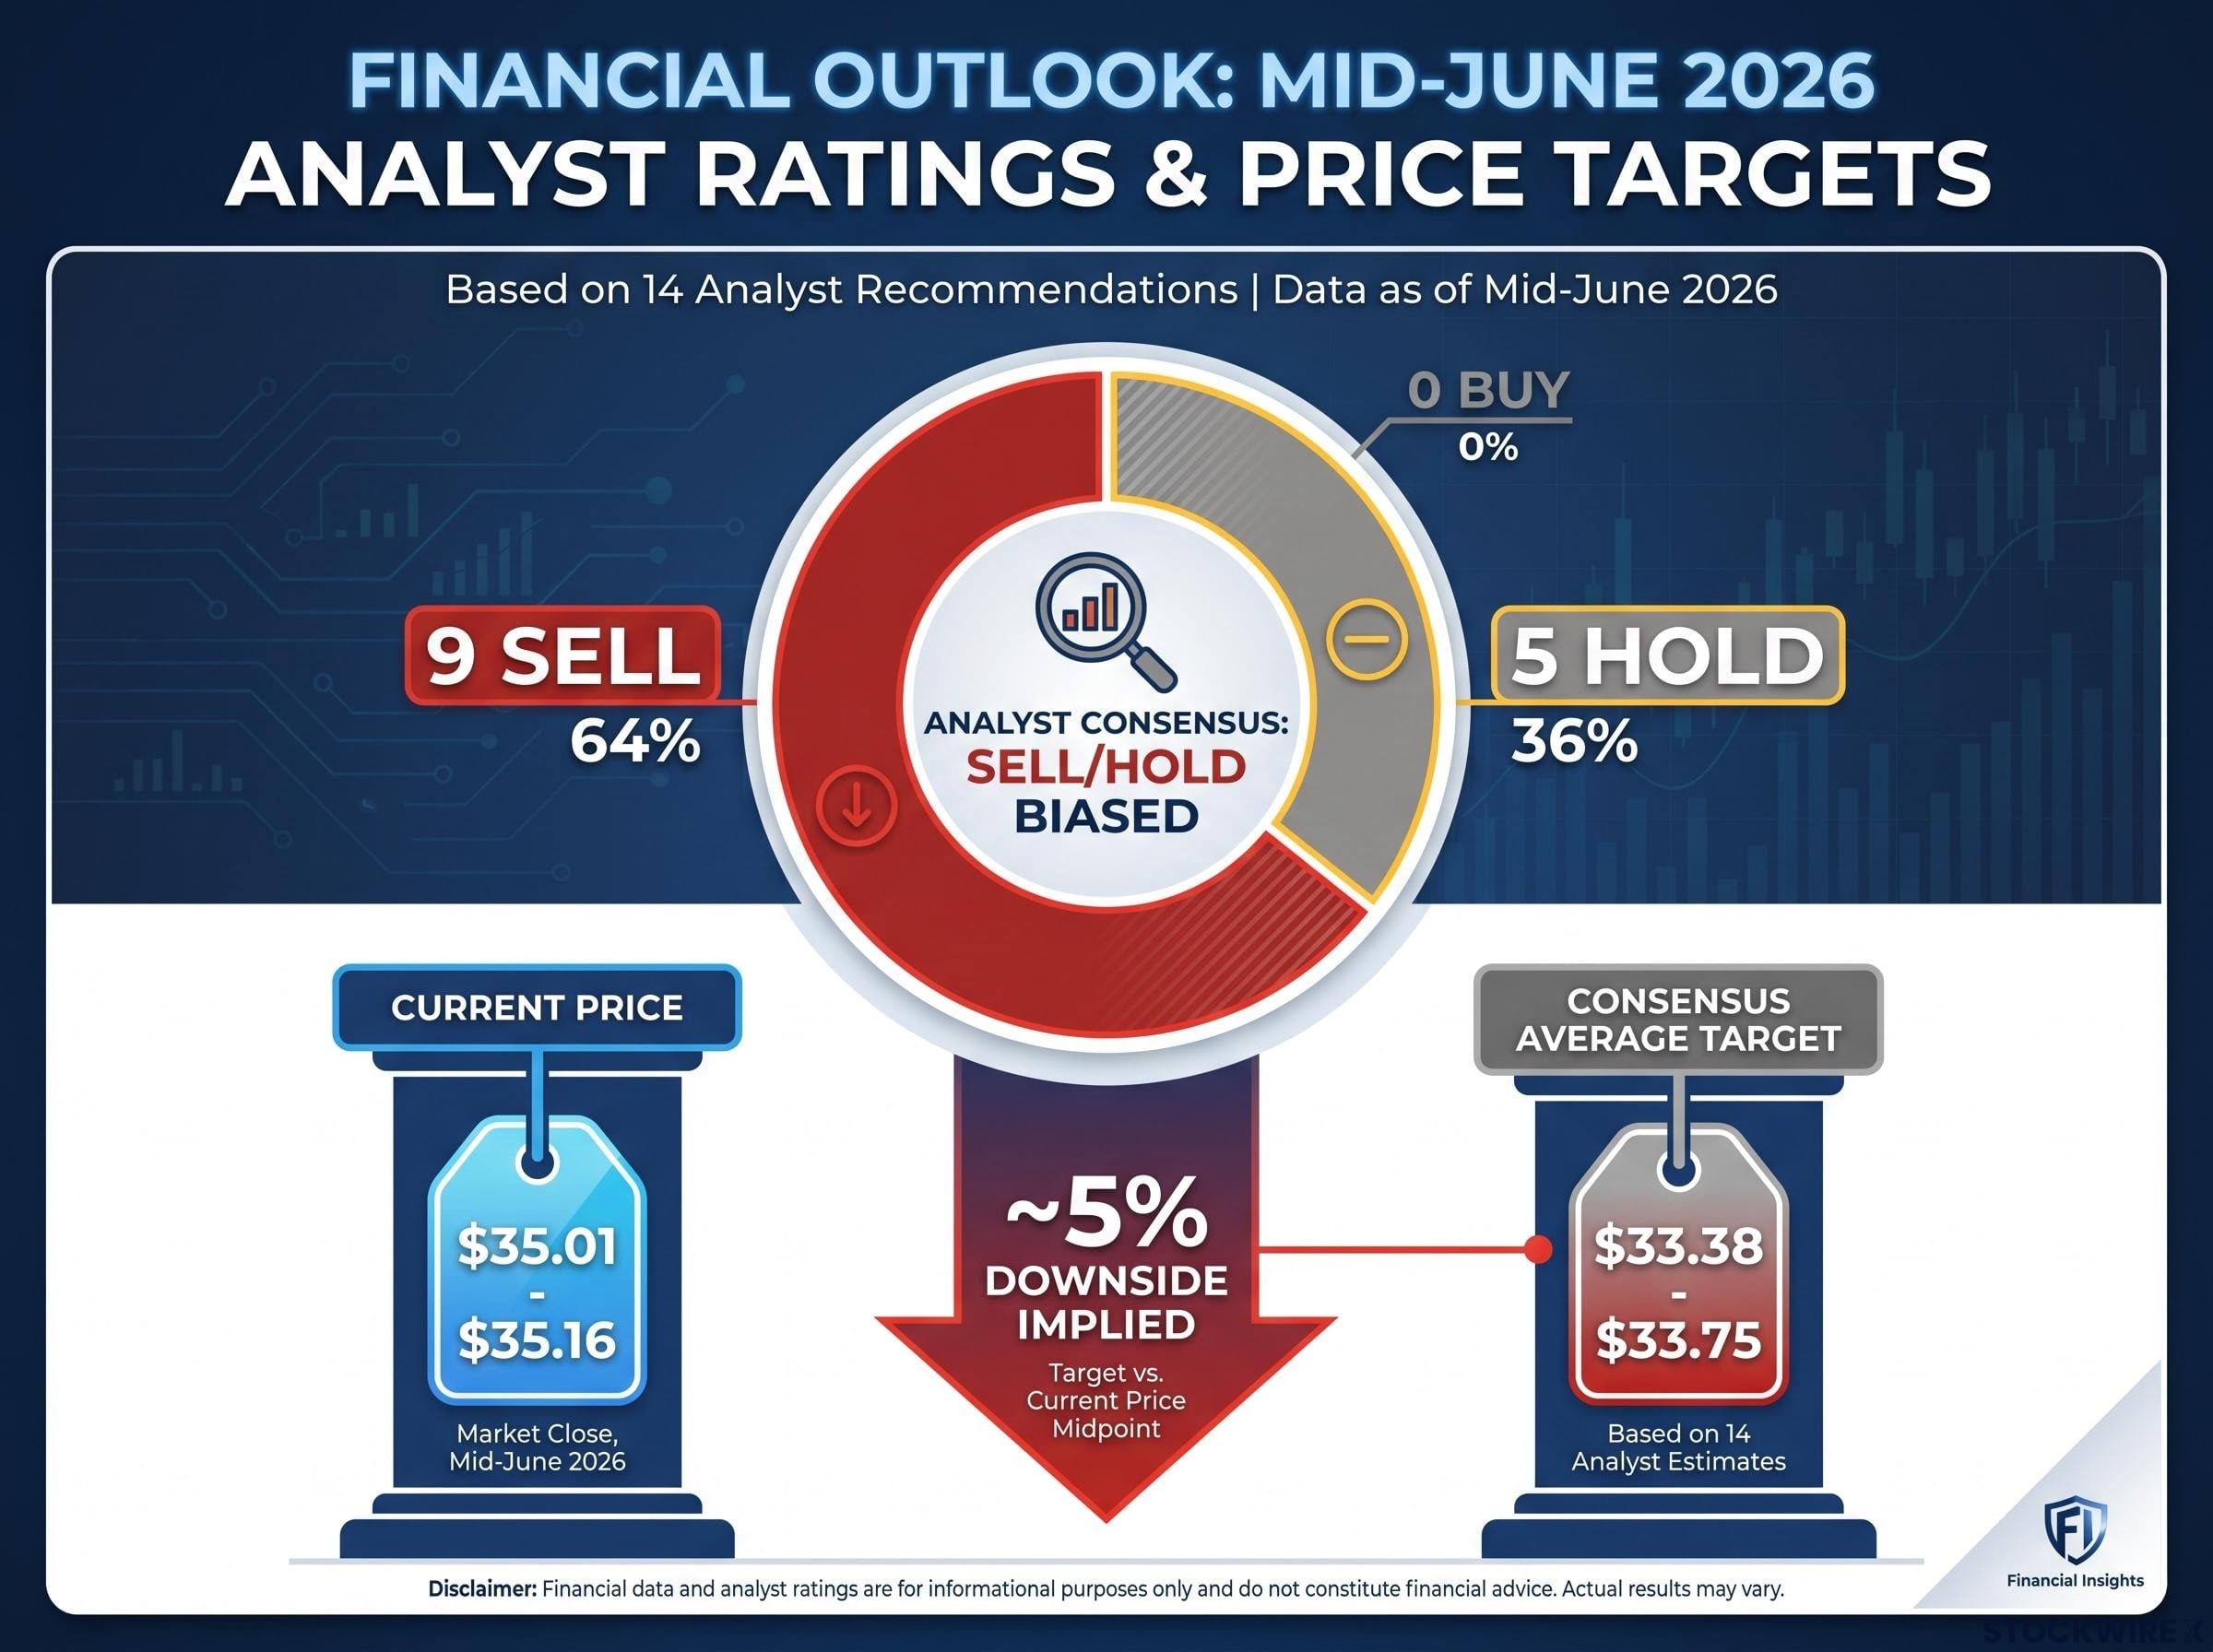
The consensus signal is blunt. Across 14 analysts tracked by major consensus aggregators including Investing.com, Marketscreener, and TipRanks as of mid-June 2026, Westpac carries approximately zero buy ratings, five hold ratings, and nine sell ratings. The overall recommendation sits at “Sell.”
In practical terms, this means the broker community, on average, considers the shares to be trading at or above assessed fair value over the next 12 months. The average consensus price target of approximately $33.38 to $33.75 implies roughly 5% downside from Westpac’s recent trading level of approximately $35.01 to $35.16. The range is wide: the highest target among tracked brokers sits near $40.00, while the lowest falls to approximately $29 to $30.
| Rating Category | Number of Analysts | Average Price Target | Implied Direction from ~$35 |
|---|---|---|---|
| Buy | 0 | N/A | N/A |
| Hold | 5 | Above consensus average | Mild upside to neutral |
| Sell | 9 | Below current price | Downside |
| Consensus | 14 | ~$33.38-$33.75 | ~5% downside |
That said, the distribution is not monolithic. The five hold-rated brokers, including Citi, represent a more neutral stance that separates them from the outright bearish majority.
The disconnect between sell-side consensus and market pricing is not unique to Westpac: a sector-wide valuation gap has persisted across all four major ASX banks through mid-2026, with price momentum and analyst price targets pointing in opposite directions across the board.
“Across the broker community, Westpac attracts very few buy ratings and overall sits on a consensus Sell, reflecting a view that the shares are trading at or above what many analysts consider fair value.”
Citi’s neutral (Hold) rating and $37.50 price target sit above the consensus average of $33.38 to $33.75, making it one of the more constructive views in the coverage universe. The arithmetic is straightforward, though each input carries forecast risk.
The total return scenario breaks into three components:
That combined figure is notable. A Hold-rated stock carrying double-digit total return potential illustrates why dividend yield changes the equation for income-focused investors, even when the broker does not see enough conviction for a buy call.
The reliability of each component deserves equal weight. Citi’s $37.50 target and neutral rating should be verified against the latest Citi research note or a data service such as Refinitiv, FactSet, or S&P Capital IQ to confirm currency. The $1.60 dividend is a consensus forecast, not a guaranteed payment.
“This total return estimate of approximately 11.6% to 12% assumes both the $37.50 price target and the $1.60 FY2027 dividend forecast are fully realised, which is not guaranteed.”
Australia’s dividend imputation system is designed to prevent double taxation of corporate profits. When a company such as Westpac pays its 30% corporate tax on earnings, eligible shareholders receive a tax credit, known as a franking credit, attached to the dividend. That credit represents the tax the company has already paid on the investor’s behalf.
The franking credit calculation follows the same 30/70 formula used across all fully franked ASX dividends: the cash dividend multiplied by 30, divided by 70, with the resulting credit representing corporate tax already remitted to the ATO on the shareholder’s behalf.
The calculation that turns a cash dividend into grossed-up income follows three steps:
For investors who can fully utilise those credits, the difference between a 4.6% cash yield and a 6.5% grossed-up yield represents real additional income, not a theoretical abstraction.
The full benefit flows to investors whose marginal tax rate is at or below the 30% corporate rate. This includes many retirees and superannuation funds in pension phase, where franking credits may be fully refundable as a cash payment from the Australian Taxation Office.
The ATO guidance on franking credit refunds confirms that eligible individuals can receive the excess credits as a cash payment once their income tax and Medicare levy liabilities have been met, which is the mechanism that makes the grossed-up yield calculation a tangible income outcome rather than a theoretical one for retirees and pension-phase superannuation funds.
Investors on higher marginal tax rates still receive a partial offset. However, those on the highest marginal rate (45% plus Medicare levy) receive materially less benefit, as the franking credit covers only a portion of their total tax liability on the dividend income.
Franking credit outcomes are personal to each investor’s tax position. The worked examples throughout this analysis represent a general illustration only, and investors should consider their own circumstances or consult a financial adviser before relying on grossed-up yield figures.
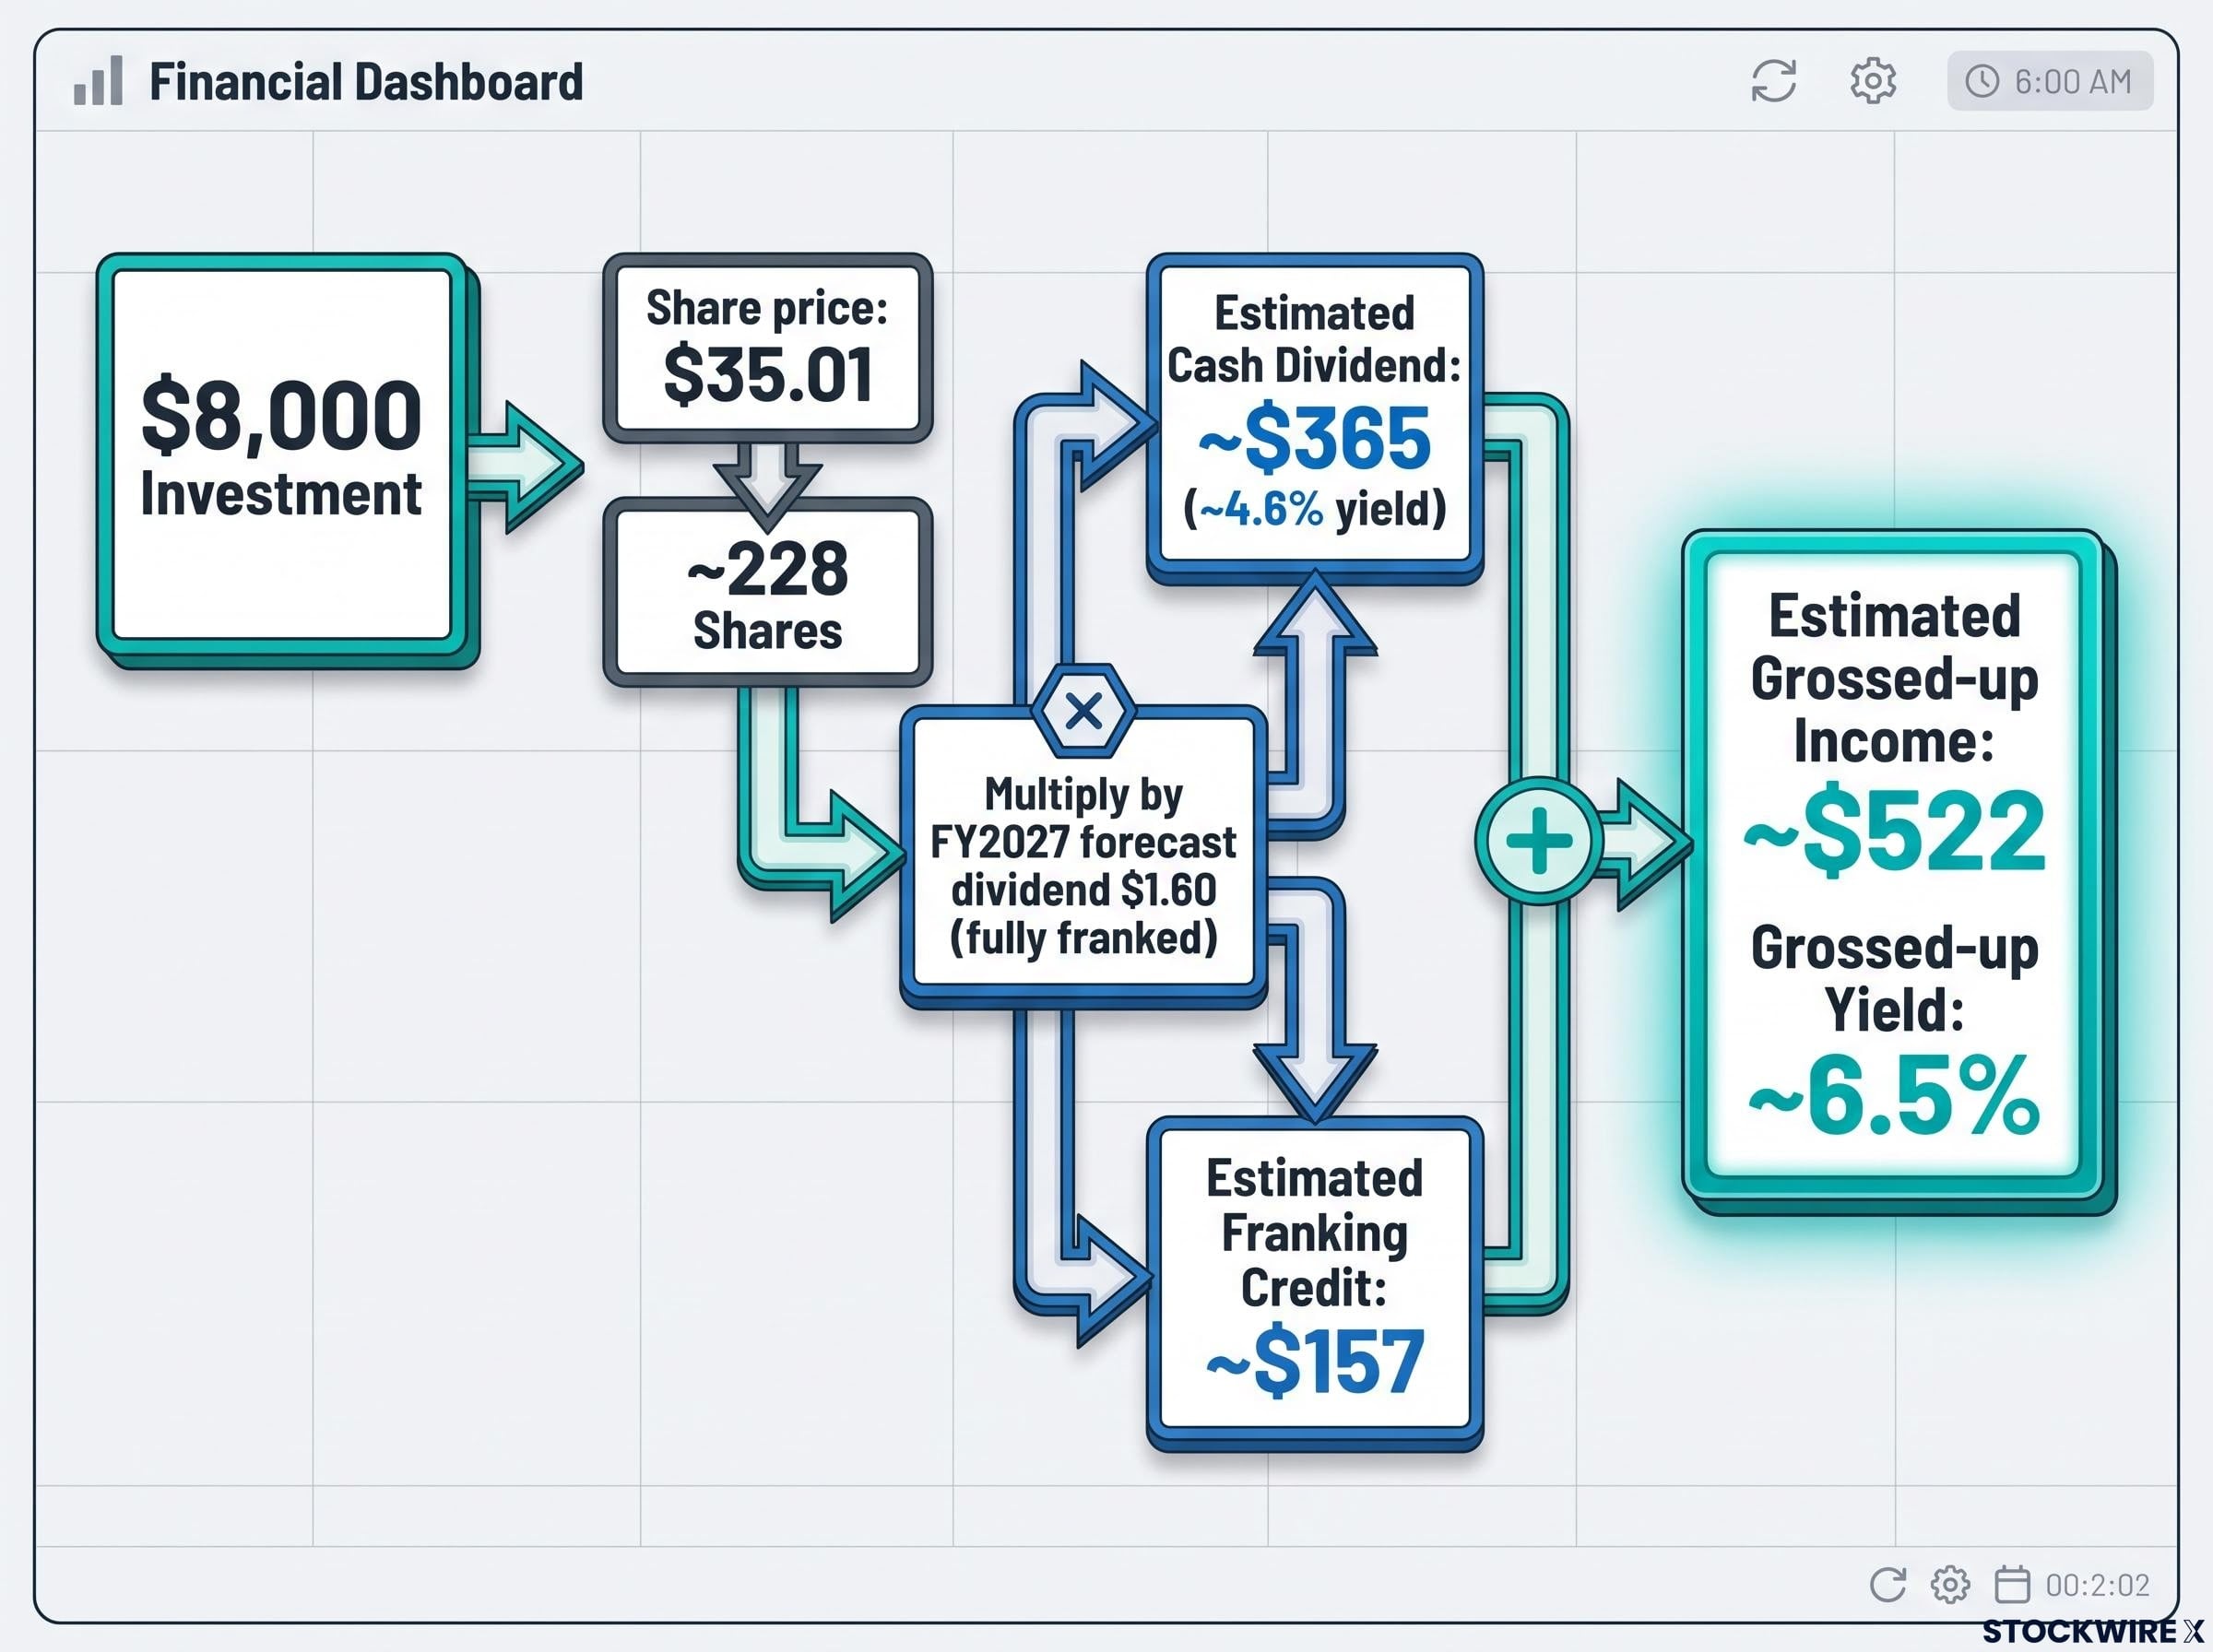
The following scenario uses a share price of $35.01, an investment amount of $8,000, and the FY2027 forecast fully franked dividend of $1.60 per share. Every figure in the chain can be independently verified.
At $35.01 per share, $8,000 purchases approximately 228 shares. Those 228 shares multiplied by $1.60 produce a cash dividend of approximately $364.80 (roughly $365). Dividing that by the $8,000 outlay gives a forward cash yield of approximately 4.56%, rounded to 4.6%.
Applying the franking credit formula: $364.80 multiplied by (30 divided by 70) equals approximately $156.90 (roughly $157). Adding the cash dividend and the franking credit together produces grossed-up income of approximately $521.70 (roughly $522), for a grossed-up yield of approximately 6.5% on the original $8,000 investment.
| Metric | Verified Figure |
|---|---|
| Share price used | $35.01 |
| Shares purchased with $8,000 | ~228 |
| FY2027 forecast dividend per share | $1.60 (fully franked) |
| Estimated annual cash dividend | ~$365 |
| Forward cash dividend yield | ~4.6% |
| Estimated franking credit value | ~$157 |
| Estimated grossed-up income | ~$522 |
| Grossed-up yield | ~6.5% |
The $1.60 FY2027 dividend is a forecast. Actual dividends can be higher or lower depending on profitability, capital adequacy requirements, and board decisions.
“Australian bank dividends are not guaranteed. Westpac and its peers cut dividends materially during the COVID-19 period in 2020, a reminder that income forecasts are subject to earnings outcomes and regulatory capital requirements.”
The capital growth case and the income case are two different investment propositions from the same stock, and they point in different directions.
On the capital side, the consensus Sell rating and average price targets of approximately $33.38 to $33.75 imply roughly 5% downside from current levels near $35. At current prices and on current consensus estimates, Westpac does not screen as cheap. Investors seeking near-term price appreciation are likely better served elsewhere in the market.
On the income side, the numbers tell a different story. The FY2027 forecast dividend range of approximately $1.60 to $1.64 per share (with next-12-month estimates near $1.54) delivers a cash yield of approximately 4.6% and a grossed-up yield of approximately 6.5% for eligible investors. Westpac has a long history of fully franked dividend payments as one of Australia’s largest banks.
Westpac’s trailing yield climbed sharply as the share price pulled back from its April 2026 peak, a dynamic that illustrates how yield and price move in opposite directions and why the income case strengthens precisely when the capital growth case weakens.
The investor profiles these two cases serve are distinct:
For eligible investors, the approximately 6.5% grossed-up yield compares favourably to many fixed income alternatives, subject to the dividend forecast being realised. In this context, Westpac may function as a potentially suitable income component within a diversified portfolio rather than a standalone conviction position.
Portfolio diversification and individual financial advice remain important considerations. Overweighting any single bank stock introduces concentration risk that a higher yield alone does not compensate for.
The core tension remains: Westpac is a stock the broker community broadly views as fairly valued or overvalued on a capital basis, but one that offers a meaningful fully franked income stream for eligible Australian investors. Citi’s $37.50 target implies approximately 12% total return when combined with the dividend yield, while the consensus average of $33.38 to $33.75 points to mild downside.
Three variables matter most to the forward income case:
A rising grossed-up yield combined with a sell-heavy broker consensus is one of the classic setups for a dividend trap, where the income appeal masks underlying valuation risk or a potential future payout cut that the headline yield does not yet reflect.
For the broker consensus to shift materially, Westpac would likely need earnings upgrades that justify higher valuations, compression in the price-to-earnings multiple that makes the current price appear less stretched, or a more conservative dividend payout that revised the income thesis downward.
This article is for informational purposes only and should not be considered financial advice. Investors should conduct their own research and consult with financial professionals before making investment decisions. Past performance does not guarantee future results. Financial projections are subject to market conditions and various risk factors.
—
A grossed-up dividend yield adds the value of franking credits to the cash dividend before dividing by the share price, giving eligible Australian investors a more complete picture of the total income received. For Westpac, the FY2027 forecast cash yield of approximately 4.6% rises to approximately 6.5% once franking credits are included.
As of mid-June 2026, no analyst tracked across major consensus aggregators holds a buy rating on Westpac, with approximately five hold ratings and nine sell ratings recorded across 14 analysts, placing the overall consensus at Sell.
Citi rates Westpac as a neutral Hold with a $37.50 price target, which sits above the consensus average of approximately $33.38 to $33.75. When combined with the FY2027 forecast dividend yield of approximately 4.6%, the implied total return from the current price near $35 is approximately 11.6% to 12%, though both components carry forecast risk.
Retirees and superannuation funds in pension phase can receive franking credits as a cash refund from the ATO once their income tax and Medicare levy liabilities have been satisfied, making the grossed-up yield a tangible income outcome rather than a theoretical one for this investor group.
The FY2027 forecast dividend of $1.60 per share is not guaranteed and depends on Westpac's earnings outcomes, regulatory capital requirements, and board decisions. Westpac and other major Australian banks cut dividends materially during the COVID-19 period in 2020, illustrating that income forecasts can change significantly.