
After the Reserve Bank of Australia’s most aggressive tightening cycle in decades, ASX-listed real estate investment trusts are trading at discounts to net tangible assets not seen in the pre-2022 era. Whether those discounts represent genuine mispricing or rational anticipation of further writedowns is a question that a single metric cannot answer. The 2022-2025 rate cycle repriced the entire A-REIT sector through higher discount rates and expanding capitalisation rates, and with the RBA now well past its 4.35% peak, investors are reassessing listed property with renewed attention. This guide provides a five-test valuation framework, sector-by-sector conclusions, and a worked numerical example designed to move Australian investors from concept to concrete assessment of any individual A-REIT on their watchlist.
What the 2022-2025 rate cycle actually did to A-REIT prices
The repricing that swept through ASX-listed REITs between 2022 and 2025 operated through two channels simultaneously:
- Discount rate expansion: Higher interest rates increased the rate at which investors discounted future REIT cash flows, compressing valuation multiples across the sector regardless of underlying property fundamentals.
- Capitalisation rate expansion: Rising cap rates reduced the assessed value of physical property portfolios, eroding the net tangible assets sitting on REIT balance sheets.
Both channels fed on the same rate cycle. The RBA cash rate rose sharply during 2022-2023, reaching 4.35%, at a pace that left listed property securities absorbing valuation pressure from two directions at once. Unit prices fell as multiples compressed, and the book values those prices were being measured against also declined as independent valuers pushed cap rates higher.
The repricing operated through four distinct rate transmission channels simultaneously: the economic outlook signal, the discount rate applied to future cash flows, the cost of debt capital, and yield competition from government bonds, each of which amplified the others during the 2022-2023 tightening phase.
The result was widespread discounts to NTA across the A-REIT index. The question the rest of this guide answers is whether those discounts reflect genuine opportunity or simply the market pricing in writedowns the balance sheet has not yet recorded.
Where the sector stands heading into mid-2026
The macro backdrop has shifted. The RBA’s tightening cycle is past its peak, bond markets are stabilising, and falling bond yields, linked in part to potential US Federal Reserve rate reductions, have begun to widen the yield spread that makes REIT distributions comparatively attractive. Investment bank commentary has signalled that the period of strong Australian real estate growth may be concluding, but for listed property securities, the more relevant observation is that NTA discounts remain widespread at the index level while varying considerably by property sector.
When big ASX news breaks, our subscribers know first
Understanding NTA, cap rates, and yield spreads before you screen a single stock
Three metrics form the diagnostic system for A-REIT valuation, and they are connected rather than independent. Understanding how they interact is the precondition for applying the framework that follows.
Price-to-NTA is the starting point for most A-REIT valuation work. It compares the market price of a REIT’s units to the net tangible asset value reported on the balance sheet. A ratio below 1.0 means the market is pricing the REIT below the assessed value of its property portfolio, after accounting for debt. The core limitation is that reported NTA reflects valuations that may lag behind cap-rate movements already visible in transaction markets.
Yield spread is the gap between a REIT’s forward distribution yield and the 10-year government bond yield. This spread tells investors how much additional income a REIT offers above the risk-free rate, and it moves through three regimes:
The 10-year government bond yield is the correct benchmark for yield spread calculations because REIT valuations respond primarily to long-duration rate expectations, not to the short-term cash rate that the RBA directly controls, a distinction that explains why spread compression can persist even after the central bank begins cutting.
| Spread Range | Regime Label | Valuation Signal |
|---|---|---|
| Below 1.5 percentage points | Tight | REITs generally appear fully valued |
| 2-3 percentage points | Normal | In line with historical norms |
| Above 3-4 percentage points | Wide | Suggests potential undervaluation or elevated risk |
Cap rates link property income to capital value. When cap rates expand, the same rental income produces a lower property valuation, which in turn reduces NTA. This is why a cap-rate shock changes the book value against which any discount is being measured.
Reported NTA is a lagging indicator. Stress-tested NTA, calculated by applying a +50-100 basis point cap-rate shock to the reported portfolio valuation, is the more defensible anchor for valuation conclusions.
The five-test framework for determining whether an A-REIT is genuinely undervalued
Applying all five tests rather than relying on any single metric is what separates a disciplined valuation approach from a screen that mistakes compressed multiples for genuine opportunity. Each test builds on the last, and together they form a sequential checklist:
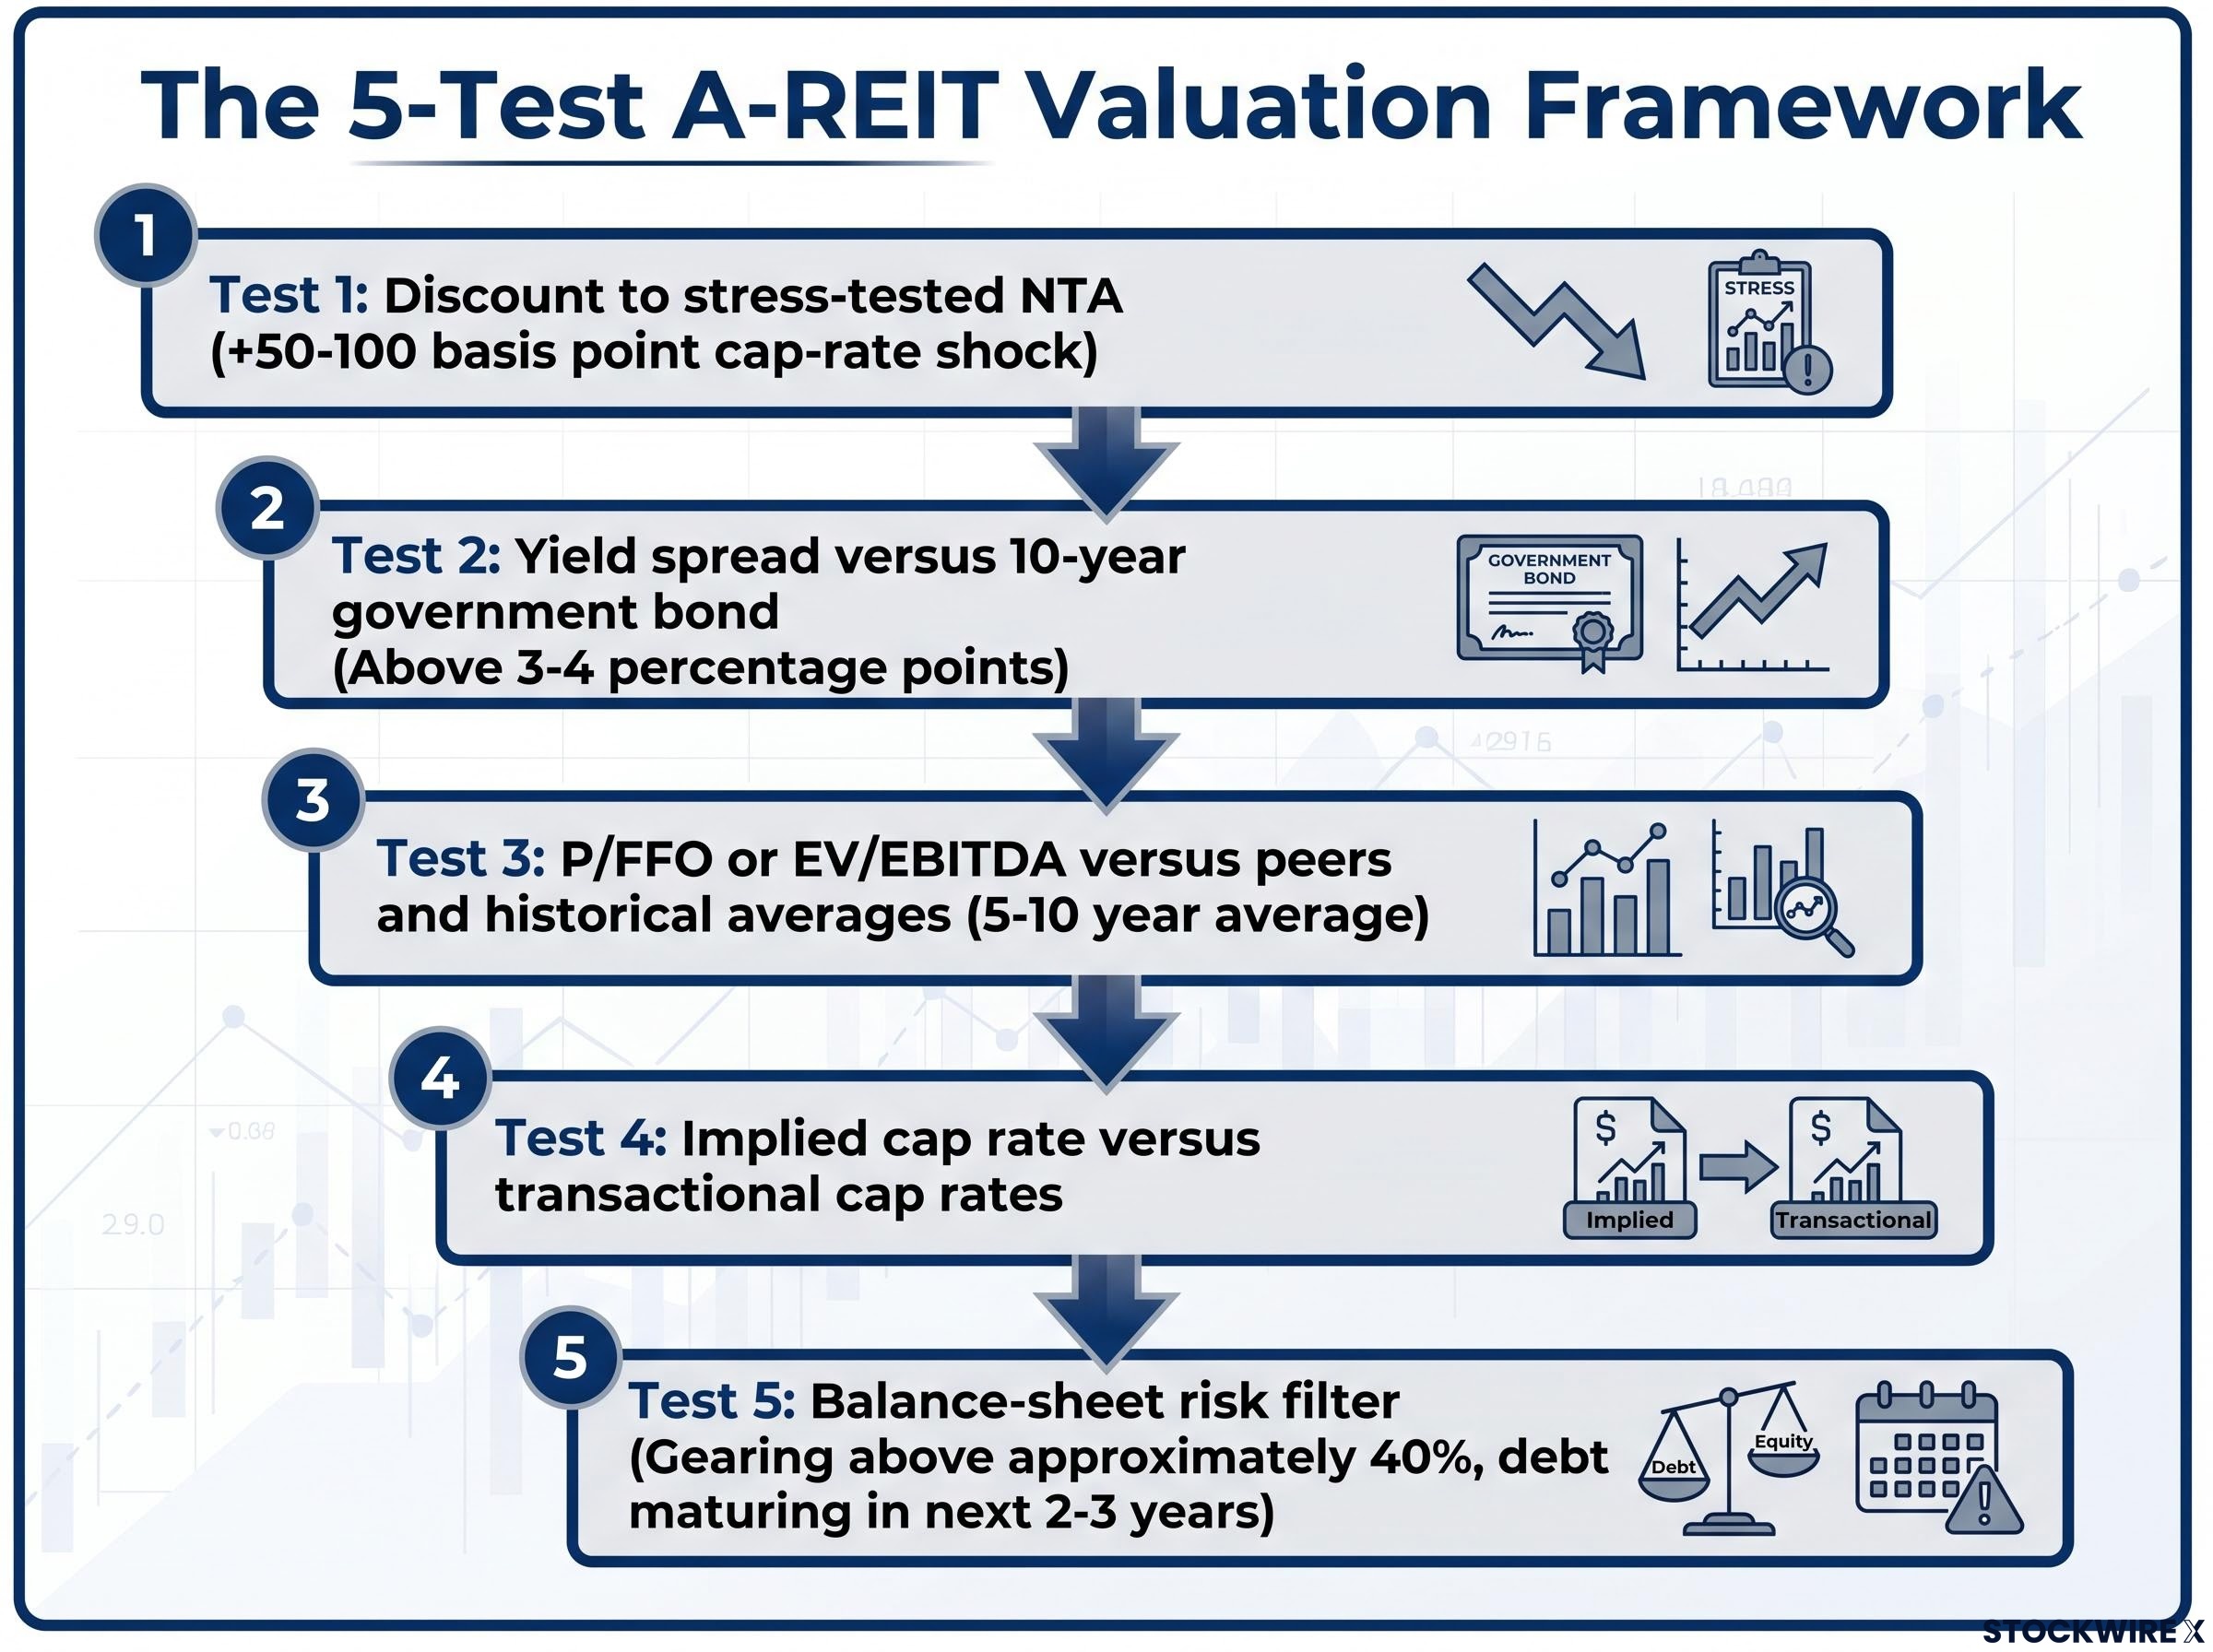
- Discount to stress-tested NTA: Revalue the portfolio using a +50-100 basis point cap-rate shock. If units still trade below the adjusted NTA, the discount is more defensible than one measured against reported book value alone.
- Yield spread versus 10-year government bond: A spread above 3-4 percentage points, combined with a distribution clearly covered by funds from operations (FFO), is a strong starting signal of potential undervaluation.
- P/FFO or EV/EBITDA versus peers and historical averages: Compare against the REIT’s own 5-10 year average multiple and its relevant peer group. Price-to-FFO, which measures price against actual operating earnings, is often more informative than Price-to-NTA where asset values are uncertain.
- Implied cap rate versus transactional cap rates: Calculate net property income divided by enterprise value and compare against recent comparable transaction evidence. A significantly higher implied cap rate suggests the listed vehicle is undervalued relative to direct property.
- Balance-sheet risk filter: Exclude or heavily discount REITs with look-through gearing above approximately 40% and near-dated debt maturities. Assess debt maturing in the next 2-3 years as a percentage of total debt.
A large NTA discount combined with only a modest P/FFO discount is a warning signal, not a buy signal. It typically means the earnings multiple is already pricing in writedowns the balance sheet has not yet recorded.
Why the balance-sheet filter comes first, not last
Test 5 functions as a gateway condition rather than a tiebreaker. Running the balance-sheet check before completing the valuation assessment prevents investors from building a conviction case on a REIT that may be forced into dilutive equity issuance or asset sales to meet refinancing obligations. The specific metric to monitor is the interest-coverage ratio (EBITDA divided by interest expense); deteriorating coverage signals vulnerability to distribution cuts that would undermine the yield spread signal from Test 2.
A depressed price on leverage above 40% with a near-term refinancing wall is a risk exposure, not a value opportunity.
Putting the framework to work with a hypothetical A-REIT
Consider a hypothetical A-REIT with the following reported characteristics: NTA of $3.00 per unit, a current market price of $2.25 (a 25% discount), an annual distribution of $0.18 per unit (an 8.0% yield), gearing of 32%, and a weighted average lease expiry (WALE) of 7 years. The 10-year government bond yield sits at 4.0%, producing a yield spread of 4.0 percentage points.
The headline discount looks compelling. The framework’s job is to test whether it holds up.
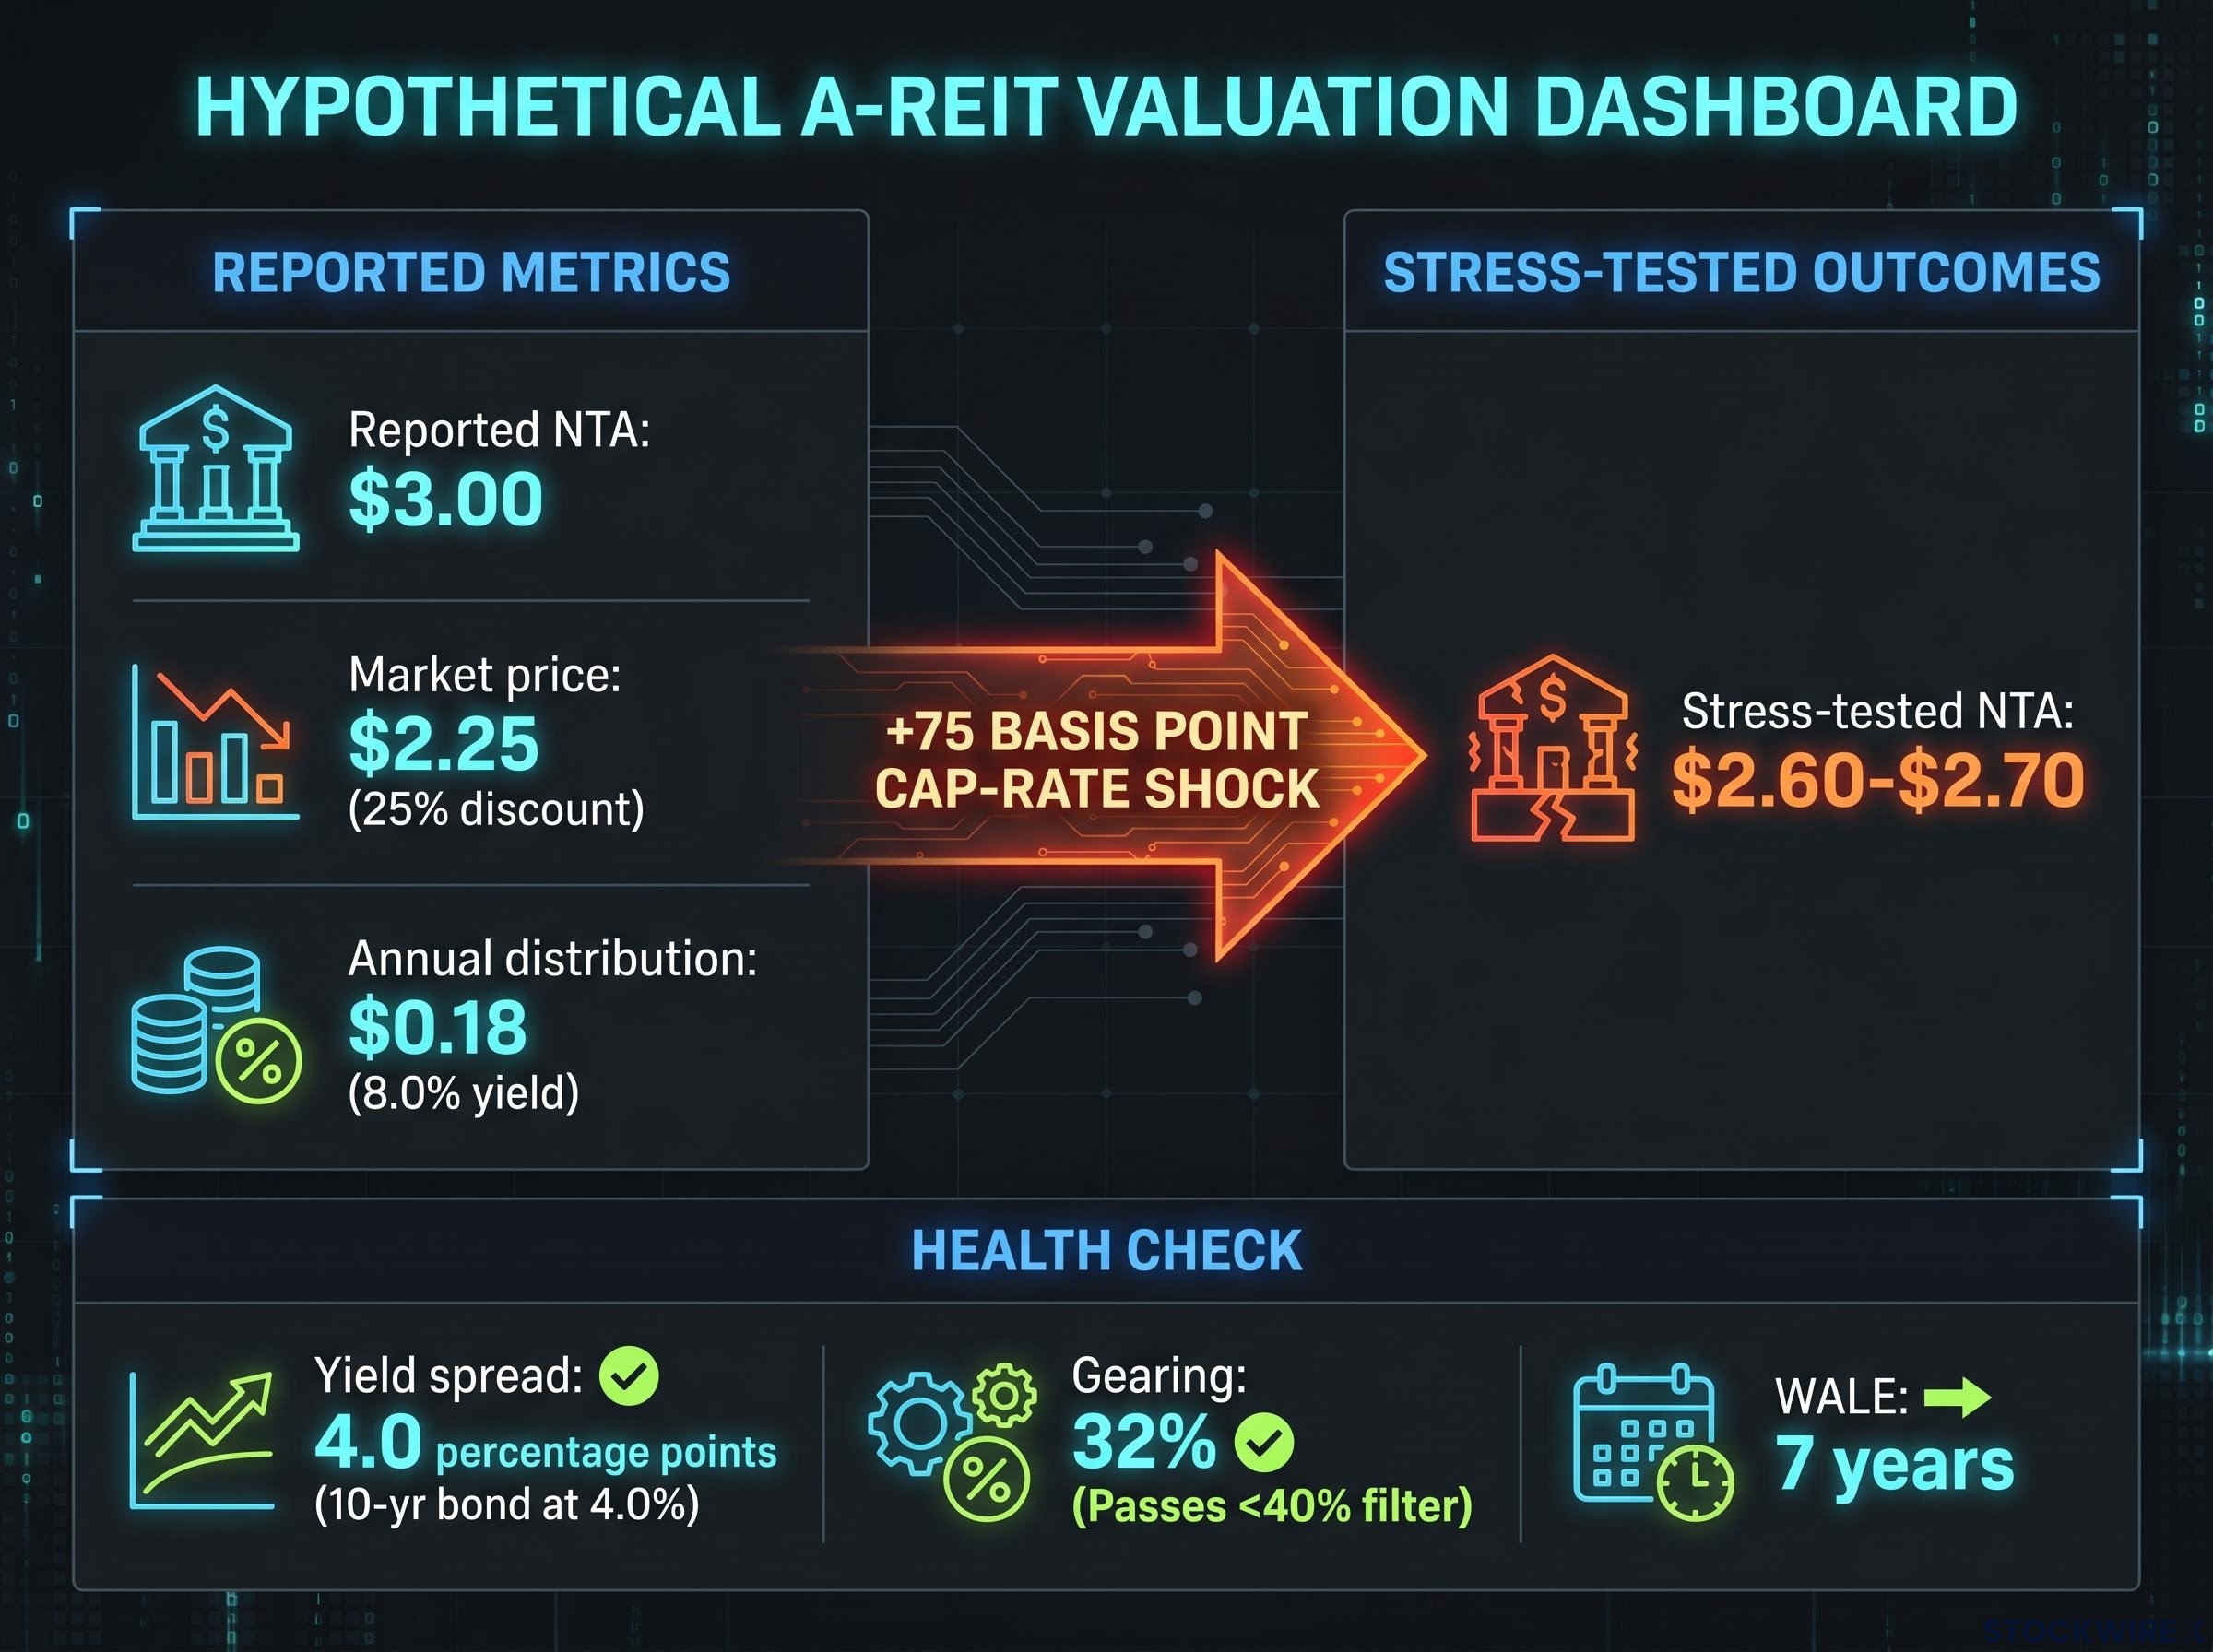
Test 1: Stress-tested NTA. Applying a +75 basis point cap-rate shock to the portfolio reduces the NTA from $3.00 to approximately $2.60-$2.70 per unit. At a market price of $2.25, the units still trade at a meaningful discount to the stress-tested figure. The value case survives the first gateway.
Test 2: Yield spread. A 4.0 percentage point spread falls into the “wide” regime, above the 3-4 percentage point threshold. If the $0.18 distribution is covered by FFO, this constitutes a strong starting signal.
Test 5: Balance-sheet filter. Gearing of 32% sits well inside the 40% threshold. A 7-year WALE limits near-term lease rollover risk. Subject to confirming the refinancing schedule, this REIT passes the balance-sheet filter.
| Test | Key Metric | Threshold | Result |
|---|---|---|---|
| Stress-tested NTA discount | Price vs. adjusted NTA ($2.25 vs. $2.60-$2.70) | Price below stress-tested NTA | Pass |
| Yield spread | 4.0 percentage points | Above 3-4 percentage points | Pass |
| Balance-sheet filter | 32% gearing, 7-year WALE | Gearing below 40%, no near-term refinancing cliff | Pass |
Provisional conclusion: This hypothetical REIT passes all three gateway conditions. It can reasonably be characterised as undervalued on a through-cycle basis, pending confirmation of FFO coverage and the refinancing profile. Tests 3 and 4 (P/FFO comparison and implied cap rate analysis) would further strengthen or moderate this conclusion.
How sector allocation shapes your valuation conclusions
Applying a uniform valuation lens across all A-REIT sub-sectors is one of the most common errors retail investors make. Each property sector carries different structural dynamics, and the five-test framework must be calibrated accordingly.
| Sub-sector | Key Characteristic | Valuation Stance | Primary Risk |
|---|---|---|---|
| Industrial | High occupancy, e-commerce tailwind, often long WALE | Core defensive at a reasonable price; unlikely deep value | Market already prices structural demand advantage |
| Convenience retail | Supermarket-anchored, non-discretionary tenants | NTA discounts with stable occupancy may signal genuine mispricing | Limited upside from re-rating; value is in yield stability |
| Discretionary retail malls | Sensitive to consumer spending cycles | Requires aggressive NTA stress testing before treating discounts as value | Rent pressure, higher leasing incentives, structural retail shifts |
| Office | Hybrid working impact, rising tenant retention costs | Discount may anticipate writedowns not yet recorded | Cap-rate expansion, structural demand decline, leasing incentive costs |
| Specialised/social infrastructure | Healthcare, childcare, data centres; less cyclical demand | May not screen as cheap; value is in long-duration inflation-linked leases | Higher starting valuations limit discount-based entry points |
Industrial REITs trading at modest NTA discounts but on yields comfortably above long bonds are better characterised as core holdings at reasonable prices. The structural demand story from e-commerce is well understood, limiting the probability of severe mispricing. Upside is more likely to come from distribution growth than from re-rating.
Convenience retail, anchored by supermarkets and non-discretionary tenants, demonstrated resilient sales and occupancy through the rate cycle. Where meaningful NTA discounts combine with stable occupancy metrics and a clean balance-sheet filter, the case for genuine mispricing carries more weight than in most other sub-sectors.
Convenience retail occupancy metrics from Scentre Group and Vicinity Centres, which reported 99.8% and 99.6% occupancy respectively alongside positive leasing spreads in early 2026, provide concrete transaction-level evidence for why the sector screening exercise described here carries more weight in non-discretionary retail than in most other A-REIT sub-sectors.
Office requires particular caution. Large NTA discounts in office should be treated as a starting point for analysis, not as evidence of value. Rising tenant retention costs, increasing leasing incentive requirements, ongoing cap-rate expansion, and structural shifts in space demand from hybrid working mean the discount in many cases is simply anticipating writedowns that have not yet been recorded.
The mistakes that turn genuine discounts into expensive lessons
Three analytical errors account for most of the damage when investors apply REIT valuation tools without discipline:
- Accepting reported NTA at face value without stress-testing cap-rate assumptions, leading to false confidence in the size of the discount.
- Treating a wide NTA discount in isolation without checking P/FFO for corroborating evidence, missing the signal that earnings multiples have already priced in the writedown.
- Building a conviction position without running the balance-sheet filter first, exposing the portfolio to a REIT that may be forced into dilutive equity issuance or asset sales.
The “cheap for a reason” diagnostic is straightforward in practice. If P/FFO is already at a modest discount while NTA shows a large gap, the market is telling investors the NTA will be written down rather than that the stock is cheap. The cap-rate stress test standard, applying a +50-100 basis point shock before treating any NTA discount as real, exists to catch precisely this error.
Office requires more conservative stress-test assumptions than any other A-REIT sub-sector, given the structural shifts in space demand that extend beyond the rate cycle.
When a qualitative overlay overrides a clean valuation screen
Even a REIT or property security that passes all five quantitative tests requires a qualitative check. Structural demand risks, business model disruption, and management track record all sit outside the framework’s numerical boundaries. REA Group was highlighted in April 2024 market commentary as potentially undervalued following a significant share price correction, but artificial intelligence-related risks to its business model were noted as a material caveat. A pure quantitative screen would have missed that overlay entirely.
What a genuine value opportunity in A-REITs actually looks like in 2026
The “all-conditions-met” case in the current environment requires three gateway conditions to be satisfied simultaneously:
- Material discount to stress-tested NTA: The market price sits below the NTA recalculated after a +50-100 basis point cap-rate shock, confirming the discount survives conservative assumptions.
- Historically wide yield spread with clean coverage: The forward distribution yield exceeds the 10-year government bond yield by more than 3-4 percentage points, and the distribution is clearly covered by FFO.
- Conservative gearing with no refinancing cliff: Look-through gearing sits below 40%, and no large tranche of debt matures in the near term at materially higher refinancing rates.
The balance of evidence from the 2022-2025 repricing cycle points to selective sub-sectors rather than the index as a whole. Industrial, convenience retail, and some specialised infrastructure REITs are more likely to present conditions where all three gateways can be passed. Office and discretionary retail require substantially more conservative assumptions before the same conclusion can be reached.
Investors wanting to model the after-tax return implications of A-REIT allocations in the current environment should consult our full explainer on Australia’s CGT overhaul, which covers the removal of the 50% discount from 1 July 2027, the introduction of inflation-indexed cost bases, and the expected sectoral rotation toward fully franked income assets including A-REITs.
This framework is educational and does not constitute personal financial advice. All investment decisions should involve independent due diligence and, where appropriate, consultation with a licensed Australian financial adviser. Past performance does not guarantee future results, and financial projections are subject to market conditions and various risk factors.