Why 2026 Market Volatility Feels Worse Than the Data Shows
23 mins ago

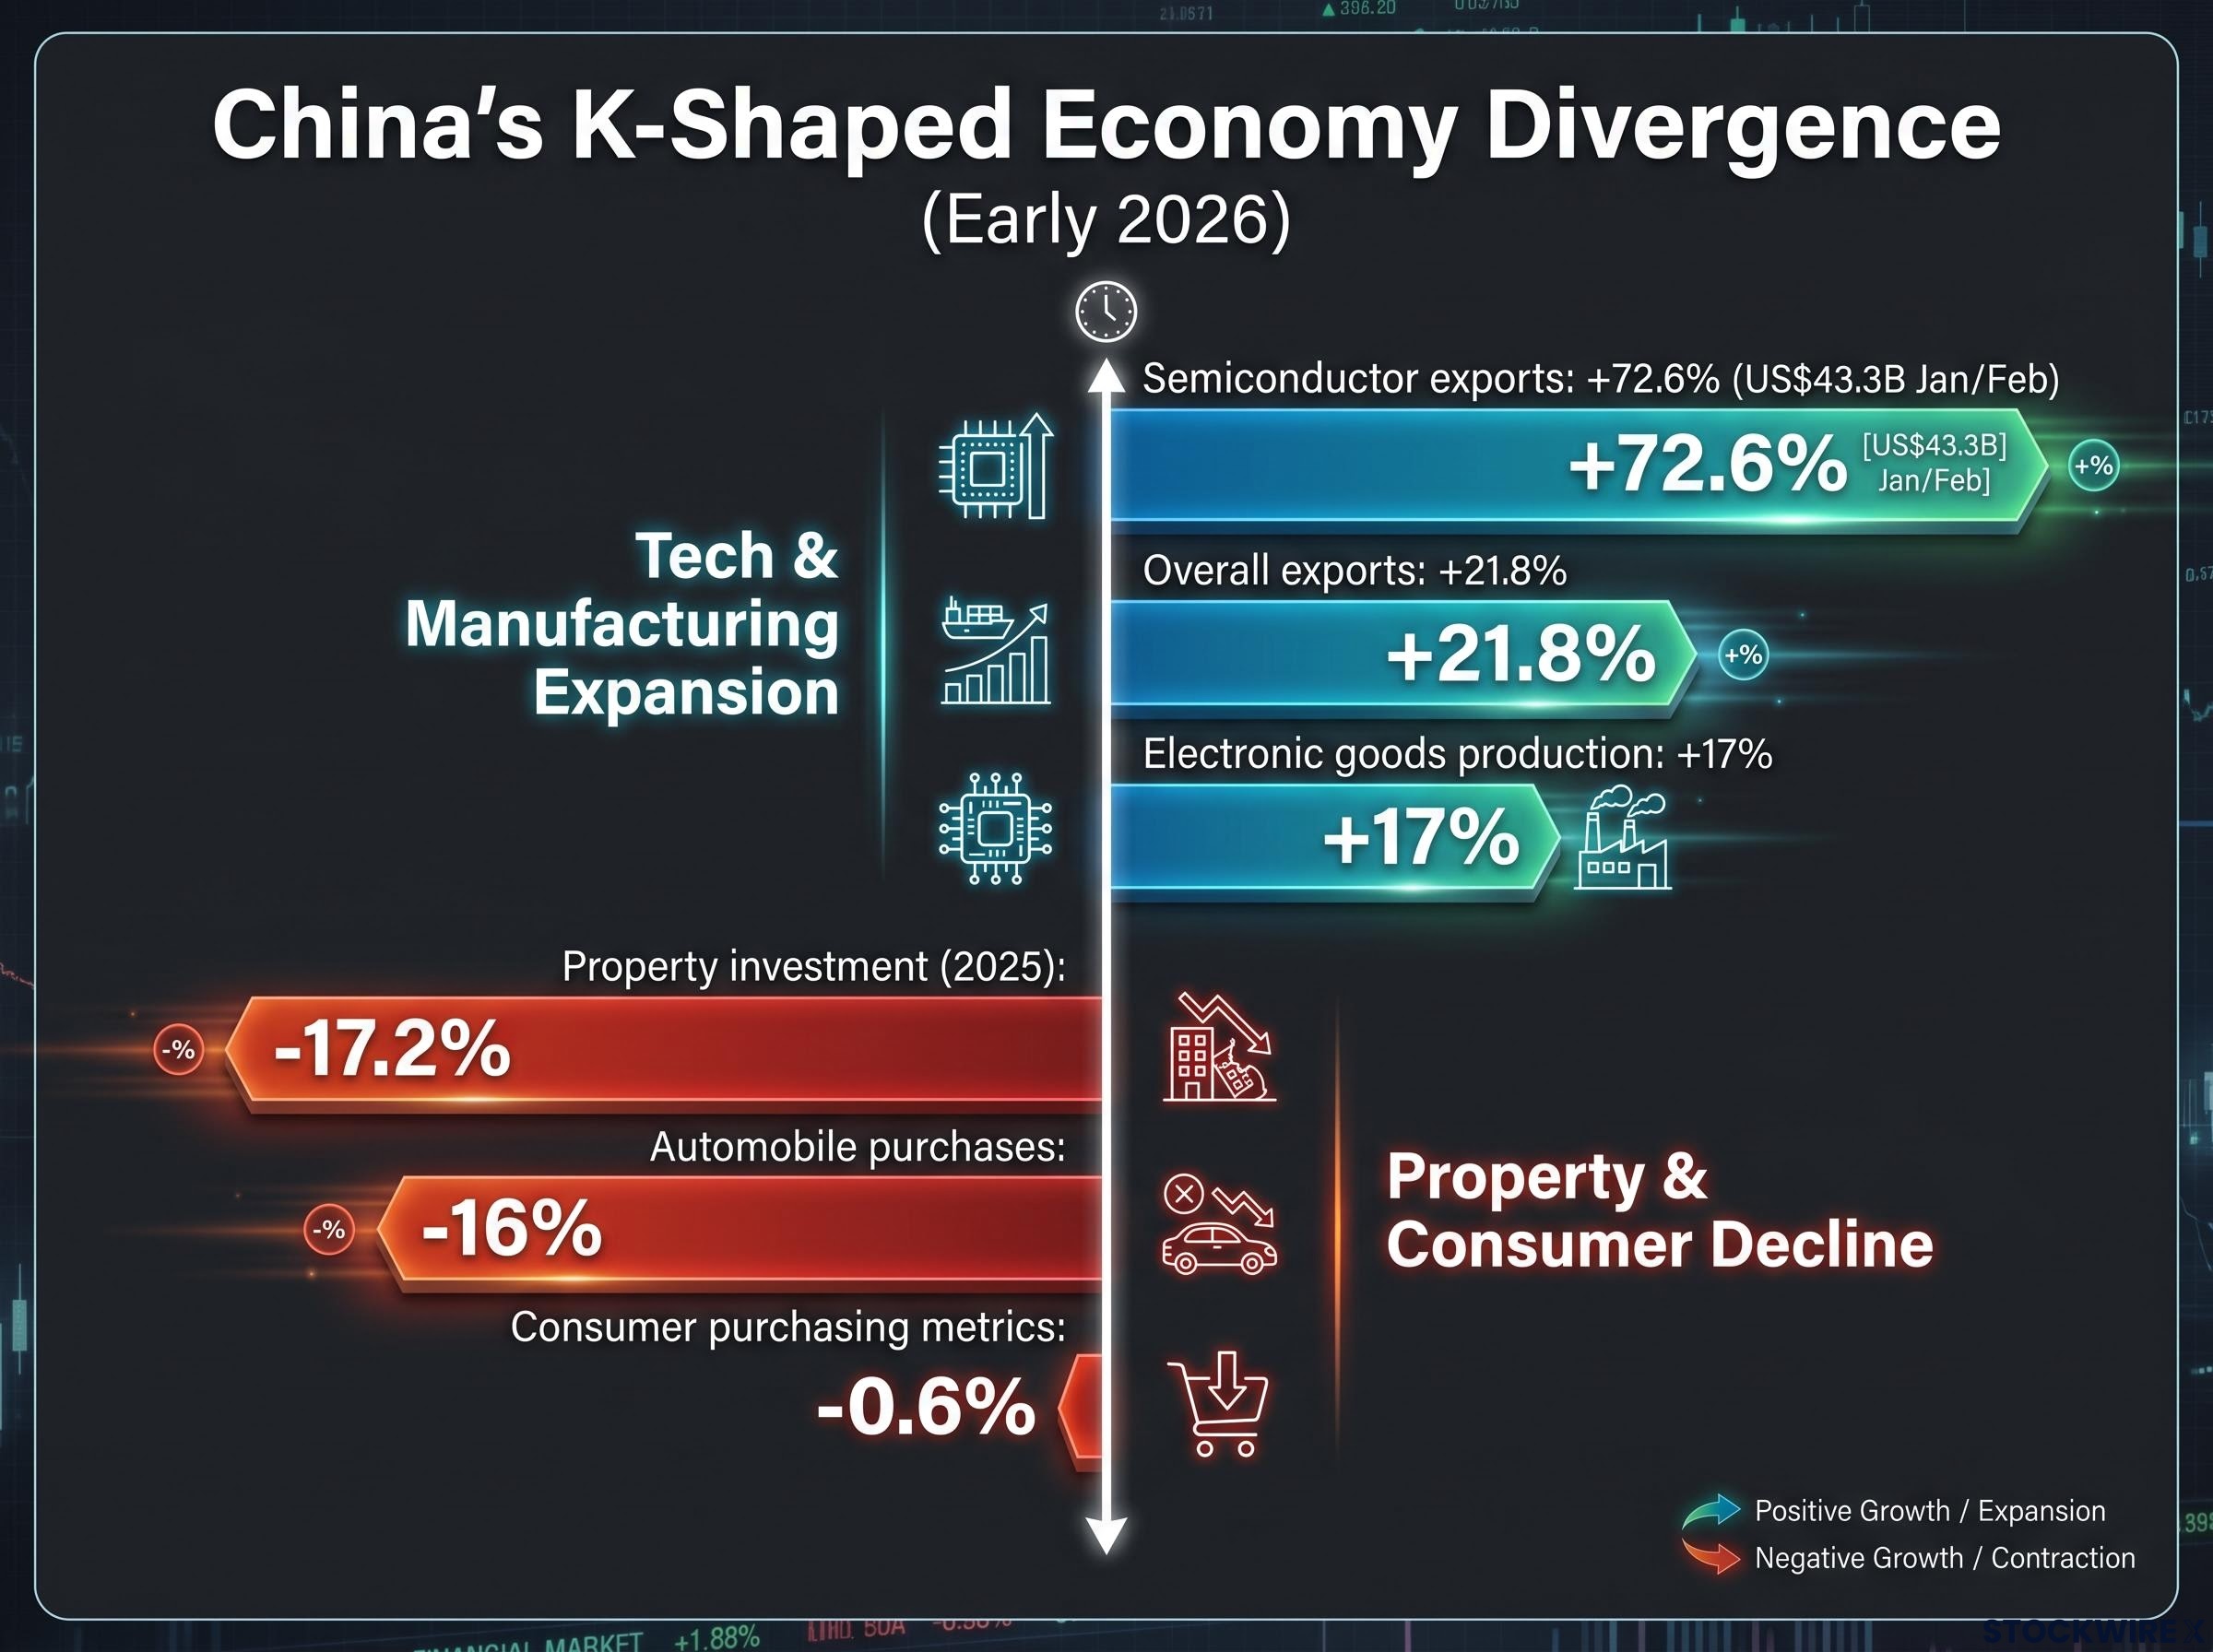
Evaluating the China economy outlook in early 2026 requires reconciling completely opposite trajectories within a single quarter. The nation posted acceptable headline GDP, while semiconductor exports surged more than 70% year-on-year and property investment collapsed 17.2% in the prior year. This K-shaped divergence is now entering its sixth consecutive year and has transitioned from a temporary imbalance into a structural condition.
Institutions including Citi and Bloomberg Economics explicitly frame this as a two-speed split rather than a transitional phase. Treating Chinese equities as a single macro exposure is no longer analytically defensible for capital allocators.
Investors require a clear framework for decomposing this market into two structurally distinct investment buckets. Each track carries separate drivers, policy sensitivities, and time horizons backed by institutional data.
The apparent contradiction between strong industrial output and collapsing domestic demand resolves when viewed through a K-shaped analytical lens. Acceptable headline GDP masks enormous sectoral variance, leaving property and export manufacturing on completely divergent paths. Variance at the sectoral level is far greater than variance at the broader macroeconomic level.
This dispersion creates systematic mispricing risks for investors who benchmark against aggregate national data. A single macroeconomic print can simultaneously present bullish signals for exporters and materially negative implications for consumer exposure.
Cross-economy growth divergences are emerging as the defining macro feature of 2026 broadly, with the UK posting a Q1 beat while the eurozone staggers at 0.1% quarter-on-quarter growth; China’s split between its export engine and domestic demand weakness sits within a wider global pattern of simultaneous acceleration and deceleration across major economies.
“The Chinese economy exhibits clear strength on the supply side alongside persistent weakness on the demand side.”
The divergence between the two tracks appears across key early 2026 metrics:
Manufacturing output expanded to 4.5%, supported by advanced manufacturing rising 15% and electronic goods production jumping 17%. Property investment declined 17.2% in 2025. New-home prices fell approximately 2.7% year-on-year across late 2025 and early 2026. Consumer purchasing metrics fell 0.6% year-on-year, marking the first negative reading since pandemic restrictions ended.
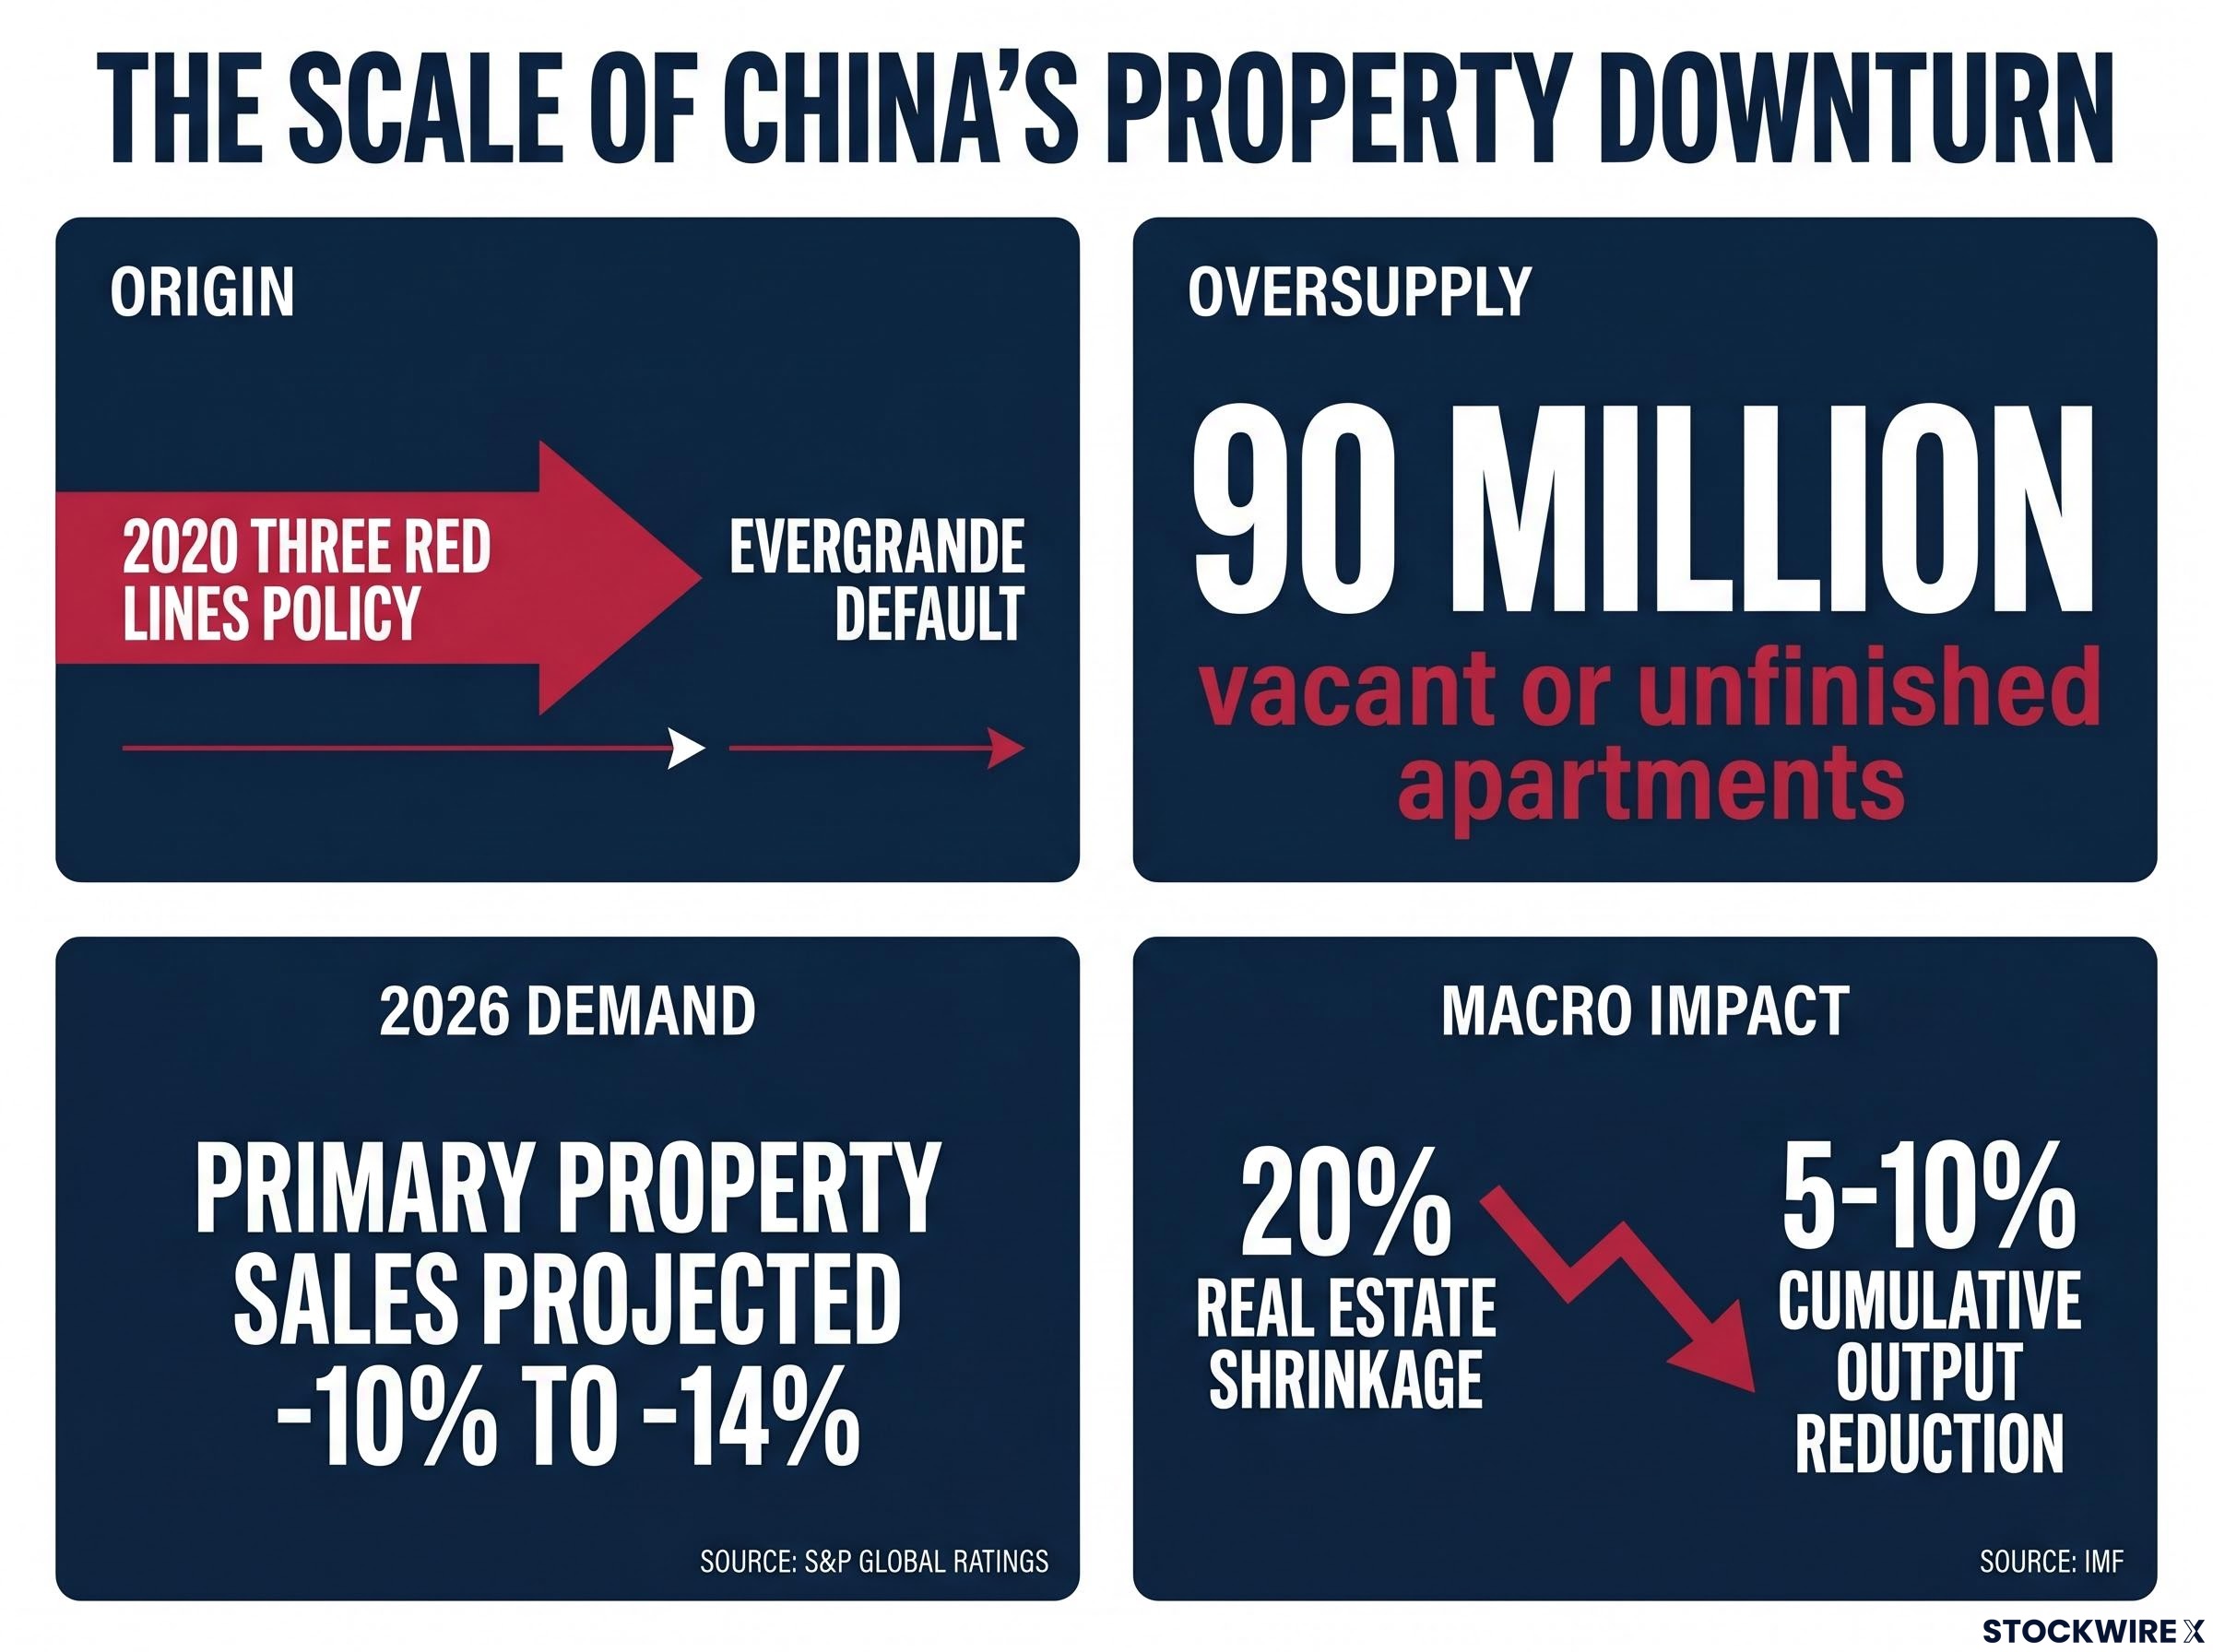
The structural catalyst for the current property downturn was the implementation of the Three Red Lines policy in 2020. This regulatory intervention limited leverage and liquidity, effectively breaking the developer credit model and distinguishing this period from a typical cyclical correction. The abrupt credit cutoff triggered widespread developer defaults, with Evergrande serving as the most visible example.
The Three Red Lines policy criteria established specific thresholds for developer liability-to-asset ratios, net debt-to-equity ratios, and cash-to-short-term debt coverage, with any breach restricting the pace at which a developer could grow its total debt load.
Because housing functions as the dominant asset class for Chinese citizens, falling prices over multiple years amplify the downward wealth effect. The transmission mechanism moves directly from structural developer distress to household balance sheets. Estimates indicate approximately 90 million vacant or unfinished apartments currently exist, with oversupply particularly severe in smaller municipalities.
| Metric | Figure | Period | Significance |
|---|---|---|---|
| New residential prices (70 cities) | -0.20% month-on-month | Early 2026 | Ongoing primary market deflation |
| Primary property sales | -10% to -14% projected | 2026 full year | S&P Global Ratings demand forecast |
| Automobile purchases | -16% | Measured period | Discretionary spending contraction |
| Property sector equities | -13% year-to-date | Mid 2026 | Reversal of autumn 2024 gains |
Repeated policy interventions have consistently produced short-lived optimism rather than a self-sustaining recovery. The central government has opted for a partial approach to loss socialisation. The People’s Bank of China (PBoC) remains cautious about further easing due to weak credit demand.
This pattern signals a grinding, multi-year adjustment. Long-term asset investment fell 4.1% year-on-year across the initial five months of the measured period. International Monetary Fund (IMF) modelling indicates a 20% real estate sector shrinkage could reduce cumulative output by 5-10% over several years.
The semiconductor and advanced manufacturing expansion represents a policy-driven and globally demand-driven reality, not a temporary statistical anomaly. Beijing deliberately redirected state support from property toward chips, electric vehicles, batteries, and artificial intelligence infrastructure. This shift reverses the capital allocation model that dominated before the Three Red Lines era.
Semiconductor exports surged 72.6% year-on-year to reach US$43.3 billion in January and February 2026.
While specific measurement windows vary, the directional momentum remains clear. Original Bloomberg data records a 111% annual increase in chip shipments, and overall exports grew approximately 21.8% in early 2026. High-tech segments consistently outperform traditional industrial goods, driving a visible capital rotation toward advanced enterprises.
Three reinforcing factors compound the growth in this sector:
Physical AI deployment through China’s approximate 2 million industrial robots represents a Bucket B dimension that semiconductor export metrics alone do not capture; domestic robot manufacturer share of installations rose from 30% to 57% between 2020 and 2024, insulating this growth vector from the same export control pressures that constrain chip shipment data.
The advanced manufacturing expansion offers clearer near-term earnings visibility than domestic consumer equities. Its growth relies on global market share gains rather than a local property wealth recovery.
Analysing exposure requires investors to ask which specific segment of the market they actually hold, rather than making a directional call on the entire country. The market decomposes into the domestic property-consumption complex (Bucket A) and the technology export and advanced manufacturing complex (Bucket B). Non-government investment across the broader economy fell 7.1% year-on-year in early 2026, illustrating the deterioration concentrated in the first bucket.
Bucket A encompasses developers, banks with large mortgage books, and consumer discretionary sectors like autos, appliances, and higher-end retail. Bucket B contains semiconductor manufacturers, artificial intelligence infrastructure hardware, advanced machinery, and renewable equipment producers.
Sizing exposure without this decomposition means allocators may believe they hold a GDP-growth proxy while actually holding concentrated property risk. Beijing actively backs strategic industries while allowing developers and local governments to bear adjustment costs. For global investors, the rational move often involves rebalancing toward the technology complex while explicitly pricing in trade-policy risk premia.
| Dimension | Bucket A: Property-Consumption | Bucket B: Tech-Export |
|---|---|---|
| Growth Trajectory | Structural multi-year decline | High-volume export expansion |
| Policy Stance | Managed adjustment, partial support | Aggressive state subsidy backing |
| Primary Risk | Demand contraction, wealth destruction | Geopolitical tariffs, overcapacity |
| Earnings Visibility | Low, dependent on sentiment | High, tied to global market share |
| Investor Framing | Distress trade or long-horizon workout | Growth play with trade-policy premium |
A K-shaped economy pattern occurs when one track accelerates while another decelerates, with minimal near-term convergence between the two. This divergence produces a misleading headline aggregate that fails to represent either reality accurately.
Institutional research teams at Citi and Bloomberg Economics formally adopt the K-shaped framing to explain current market conditions.
The accessible entry-level evidence for this pattern is the contrast between overall export growth of 21.8% and the consumer purchasing metric decline of 0.6%. At the quantitative extremes, the IMF projects a multi-year output drag from real estate, acting as the downward leg. Simultaneously, the semiconductor export surge forms the upward leg.
Three conditions sustain a K-shaped divergence rather than a temporary disparity:
Clear policy intentionality that prioritises one sector over another. A structural overcorrection required in the downward sector. * External demand insulating the upward sector from domestic weakness.
Understanding this framework enables investors to interrogate macro headlines by asking which leg of the K a specific data point belongs to. This prevents the common analytical error of treating a positive industrial print as evidence of a consumption recovery. The divergence is durable because property adjustment involves multi-year demographic factors, while technology expansion relies on long-run industrial policy.
The two economic tracks are not fully insulated from each other, presenting a clear spillback risk from domestic weakness to the export engine. However, institutional base cases project that divergence will persist in the near to medium term.
Two specific spillback channels threaten to bridge the gap between the tracks:
Despite these risks, a transmission failure prevents technology and export profits from flowing through to household consumption. Resolving this structural dynamic would require large-scale interventions that are not currently central to the policy agenda.
US-China trade deal outcomes from the May 2026 Beijing summit created an initial market signal of de-escalation, but Beijing’s official confirmations were limited to tariffs, agricultural purchases, and aircraft procurement, leaving AI chip controls, Taiwan policy, and semiconductor supply chain restrictions entirely unresolved and the trade-policy risk premium on Bucket B holdings intact.
Three conditions would need to be met for the K-shape to converge:
Large-scale direct financial transfers to households. An aggressive and complete cleanup of developer balance sheets. * Sustained wage growth and labour bargaining power improvements.
According to the Citi 2026 Outlook and Bloomberg Economics, no rapid convergence is expected through the year. Investors must determine whether their timeline aligns with a mean-reversion thesis on consumer names, or if geopolitical pricing on technology holdings represents a shorter-term constraint.
Global investors must audit which specific bucket they hold and verify that their thesis matches the underlying structural characteristics. The K-shaped split represents the base case through 2026 and likely beyond. Portfolio construction should reflect this structural divergence rather than anticipate a rapid unification of the domestic and export tracks.
Rotating toward Bucket B is a risk-recomposition move, not a risk-off strategy. The technology and export complex carries distinct challenges, with overcapacity already visible in electric vehicles, solar equipment, and specific chip categories. Investment flows are visibly moving toward artificial intelligence enterprises and away from traditional industrial names, confirming this market repricing.
Treating China tech upside as a call option on geopolitical resolution rather than a base-case revenue driver is the institutional framing adopted by BlackRock, Goldman Sachs, and Vanguard, a posture directly consistent with the trade-policy risk premium that any Bucket B allocation must now price into valuation models.
Investors should evaluate their current holdings by asking several diagnostic questions:
Which structural bucket does this specific equity belong to? Does the holding require a distress-trade thesis or a growth-premium thesis? Are the specific sectoral risks appropriately priced into current valuations? What risk premium compensates for the geopolitical exposure in advanced manufacturing names?
This article is for informational purposes only and should not be considered financial advice. Investors should conduct their own research and consult with financial professionals before making investment decisions. Past performance does not guarantee future results. Financial projections are subject to market conditions and various risk factors.
A K-shaped economy occurs when one sector accelerates while another decelerates simultaneously, producing a misleading headline aggregate. In China, semiconductor and advanced manufacturing exports are surging over 70% year-on-year while property investment and consumer spending are contracting, creating two structurally distinct economic tracks.
The Three Red Lines policy introduced in 2020 restricted developer leverage and liquidity, breaking the credit model that underpinned property expansion and triggering widespread developer defaults including Evergrande. This structural intervention, combined with an estimated 90 million vacant or unfinished apartments, distinguishes the current downturn from a typical cyclical correction.
Investors should identify whether each holding belongs to Bucket A (property developers, mortgage-heavy banks, consumer discretionary) or Bucket B (semiconductor manufacturers, AI hardware, advanced machinery, renewable equipment). Bucket A faces structural multi-year decline while Bucket B benefits from aggressive state subsidies and strong non-Western export demand.
The primary risks for China's technology and export complex include geopolitical tariffs, visible overcapacity in electric vehicles, solar equipment and certain chip categories, and unresolved US export controls on AI chips and semiconductor supply chains that keep a trade-policy risk premium on Bucket B holdings.
Citi and Bloomberg Economics project no rapid convergence through 2026, with resolution requiring large-scale direct household transfers, a complete cleanup of developer balance sheets, and sustained wage growth, none of which are currently central to Beijing's policy agenda.