
How to Prepare Your Portfolio for a Financial Crisis
46 mins ago

Most dividend investors sort by yield and stop there. It is a reasonable instinct and a reliable way to end up holding stocks that cut their payouts at the worst possible moment. A high dividend yield can reflect a depressed share price, an overstretched payout ratio, or a business in structural decline, and a simple descending sort on yield surfaces all three risks before it surfaces a single genuinely attractive compounder.
Building a resilient, income-generating portfolio requires something more repeatable: a screening process that evaluates what companies actually return to shareholders, whether the underlying financials can sustain that return, and whether the entry price leaves room for long-term gains. What follows is a four-pillar framework for screening dividend stocks, moving from total shareholder yield to financial statement scoring to dividend quality verification to valuation discipline. Each stage uses Cintas Corporation (CTAS) as a concrete illustration, and the full workflow collapses into a five-step sequence that can be applied to any new candidate.
Open any stock screener, sort by highest dividend yield, and the top of the list is almost certainly populated by the riskiest names in the market. That is not a coincidence. Yield rises mechanically when a share price falls, so a company whose stock has dropped 40% on deteriorating fundamentals will suddenly display an eye-catching yield, even if a dividend cut is weeks away.
Sorting by yield and stopping there is not merely a shortcut; it reflects a deeper set of dividend mechanics and yield misconceptions that cost investors real returns, including the often-overlooked fact that a share price falls by approximately the amount of each payout on the ex-dividend date, leaving total wealth unchanged at the moment of distribution.
The corrective is total shareholder yield, a broader measure of capital returned to shareholders across all channels, not just dividends.
The Hartford Funds dividend quintile analysis found that stocks in the highest yield quintile have historically underperformed those in the second quintile, a counterintuitive result that reinforces why sorting by headline yield and stopping there is the wrong starting point for building a durable income portfolio.
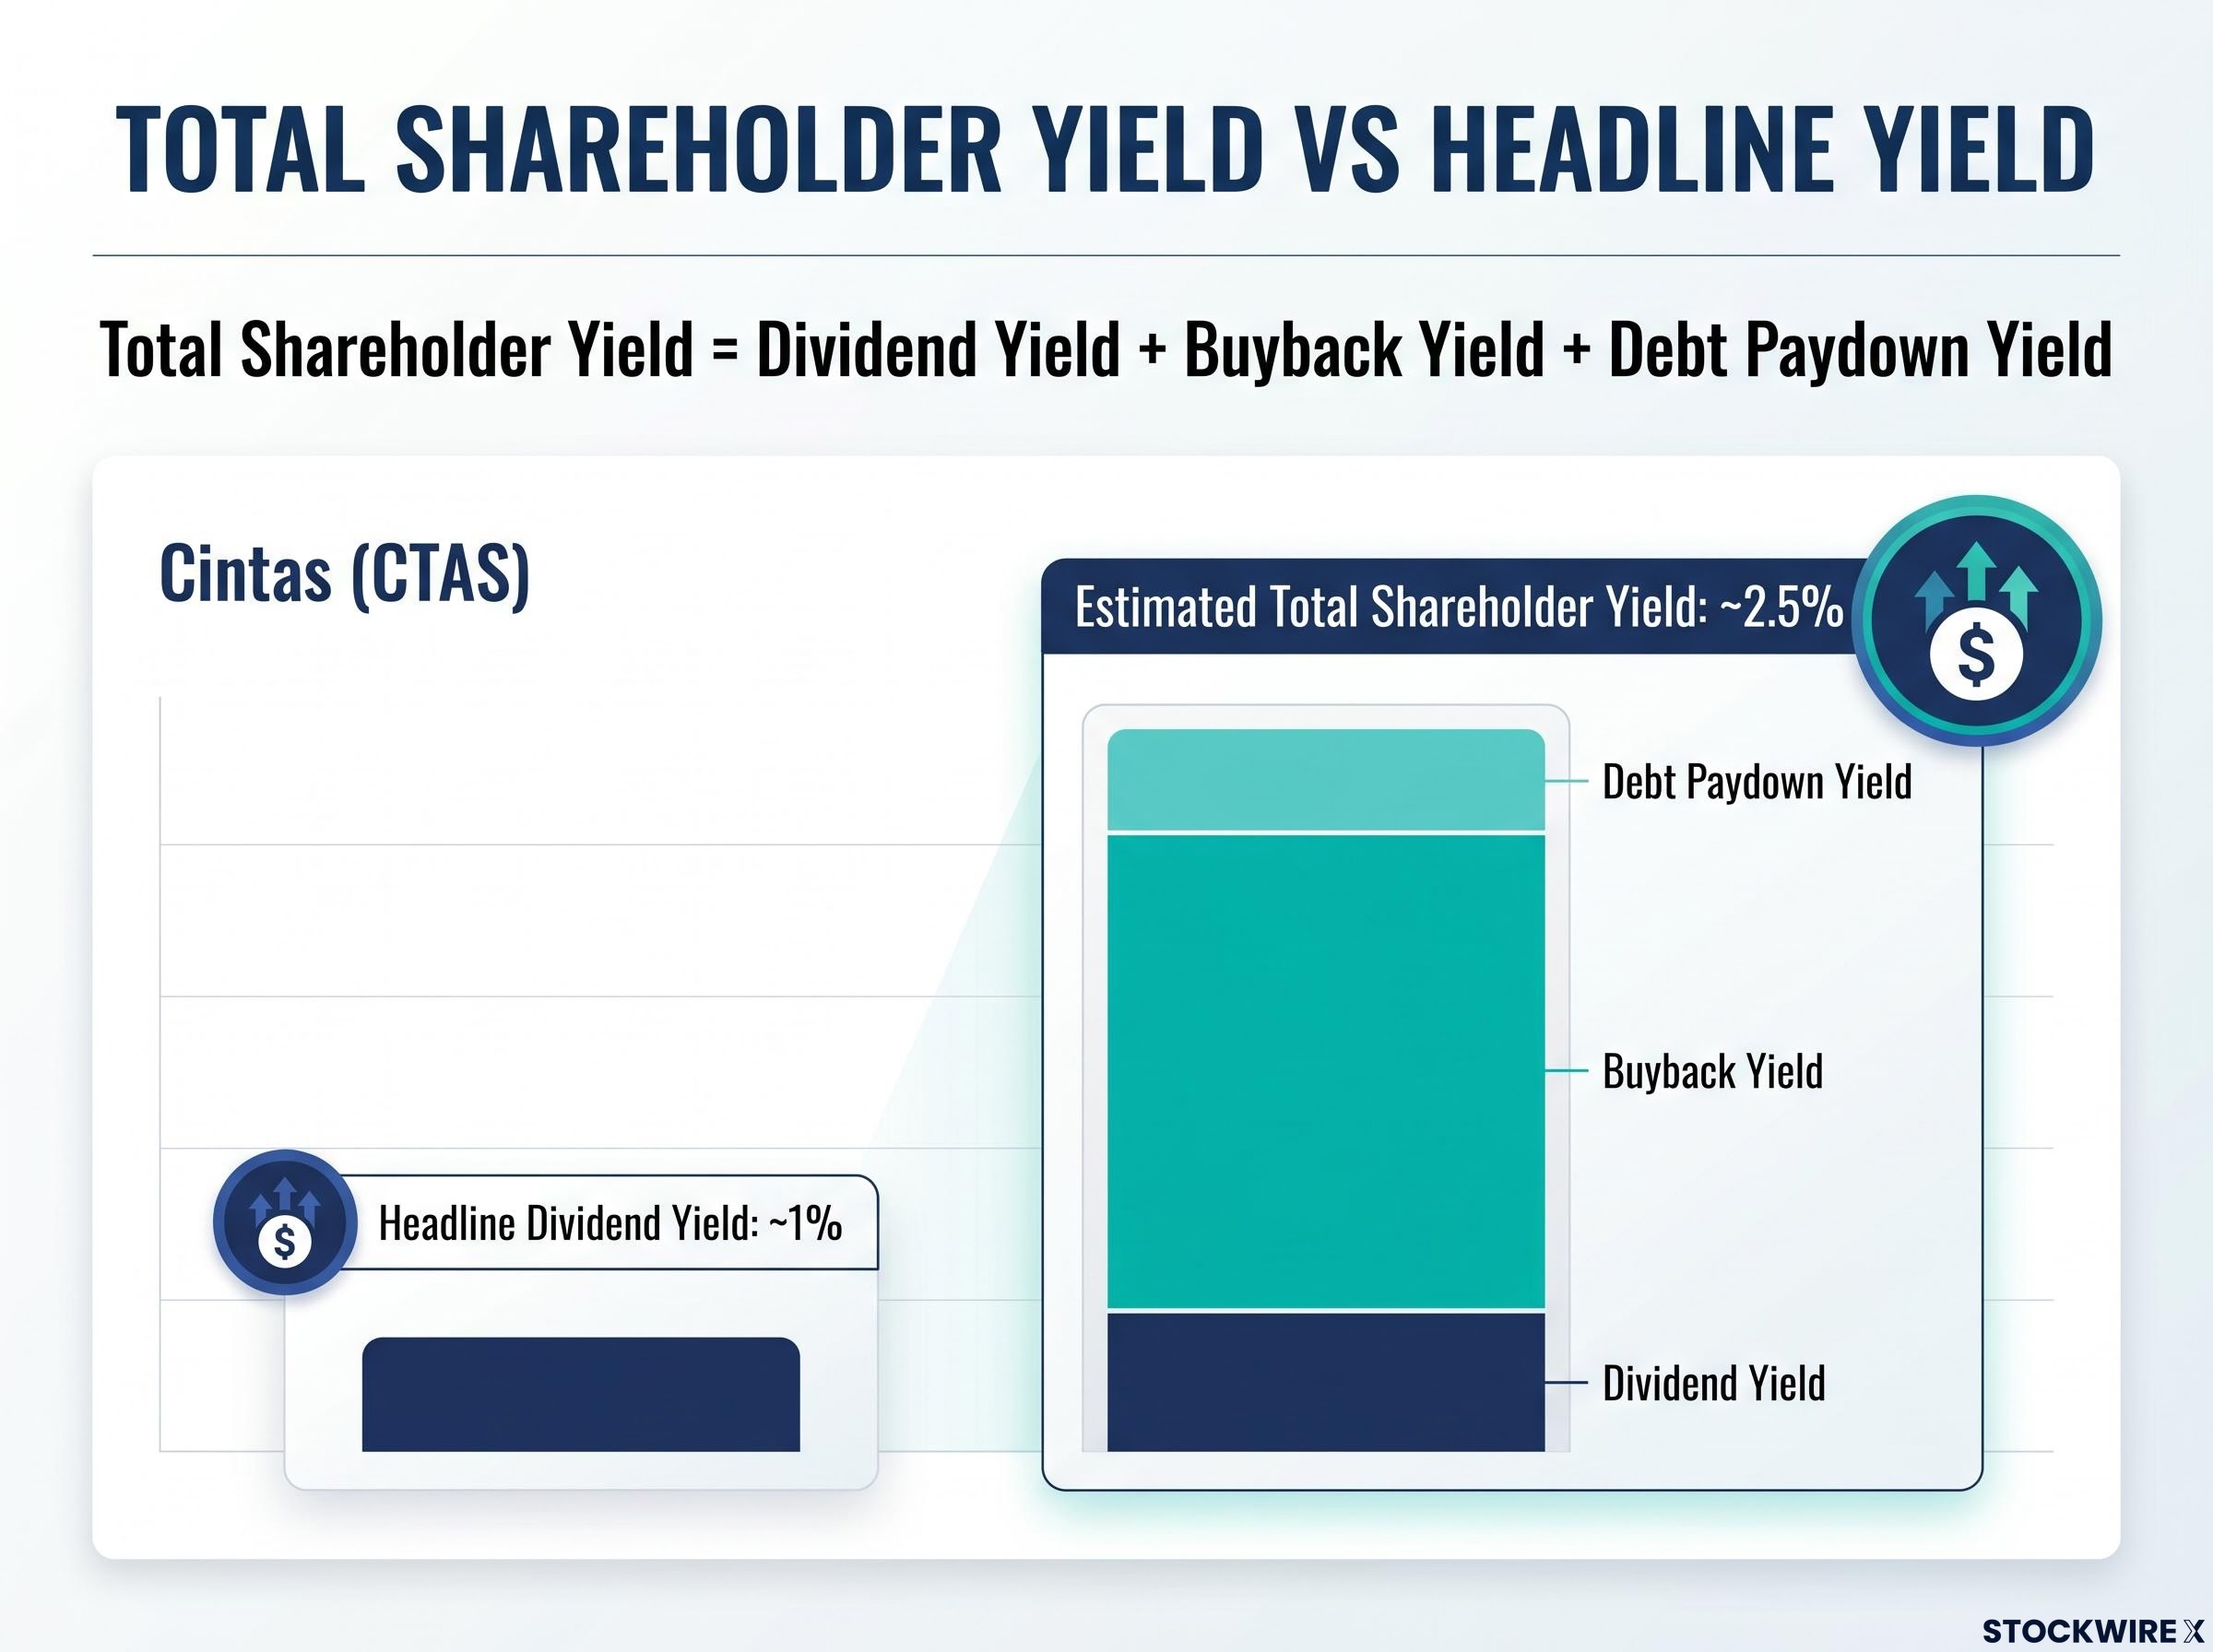
Total shareholder yield = dividend yield + buyback yield + debt paydown yield.
The three components work as follows:
Cintas illustrates the gap between headline yield and reality. Its dividend yield sits at approximately 1%, a figure that might cause yield-focused screeners to skip it entirely. Factor in buybacks and debt activity, and the estimated total shareholder yield rises to roughly 2.5%. The headline number understates the full capital return picture by more than half.
Total shareholder yield identifies candidates worth investigating. The next step is to determine whether the underlying business can sustain those returns. A 1-to-3 scoring system applied consistently across the income statement, balance sheet, and cash flow statement keeps this evaluation objective and efficient.
The scoring scale is straightforward: 1 equals weak, 2 equals acceptable, 3 equals strong. Any candidate scoring 1 in any single category is eliminated immediately. The goal is not to spend hours on every name; it is to disqualify weak candidates quickly and concentrate research time on profiles scoring 2 or 3 across the board.
| Category | Key metrics assessed | Score of 1 (eliminate) | Score of 3 (strong) |
|---|---|---|---|
| Income statement | Revenue CAGR, EPS growth, margin trajectory, earnings quality | Flat or declining revenue, shrinking margins, persistent earnings/cash flow gaps | Multi-year revenue and EPS growth, stable or rising margins, clean earnings quality |
| Balance sheet | Net debt/EBITDA, debt/equity, current ratio, interest coverage | Excessive leverage, weak liquidity, eroding shareholder equity | Manageable leverage, ample liquidity, growing equity through cycles |
| Cash flow | OCF consistency, capex relative to OCF, FCF payout ratio | Negative or volatile OCF, dividends exceeding FCF persistently | Healthy FCF with dividends clearly covered by cash generation |
Cintas scored 3 of 3 on the income statement, 3 of 3 on the balance sheet, and 2 of 3 on cash flow. That cash flow score, acceptable but not perfect, is precisely the kind of nuanced signal this system is designed to surface. Most screeners, including Koyfin, Finviz, Zacks, and DivvyDiary, expose the underlying data points needed to populate this framework.
The scoring table provides structure. The next step is knowing what to look for inside each statement so the scores reflect genuine analysis rather than guesswork.
Cintas demonstrates this profile clearly: highly durable revenue and net income growth, rising consistently over multiple years with no evidence of earnings manipulation.
A 3-of-3 balance sheet profile gives management the room to maintain and grow dividends through full economic cycles.
This is where dividend risk most often hides. A company can show clean earnings and a healthy balance sheet while free cash flow is quietly deteriorating.
General thresholds from screening practice suggest payout ratios at or below 60-70%, depending on sector, provide more buffer through downturns. Cintas earned its 2-of-3 cash flow score here, signalling the area to monitor most closely despite strength elsewhere.
FCF payout ratio thresholds vary by sector because capital intensity differs so sharply across industries: utilities and regulated infrastructure can sustain ratios well above 70% given predictable cash flows, while cyclical industrials and consumer discretionary names warrant tighter ceilings closer to 50-60% to preserve dividend safety through downturns.
Financial scoring confirms the business can afford its dividend. The next step is examining the dividend’s own track record, because a payout history can be misread if the verification is incomplete.
Four checks form the dividend quality assessment:
That final check matters more than it might seem. Cintas underwent exactly this kind of transition, switching from annual to quarterly dividend payments. The per-payment figure dropped on the chart, creating the appearance of a reduction. The annual total was unaffected.
Always verify the annual dividend total, not the per-payment figure, before concluding a company cut its dividend.
Incorrectly eliminating a strong candidate based on a payment schedule artefact is a genuine risk for investors using screeners that display per-payment dividend history. The annual total is the only figure that matters for this assessment.
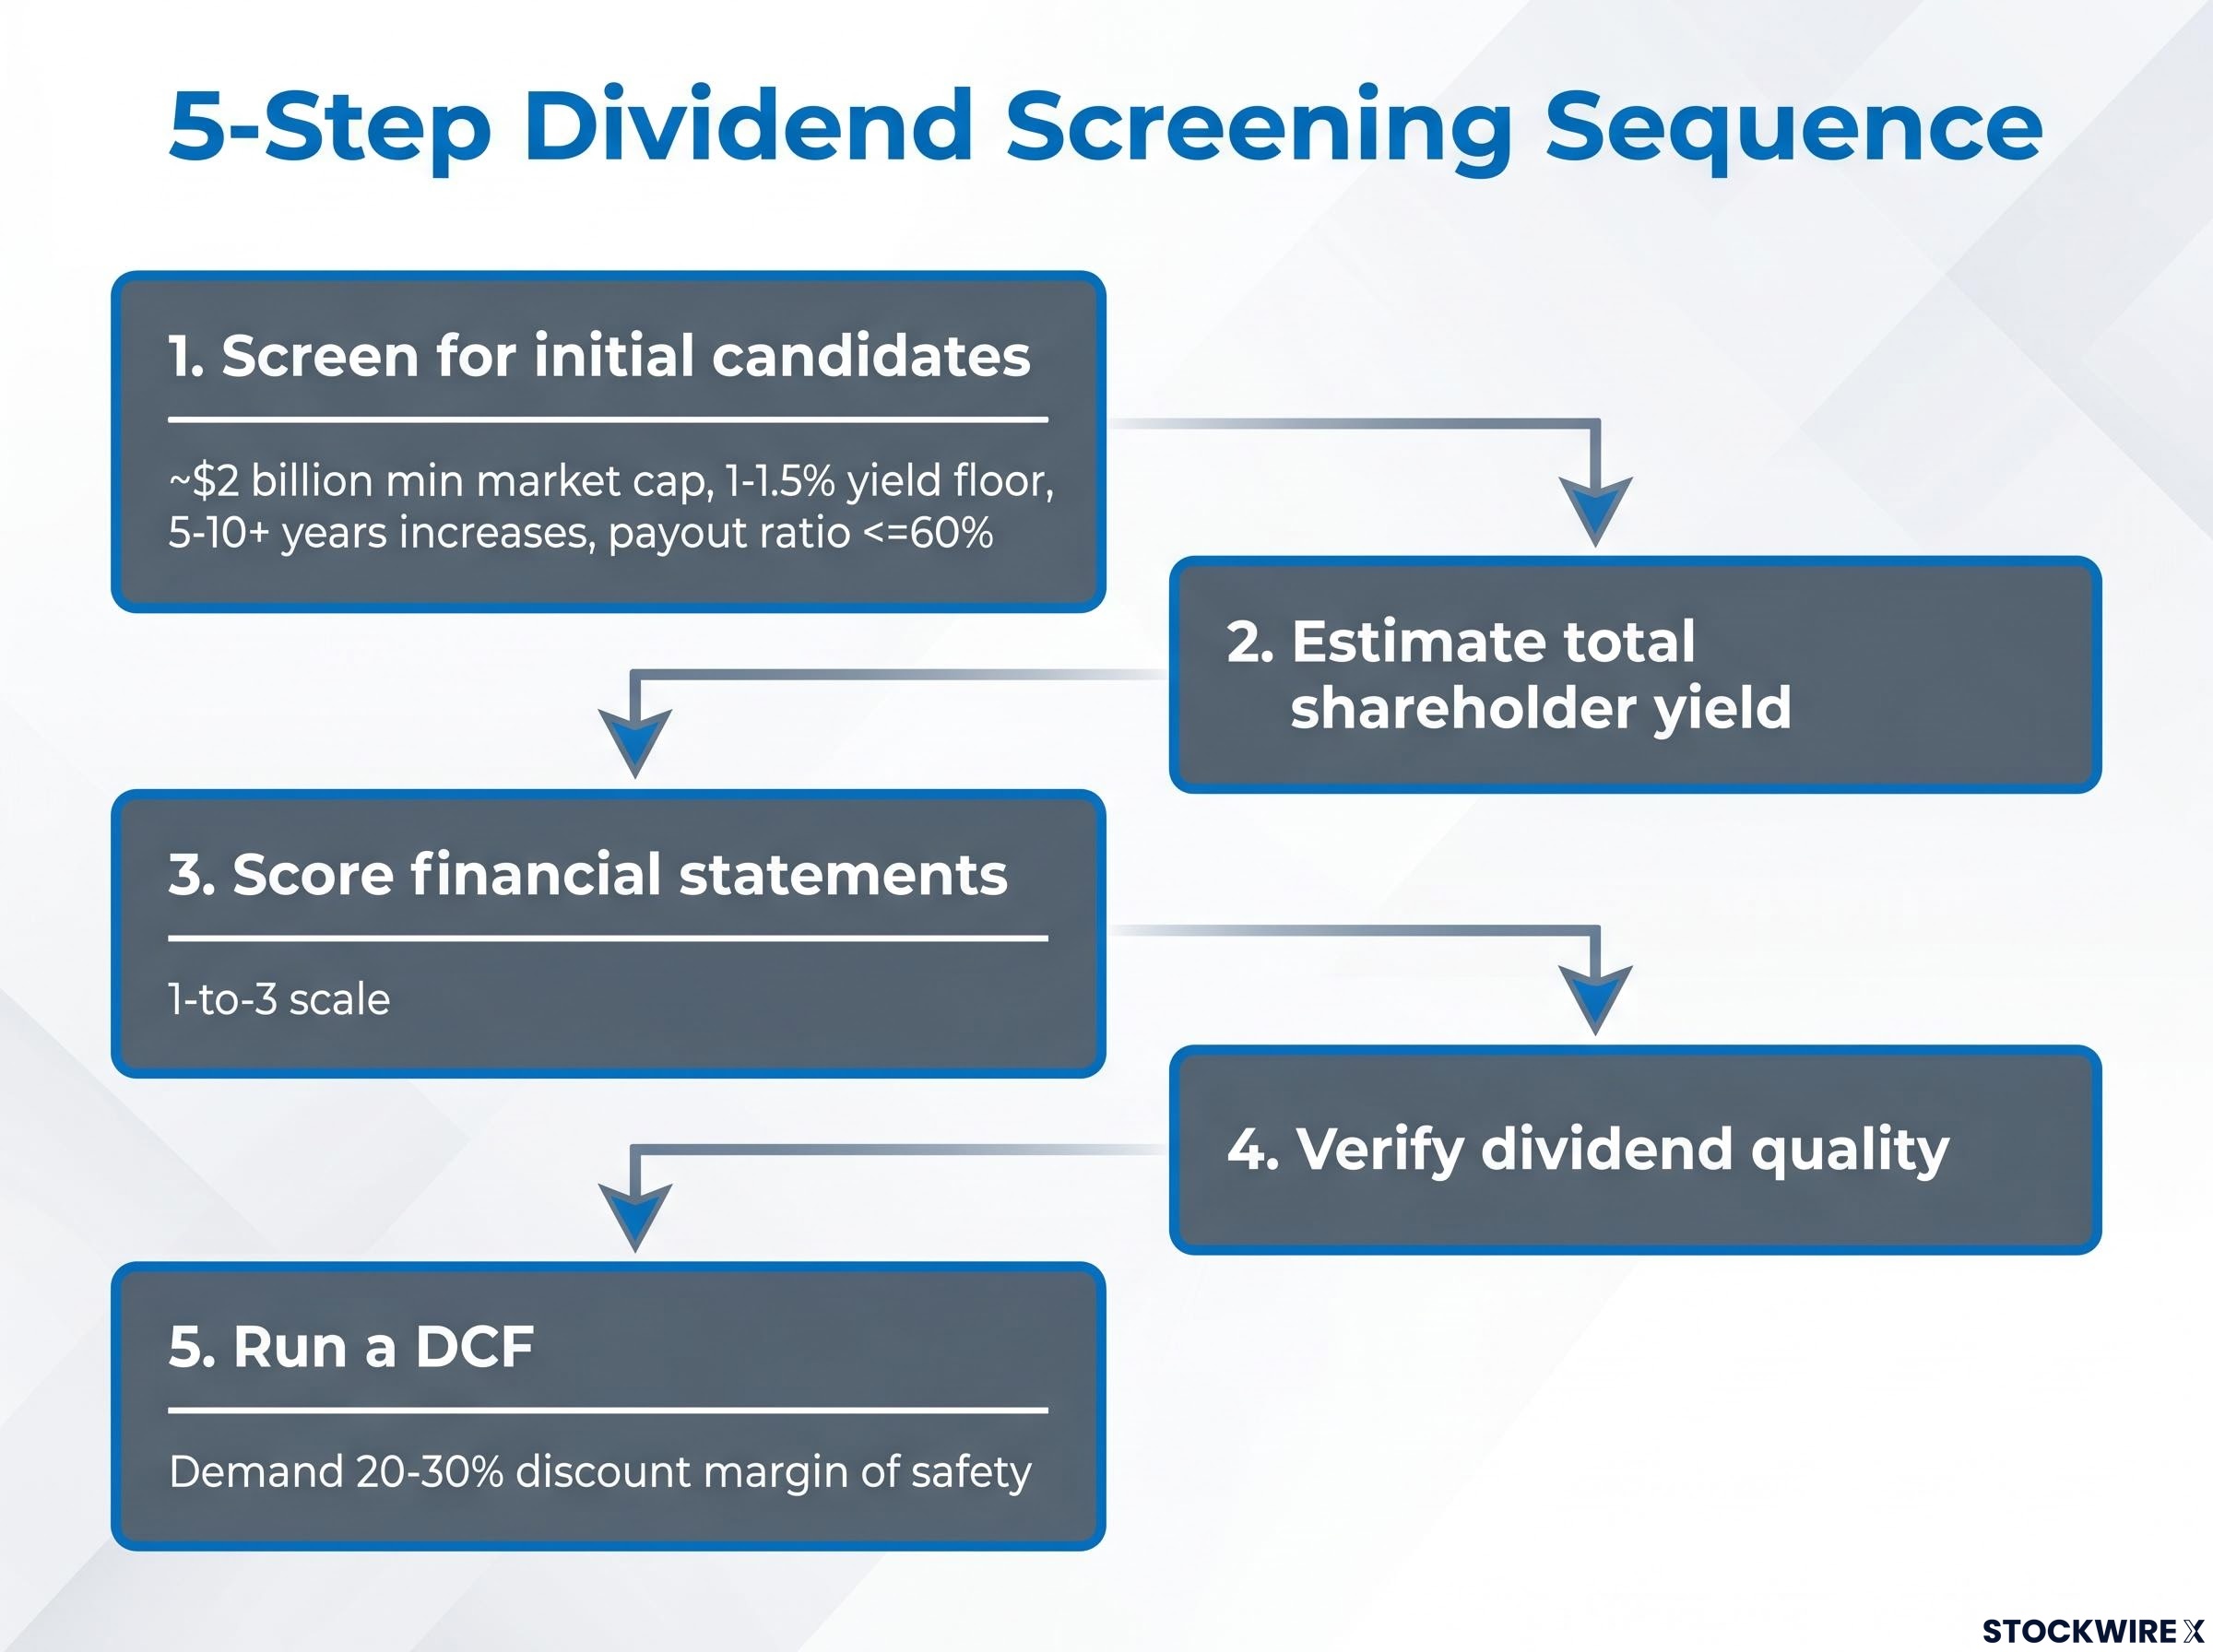
The four pillars described above collapse into a five-step process that can be applied to any candidate in a consistent, repeatable sequence.
Stocks that pass all five steps belong on a watchlist, not automatically in your portfolio.
The valuation step frequently produces a “strong company, wrong price, wait” conclusion. That is not a failure of the process. It is the process working correctly.
Cintas provides a clean illustration of how the framework produces a specific, actionable conclusion rather than a vague verdict.
Across the financial scoring categories, the profile is strong but not flawless: 3 of 3 on the income statement, 3 of 3 on the balance sheet, and 2 of 3 on cash flow. The total shareholder yield lens reveals that the headline dividend yield of approximately 1% understates the full capital return picture, with an estimated total shareholder yield of roughly 2.5% when buybacks and debt activity are incorporated. The long dividend increase history reinforces the quality signal, and the payment schedule transition from annual to quarterly payments serves as a practical reminder to verify annual totals before concluding a cut occurred.
The valuation step, however, changes the conclusion. A DCF analysis using analyst projections on the Investors Grow platform indicated the stock may be somewhat overvalued at current levels. Strong fundamentals earn watchlist status, but the premium pricing limits expected returns.
| Framework step | Cintas result |
|---|---|
| Total shareholder yield | ~2.5% (headline dividend yield ~1%) |
| Income statement score | 3 of 3 |
| Balance sheet score | 3 of 3 |
| Cash flow score | 2 of 3 |
| Valuation status | Watchlist; may be overvalued at current levels |
The appropriate action is to wait for a pullback that creates a more attractive entry point. A “watch and wait” conclusion is a successful outcome of the framework, not a failure of it.
A business that scores perfectly on financial quality, dividend track record, and total shareholder yield can still become a poor investment if purchased at the wrong price. The valuation pillar exists to prevent that outcome.
A discounted cash flow (DCF) analysis, which estimates what a business is worth today based on projected future cash flows, provides the intrinsic value estimate. The mechanics follow four steps:
The margin of safety is the buffer between that conservative intrinsic value estimate and the price actually paid. A discount of 20-30% (or greater for less predictable businesses) serves as a practical starting point. This buffer compensates for projection errors, improves long-term yield on cost, and reduces the risk of overpaying for quality.
For investors who want to build out the DCF step with worked inputs and sensitivity analysis, our comprehensive walkthrough of intrinsic value estimation covers terminal value assumptions (which typically drive 60-80% of a model’s implied value), discount rate selection, and the specific stress-test disciplines that Seth Klarman and other practitioners apply before committing capital.
A great company purchased at the wrong price is still a poor investment decision.
Dividend-paying equities have historically shown more resilience during market downturns and have outperformed non-dividend payers during periods of weakness. That historical advantage, however, holds only when entry prices do not already reflect perfection. For long-term investors adding dividend exposure to balance a portfolio, the purchase price determines both the starting yield and the ceiling on total return.
The four pillars, total shareholder yield, three-bucket financial scoring, dividend quality verification, and DCF valuation with margin of safety, compress into a one-page scoring reference that can be applied to any ticker in a consistent, repeatable sequence.
In practice, this translates into a spreadsheet template with one row per candidate, columns for each of the four pillars, a pass/watchlist/eliminate outcome, and a target entry price derived from the DCF. The compact checklist:
This framework systematically selects for moderate yield, high sustainability, and dividend growth, a combination that evidence suggests tends to outperform very high yielders over long holding periods. Dividend-paying equities have historically shown more resilience during downturns, making them a structural complement to portfolios heavy in non-dividend-paying growth names.
The debate around dividend growth versus total return matters most at the portfolio construction level: a total market portfolio returned 10.49% annualised from 2016-2025 against 9.43% for a dividend-focused equivalent, a gap that compounds to roughly $116,000 in additional wealth on a $100,000 starting investment over 20 years, which helps clarify where a dividend screen like this one fits within a broader allocation rather than as a standalone strategy.
All thresholds cited in this guide, payout ratio ceilings, leverage tolerances, margin of safety percentages, and market capitalisation floors, are illustrative starting points. REITs and utilities operate with different payout and leverage norms than industrials or technology companies. Calibrate the specific numbers to sector, risk tolerance, and portfolio objectives. The structure of the process stays constant; the parameters within it should reflect individual circumstances.
A framework that correctly identifies a strong business and also correctly identifies that the current price does not offer adequate margin of safety has done its job well. The outcome is not a missed opportunity. It is discipline.
Build and maintain a watchlist of stocks that passed the quality screens but failed the valuation screen. Market corrections, sector pullbacks, and periods of temporary pessimism create entry points for companies whose fundamentals never deteriorated. Revisit the list regularly.
The long-term goal is a portfolio of dividend stocks chosen through this framework, purchased at prices that provide genuine margin of safety, compounding income and capital over years and decades rather than chasing yield at any cost. A repeatable process, applied consistently, is worth more than any single stock pick.
This article is for informational purposes only and should not be considered financial advice. Investors should conduct their own research and consult with financial professionals before making investment decisions. Past performance does not guarantee future results. Financial projections are subject to market conditions and various risk factors.
Total shareholder yield is the sum of dividend yield, buyback yield, and debt paydown yield, giving a fuller picture of all capital returned to shareholders. It matters because a low headline dividend yield, like Cintas at roughly 1%, can understate the true capital return when buybacks and debt reduction are factored in, bringing the estimated total to around 2.5%.
Instead of sorting purely by headline yield, use a multi-step process: calculate total shareholder yield across all return channels, score the income statement, balance sheet, and cash flow on a 1-to-3 scale, verify the dividend's consecutive increase track record and FCF payout ratio, and only buy when the stock trades at a meaningful discount to your DCF intrinsic value estimate.
The FCF payout ratio equals dividends paid divided by free cash flow, where free cash flow equals operating cash flow minus capital expenditures. It is considered a more reliable dividend sustainability signal than the earnings-based payout ratio because it reflects actual cash available after reinvestment needs.
Yield rises mechanically when a share price falls, so a stock that has dropped sharply on deteriorating fundamentals will display an elevated yield even if a dividend cut is imminent. Research from Hartford Funds found that stocks in the highest yield quintile have historically underperformed those in the second quintile, reinforcing why yield alone is a poor screening filter.
Always compare the annual dividend total rather than the per-payment figure, because a company transitioning from annual to quarterly payments will show a smaller per-payment amount on historical charts, creating the false appearance of a reduction. Cintas went through exactly this kind of schedule change, and the annual total was unaffected.


