
SpaceX IPO Lockup: 83% of Insider Shares Unlock Before 180 Days
41 mins ago

Oracle just reported 21% revenue growth, a record $638 billion order backlog, and 93% growth in its cloud infrastructure business. Then the stock fell as much as 12% in a single session.
The paradox has left investors searching for answers, and the resolution sits beneath the headline numbers. Understanding what drove the Oracle stock drop requires moving past top-line revenue and examining what it actually costs Oracle to generate that growth, how the company plans to finance those costs, and what that financing does to the value of each existing share.
What follows explains each layer of the story in sequence: what the earnings showed, why capital intensity matters, how equity dilution mechanics work, what the debt load means, and what the broader lesson is for anyone evaluating high-growth companies in the AI buildout era.
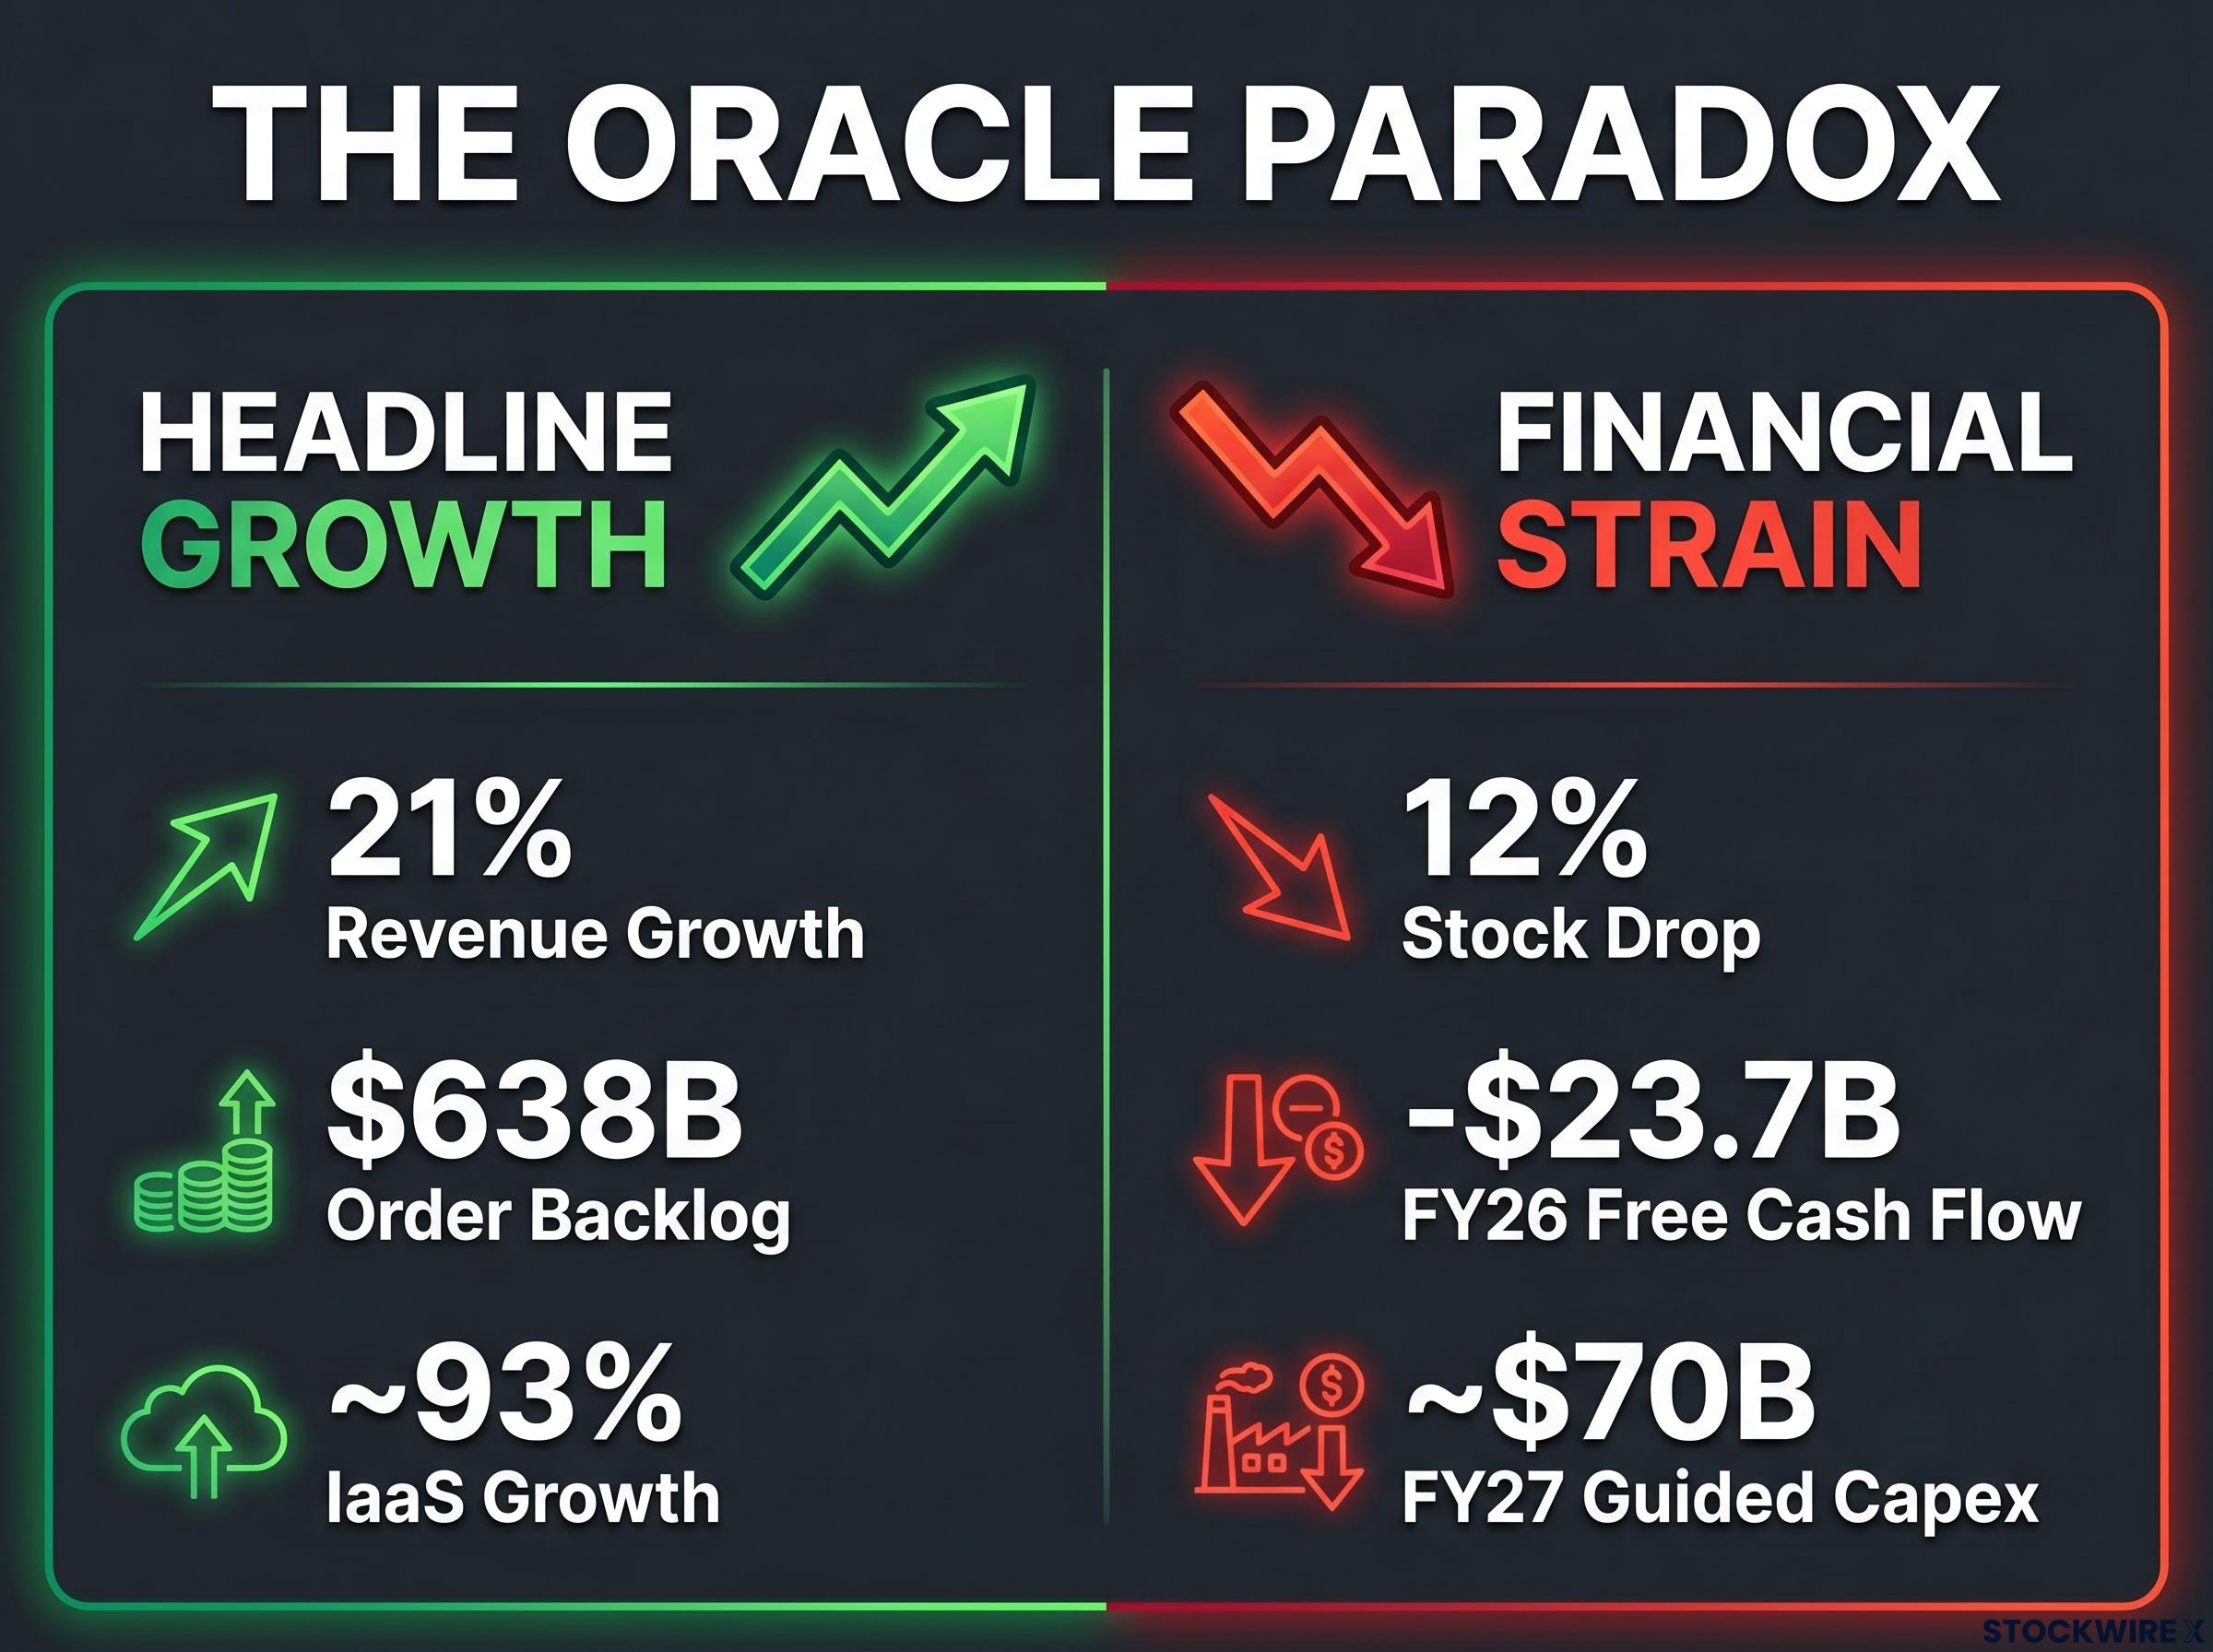
Oracle’s Q4 FY2026 results were, by any conventional measure, strong. Quarterly revenue reached $19.2 billion, representing 21% growth in USD and 20% in constant currency. Full-year FY2026 revenue totalled $67.4 billion.
The order backlog was the standout figure. Remaining performance obligations (RPO), a measure of contracted future revenue, reached $638 billion, an $85 billion sequential increase from the prior quarter’s $553 billion. Cloud infrastructure (IaaS) grew at approximately 93%, roughly 98% of AI data centre capacity is already under contract, and Oracle holds major contracts with companies including OpenAI. Cloud applications (SaaS) grew at roughly 10%, while legacy software revenue declined approximately 2%, reflecting a deliberate shift away from on-premise licensing rather than demand deterioration.
The Oracle Q4 FY2026 earnings release confirmed quarterly revenue of $19.2 billion, IaaS growth of approximately 93%, and a record $638 billion in remaining performance obligations, the primary source figures underpinning the analyst and investor reactions that followed.
| Metric | Value | Period |
|---|---|---|
| Quarterly revenue | $19.2 billion | Q4 FY2026 |
| Revenue growth (USD) | 21% | Q4 FY2026 |
| Full-year revenue | $67.4 billion | FY2026 |
| RPO (order backlog) | $638 billion | End of Q4 FY2026 |
| IaaS growth | ~93% | Q4 FY2026 |
| SaaS growth | ~10% | Q4 FY2026 |
$638 billion in contracted future revenue, nearly 10 times Oracle’s annual revenue, is sitting in the order book.
The stock still fell as much as 12% intraday following the release.
Comparing Oracle’s results against hyperscaler earnings from AWS, Google Cloud, and Azure in the same period reveals a consistent pattern: record backlogs and accelerating cloud growth are appearing alongside compressed free cash flow and rising capital commitments across every major AI infrastructure player.
Oracle’s historical business model was asset-light. Selling software licences and database subscriptions required relatively little physical infrastructure, which is why the company historically generated strong free cash flow. The transition to AI cloud infrastructure is a fundamentally different proposition, requiring the construction and operation of physical data centres at scale, with substantial upfront capital deployed before a dollar of revenue is collected.
The contrast between the two models explains the financial strain:
The scale of spending is not a temporary anomaly. It reflects a structural shift in what Oracle is as a business.
Not all of the capital burden falls on Oracle’s balance sheet alone. Customer prepayments across large AI contracts total $75 billion, and customer-supplied GPUs further reduce the capital Oracle must independently raise. Management has indicated that rising input costs, including memory, power, and personnel, will be passed through to customers via contractual mechanisms rather than absorbed into Oracle’s margins.
These mitigating factors are material. They do not, however, resolve the central investor concern: the overall debt trajectory and negative free cash flow remain the dominant risk.
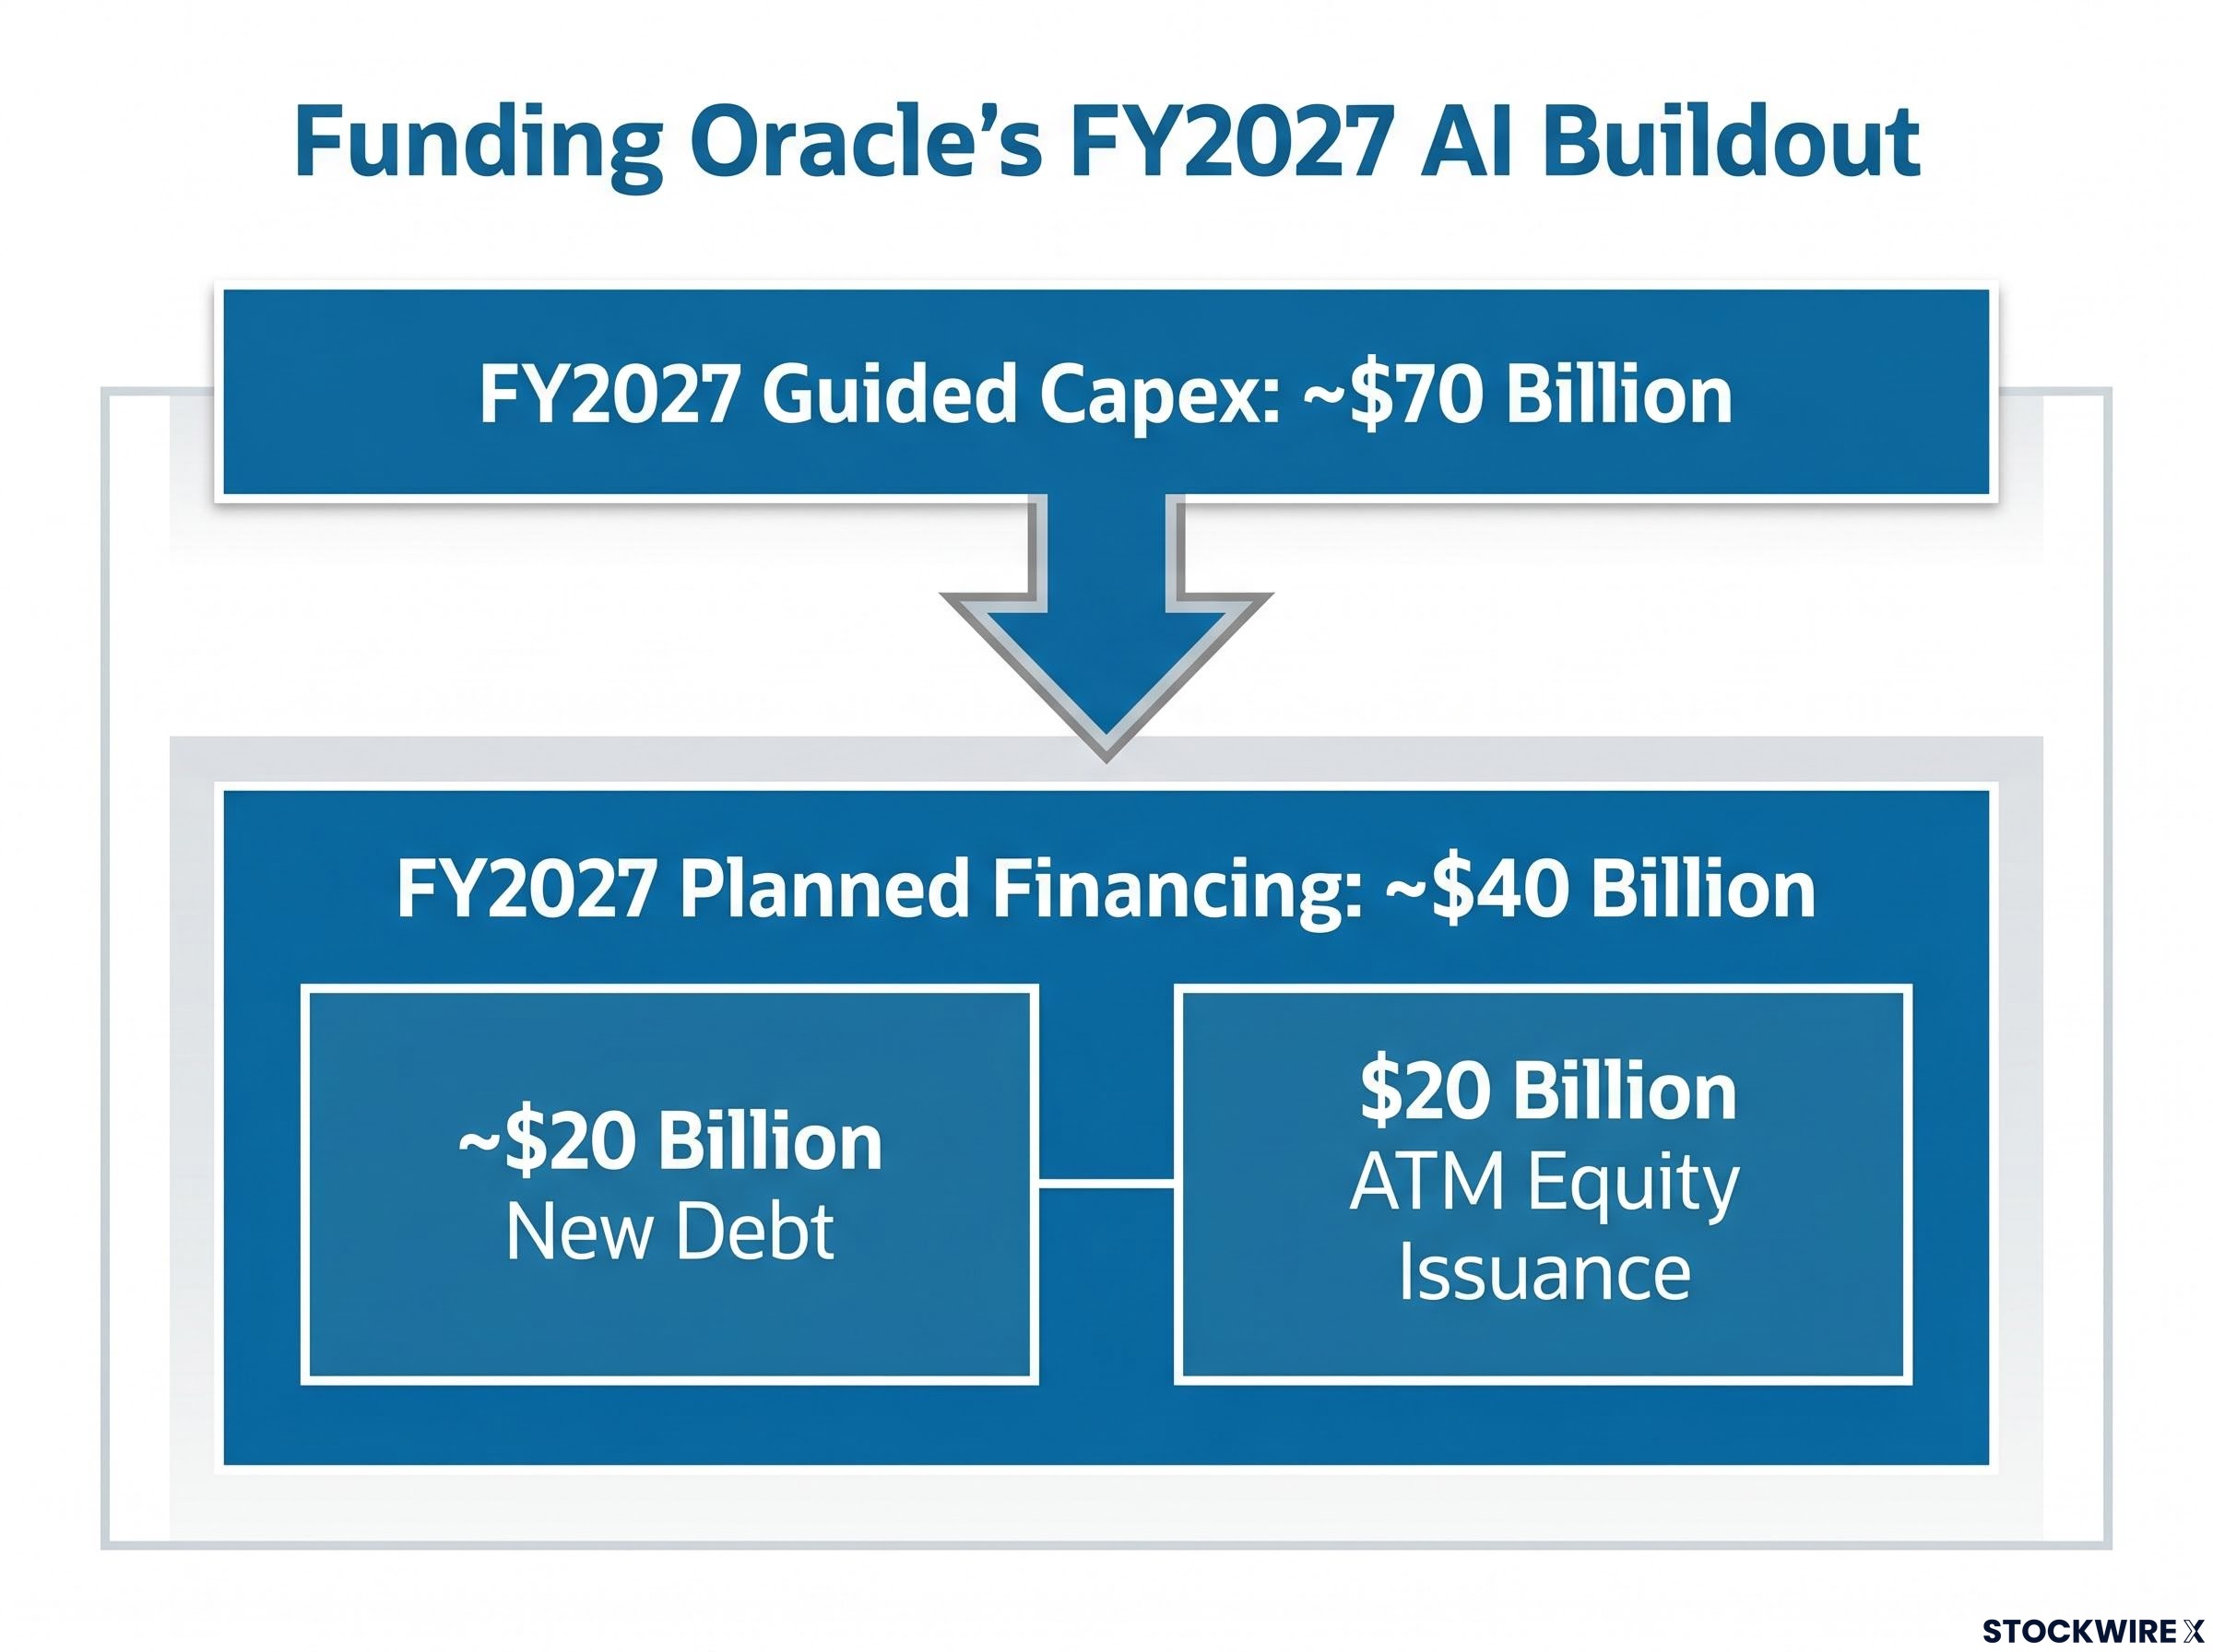
During FY2026, Oracle raised $43 billion in debt and $5 billion in equity to fund the infrastructure buildout. For FY2027, the company plans to raise approximately $40 billion through a combination of roughly $20 billion in new debt and a $20 billion at-the-market (ATM) equity issuance programme.
The equity component is what rattled shareholders. Equity dilution, the reduction in each existing shareholder’s proportional ownership when new shares are created, is a straightforward mechanic that explains why announced share issuance can drive immediate stock repricing even when operations are strong.
Here is how the arithmetic works:
The principle is critical: the market does not wait for dilution to materialise. It reprices the stock the moment equity issuance is announced or signalled.
The mechanics of dilution at the individual company level connect to a broader market dynamic: rising net equity supply from AI-driven capital programmes across multiple large technology companies is removing a structural price support that has underpinned US equity valuations for over a decade.
“The market does not wait for dilution to materialise. It reprices the stock the moment equity issuance is announced.”
This is precisely the dynamic that played out with Oracle. The stock sold off not because demand was disappointing, but because investors recalibrated the per-share economics of a growth story that requires very expensive financing.
An ATM programme allows Oracle to issue new shares gradually into the open market rather than in a single large offering. This provides flexibility, but it creates ongoing dilution overhang throughout FY2027. The $20 billion ATM programme introduces uncertainty because the pace and scale of issuance is not predetermined, making future EPS harder to model.
Oracle’s long-term notes payable stood at approximately $124.7 billion as of the most recent report. Total gross debt, depending on classification methodology and whether short-term obligations are included, is estimated at $134-$156 billion.
The debt burden is already showing up in the financial statements. Interest expense rose 32% to approximately $1.18 billion in a recent quarter, and FY2026 free cash flow was negative $23.7 billion. The net debt-to-EBITDA ratio (a measure of leverage relative to operating earnings) is estimated at roughly 3-4 times based on management guidance, a threshold at which institutional investors typically begin applying valuation discounts.
| Metric | Value | Significance |
|---|---|---|
| Long-term notes payable | ~$124.7 billion | Core measure of Oracle’s borrowing position |
| Interest expense (recent quarter) | ~$1.18 billion (+32%) | Growing cost of servicing debt compresses net income |
| FY2026 free cash flow | Negative $23.7 billion | Capex exceeds operating cash flow by a wide margin |
| Net debt-to-EBITDA | ~3-4× (estimated) | Approaching levels where valuation discounts are common |
High leverage creates three specific channels of investor concern:
EBITDA growth is expected to help moderate the leverage ratio over time as the buildout matures and revenue scales. Whether that moderation arrives quickly enough is one of the open questions the market is pricing.
The institutional market for AI debt financing is itself under structural pressure: a $15 trillion corporate refinancing wall expected between 2026 and 2028 is pushing institutional capital toward hybrid AI credit instruments, creating demand conditions that simultaneously support Oracle’s ability to raise debt and introduce new complexity into how that debt is priced.
The fastest-growing part of Oracle’s business is currently its least profitable. Internal Oracle documents reported by The Information (via CNBC) showed gross margins of approximately 14-16% in certain periods on the AI infrastructure business, materially below prior analyst assumptions.
That figure sits far below management’s stated target of 30-40% gross margins on AI data centre projects over time.
Oracle’s fastest-growing segment currently earns gross margins of 14-16%, compared to a management target of 30-40% and the much higher margins on its legacy software business.
This margin dynamic compounds the free cash flow problem. Even with a $638 billion backlog and 93% IaaS growth, thin incremental margins combined with heavy upfront capex produce near-term free cash flow that looks substantially weaker than revenue growth alone would suggest. The negative $23.7 billion FY2026 free cash flow is the tangible result of this combination.
Management expects margin improvement as the business mix shifts, with more software and services layered on top of the infrastructure. Scale benefits are expected to reduce per-unit costs, and customer contracts should mature into more profitable phases over time.
The pace of this improvement is a key variable. If margins do not move toward the guided 30-40% range within two to three years, the free cash flow inflection point investors are pricing in would be pushed further out, and the valuation would face additional pressure.
For investors wanting to stress-test the assumption that large cloud backlogs reliably translate into margin expansion, our deep-dive into Alphabet’s cloud backlog and margin dynamics examines how Google Cloud moved from 18% to 32.9% operating margins in a single quarter while simultaneously absorbing $35.7 billion in quarterly capex, offering a direct comparison case for Oracle’s own guided margin trajectory.
The core investor question is not whether AI demand is real. Oracle’s $638 billion backlog removes that doubt. The question is how much of that demand’s value will accrue to existing shareholders after accounting for capital costs, financing dilution, and margin dynamics.
Five forward-looking metrics will determine the answer:
These metrics apply beyond Oracle to any company in the AI infrastructure buildout. The framework separates revenue growth, which captures demand, from shareholder value creation, which captures what each investor actually receives.
The paradox resolves cleanly. 21% revenue growth and a 12% stock decline are not contradictory once the full picture is visible: capital intensity, dilution mechanics, and margin realities each explain a portion of the repricing.
Three factors determine whether growth creates or destroys per-share shareholder value:
Oracle’s $638 billion backlog represents genuine demand and a potentially strong multi-year business. The debate is not about the company’s customers. It is about the economics of serving them at this scale of investment, and whether the value created by that investment will flow to existing shareholders or be consumed by the capital required to capture it.
This article is for informational purposes only and should not be considered financial advice. Investors should conduct their own research and consult with financial professionals before making investment decisions. Past performance does not guarantee future results. Financial projections are subject to market conditions and various risk factors.
Oracle stock fell as much as 12% because investors focused on the cost of growth rather than revenue alone: FY2026 free cash flow was negative $23.7 billion, the company announced a $20 billion equity issuance programme that dilutes existing shareholders, and AI cloud gross margins came in at just 14-16%, well below the 30-40% management target.
Equity dilution occurs when a company issues new shares, reducing each existing shareholder's proportional ownership and earnings per share. Oracle's planned $20 billion at-the-market share issuance for FY2027 means existing shareholders' slice of future profits shrinks even if the underlying business continues to grow.
Oracle's order backlog, measured as remaining performance obligations (RPO), reached $638 billion at the end of Q4 FY2026, representing contracted future revenue the company has already agreed to deliver. This figure is nearly 10 times Oracle's annual revenue and reflects strong demand for its AI cloud infrastructure.
Oracle's long-term notes payable stood at approximately $124.7 billion, with total gross debt estimated at $134-156 billion. The company raised $43 billion in debt during FY2026 alone and plans to raise roughly $20 billion more in new debt during FY2027, resulting in a net debt-to-EBITDA ratio estimated at 3-4 times.
The five key metrics are: when free cash flow inflects from negative $23.7 billion toward positive; whether AI cloud gross margins improve from 14-16% toward the guided 30-40%; the pace of the $20 billion ATM equity programme; whether EBITDA growth reduces the net-debt-to-EBITDA ratio; and how quickly the $638 billion backlog converts to recognised revenue.


