On the same day U.S. Central Command confirmed overnight strikes on Iranian targets, the Bureau of Labor Statistics reported that headline producer prices climbed 6.5% year-over-year in May 2026, the highest annual rate since November 2022. Two unrelated calendars, one compounding problem. Markets on 11 June 2026 are navigating a rare simultaneous squeeze: an active military conflict threatening roughly a fifth of global oil supply through the Strait of Hormuz, and a producer inflation reading that complicates the Federal Reserve’s already constrained policy options. Neither shock alone would be trivial. Together, they interact through energy prices in ways that most single-factor portfolio frameworks are not built to handle. What follows maps the mechanics of each shock, traces how they connect through crude oil, identifies the resulting Fed policy dilemma, and isolates the specific signals that will determine which scenario plays out from here.
Two shocks, one day: what happened on June 11
The timeline compressed fast.
Late on 10 June, U.S. Central Command confirmed American military strikes on multiple Iranian targets, characterising the actions as defensive responses following the downing of a U.S. helicopter near the Strait of Hormuz. Hours earlier, President Trump posted on Truth Social referencing the evening’s strikes and raising the possibility of future targeting of Kharg Island and additional Iranian oil and gas infrastructure.
Trump’s Truth Social post explicitly named Kharg Island, Iran’s principal crude export terminal, as a potential future target, converting a vague military campaign into a specific, infrastructure-level risk that markets must now assign some probability to.
By the morning of 11 June, the Bureau of Labor Statistics released May 2026 PPI data showing headline producer prices up 1.1% month-over-month and 6.5% year-over-year, both above consensus. Brent crude, which had initially spiked following Trump’s post, reversed to trade down approximately 0.5% at roughly $92.60 per barrel: the market’s attempt to price a probability distribution between escalation and diplomatic containment.
The key events on 10-11 June:
- CENTCOM confirmed strikes on multiple Iranian targets (late 10 June / early 11 June)
- Iran reportedly responded with strikes against several U.S. military installations and allied sites
- The Israeli military issued an early warning regarding projectile launches originating from Lebanon
- The Bureau of Labor Statistics released May 2026 PPI data, with headline at 6.5% year-over-year
The collision of these two developments, military escalation and a hot inflation print, on a single calendar day is the analytical entry point for everything that follows.
When big ASX news breaks, our subscribers know first
Why the Strait of Hormuz turns a regional conflict into a global market event
The Kharg Island scenario and infrastructure-level risk
The Strait of Hormuz handles approximately one-fifth of global oil supply. Any credible interference with shipping lanes or export infrastructure is treated not as a regional military event but as a global supply shock, and the current conflict has introduced precisely that credibility.
The Hormuz supply disruption has been building since late February 2026, with the EIA modelling Gulf production shut-ins peaking near 10.8 million barrels per day, a volume equivalent to removing roughly 80% of total U.S. crude output from global markets and one that existing bypass pipeline infrastructure cannot replace.
Kharg Island sits in the Persian Gulf off Iran’s coastline and functions as the principal export terminal for the bulk of Iran’s crude shipments. Trump’s explicit public reference to it as a potential future target converts what had been a speculative worst-case scenario into a named, on-the-record risk. Iran has already claimed to have halted all vessel navigation through the strait, a claim CENTCOM disputed, while CENTCOM has separately reported shooting down Iranian drones threatening commercial maritime traffic. The conflict, which began on 28 February 2026, has established a pattern of reciprocal strikes and harassment that gives the oil risk premium a structural foundation rather than a speculative one.
The CENTCOM Hormuz operations statement from May 2026 documented the active engagement of U.S. forces against inbound threats and the targeting of Iranian military facilities, establishing the operational pattern of reciprocal escalation that has defined the conflict since February 28 and underpins the structural oil risk premium.
The diplomatic floor under oil prices
A second, less visible layer explains why Brent is trading at $92.60 rather than significantly higher. CNN reported that U.S. and Iranian officials maintained negotiations overnight even after both sides conducted aerial strikes on consecutive days. Reuters, citing Iranian sources, reported the two countries remained engaged in talks regarding a preliminary agreement that would include a mechanism to release frozen Iranian assets, with deal-making efforts described as intensifying.
Vital Knowledge analysts assessed that despite inflammatory statements from both parties, the situation did not appear to represent a full resumption of large-scale hostilities as of 11 June 2026.
Continued diplomacy and continued strikes are not mutually exclusive in this type of conflict. The pattern since 28 February has been precisely that: episodic military exchanges layered on top of ongoing back-channel negotiation. For oil markets, this creates an asymmetric distribution. Downside in crude is limited by active hostilities and structural supply tightness. Upside in a confirmed Hormuz disruption scenario could be very large.
What the May PPI data actually says, and what it does not
The headline number was hot. The composition tells a more nuanced story.
| Measure | May 2026 MoM (Actual) | May 2026 MoM (Estimate) | May 2026 YoY (Actual) | May 2026 YoY (Estimate) |
|---|---|---|---|---|
| Headline PPI | +1.1% (beat) | +0.7% | +6.5% (beat) | +6.4% |
| Core PPI | +0.4% (miss) | +0.5% | +4.9% (miss) | +5.4% |
Energy is the main driver of headline strength, with limited spillover so far into broader producer prices. The headline PPI result for May broadly mirrored the consumer price index data released the prior day, 10 June 2026, reinforcing the pattern: energy-concentrated inflation pressure, not yet broad-based.
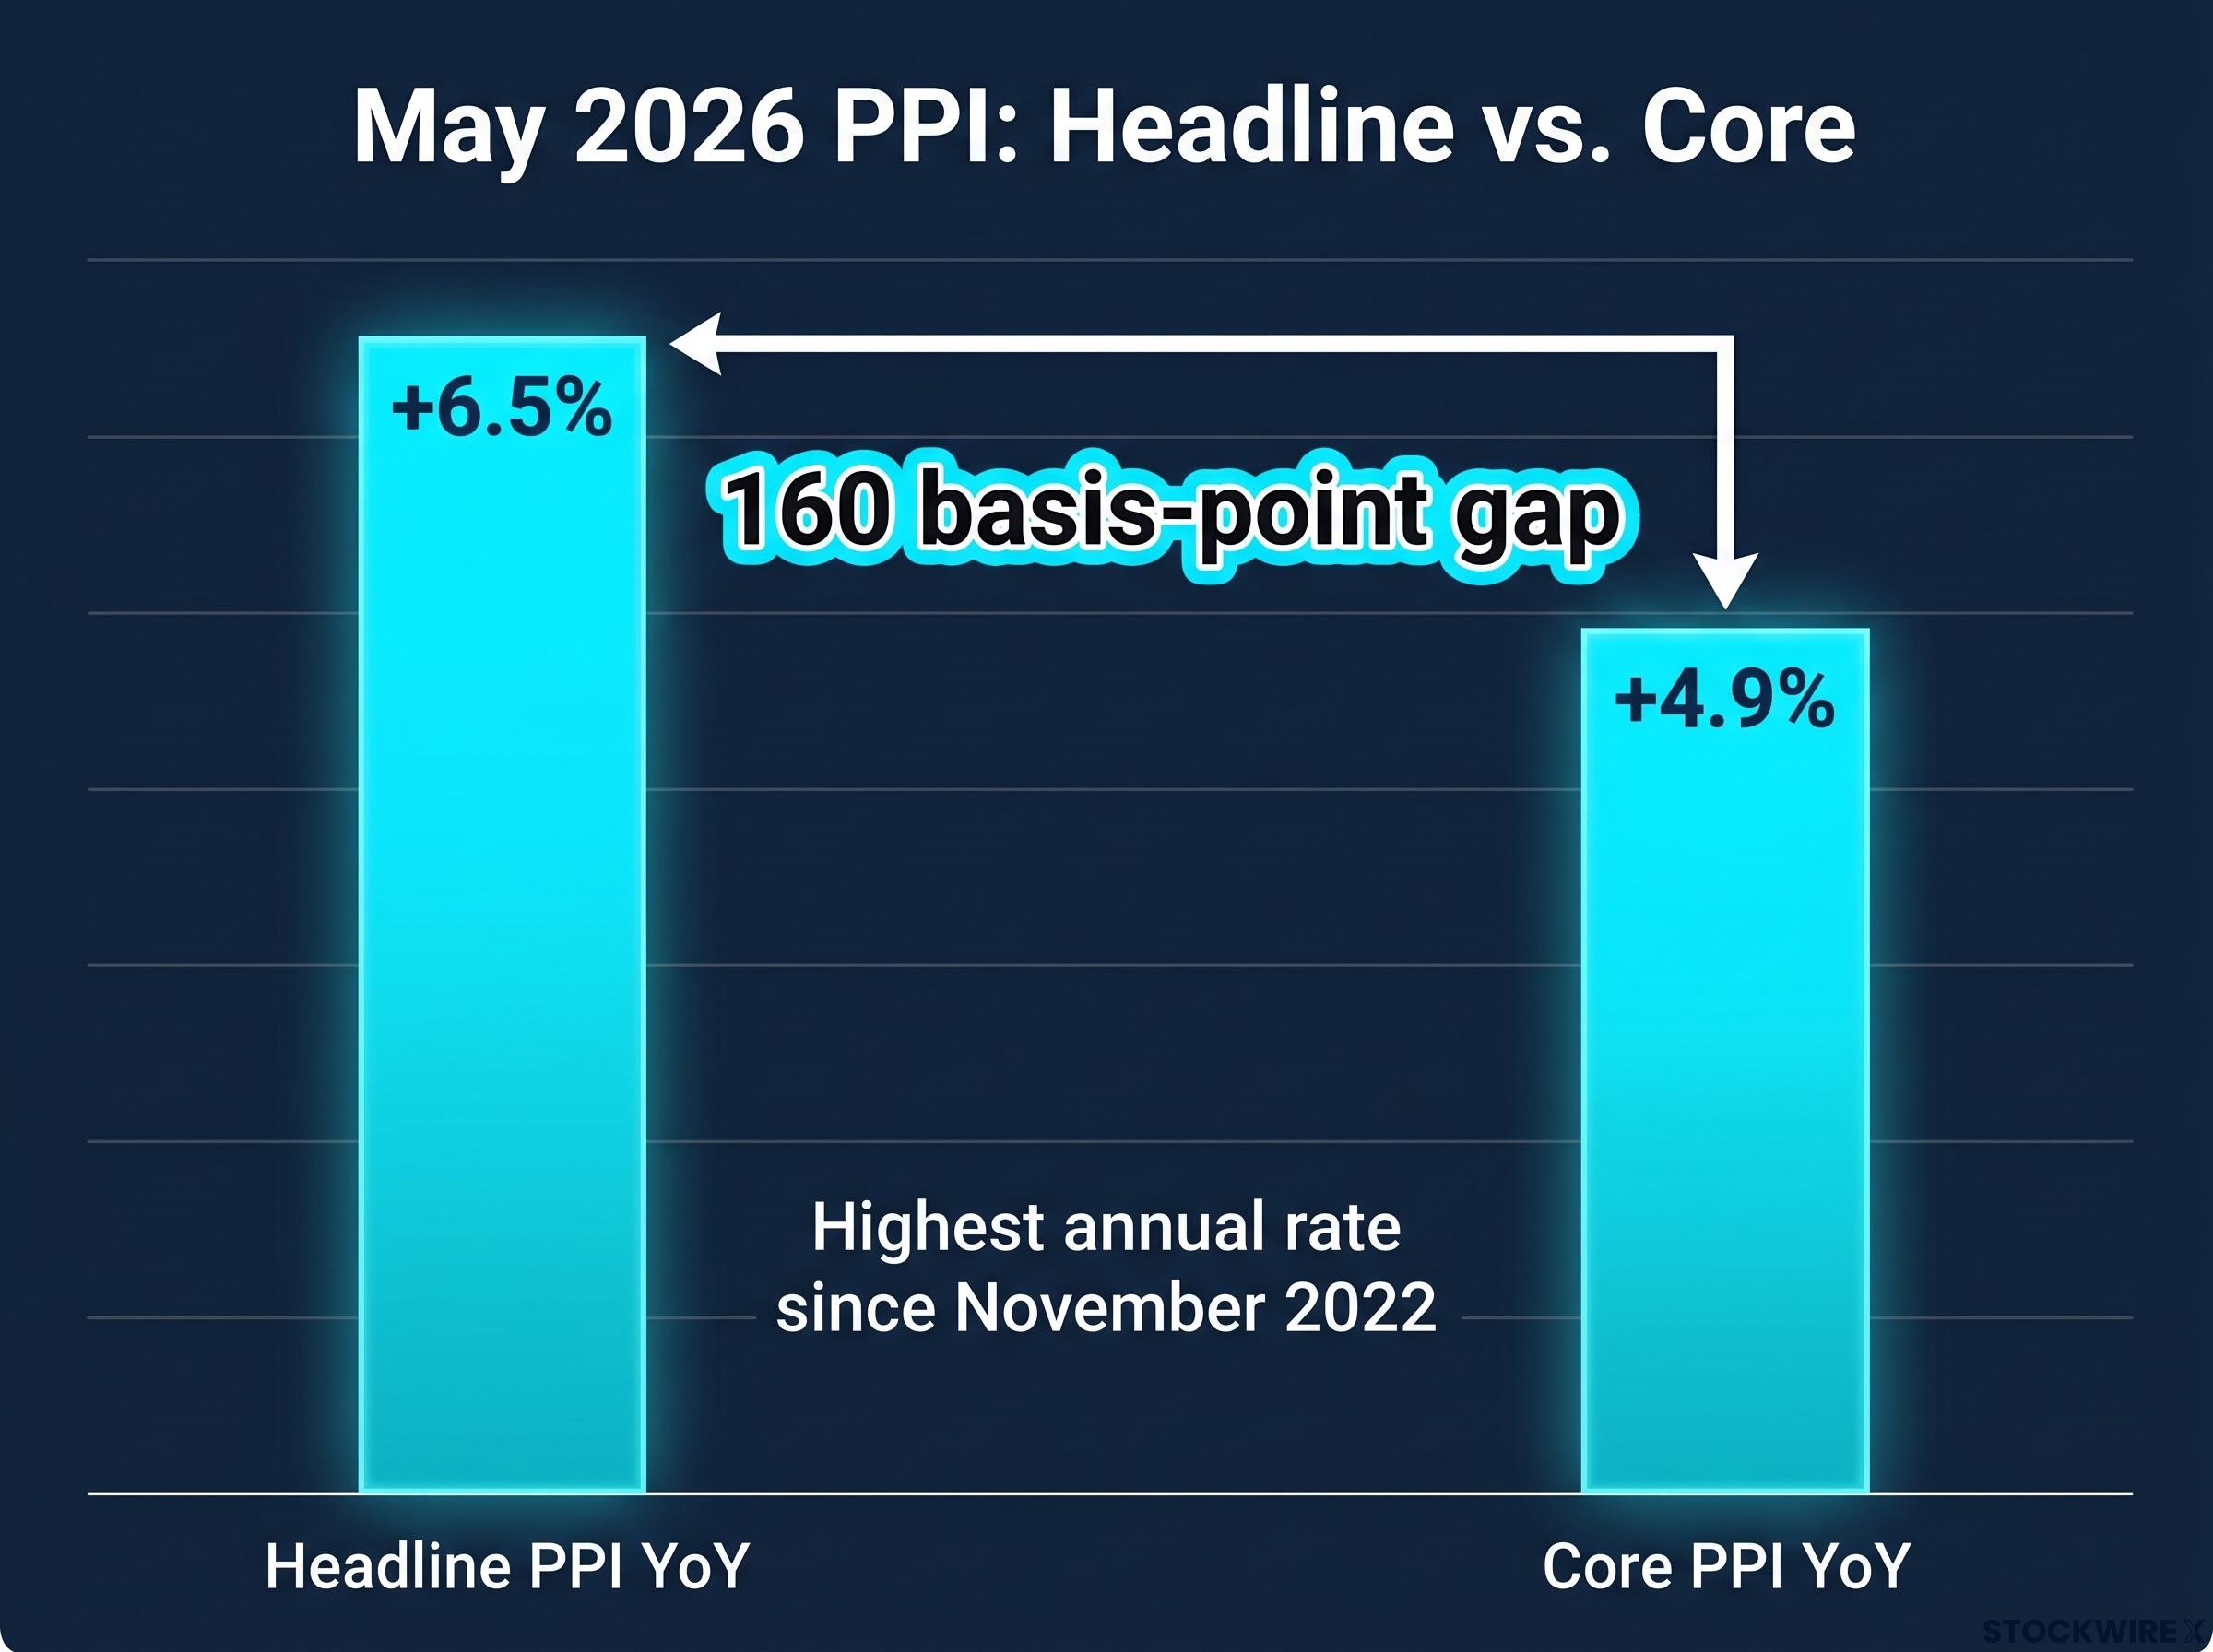
Mohamed El-Erian, former CEO of PIMCO, observed via X that energy-driven headline PPI has not significantly spread into broader pricing, and that the transmission of PPI increases into consumer prices appears to be partially absorbed by margin compression at the producer level.
The 160 basis-point gap between headline (6.5%) and core (4.9%) PPI is currently acting as a buffer. But margin absorption buys time; it does not remove the structural risk. A persistent energy shock can migrate into core through wage demands as workers respond to higher living costs, delayed corporate pass-through once firms exhaust their capacity to absorb input costs, and second-round effects in transport and petrochemical-dependent services. Whether that buffer holds depends on the duration and intensity of the energy shock, which is itself a function of how the U.S.-Iran conflict evolves.
Brookings research on relative-price shocks published in early 2026 finds that energy-driven supply disruptions can generate persistent aggregate inflation in a multi-sector economy even when initial price increases appear concentrated, with transmission to core accelerating once corporate margin buffers are exhausted.
How energy prices link these two shocks into a single stagflation risk
The crude oil curve is the channel that converts two seemingly independent risks into one linked system. The conflict threatens supply and growth simultaneously. The PPI data represents the inflation pressure already in the pipeline. And the Fed’s toolkit is poorly suited to address the supply-side origin of both pressures.
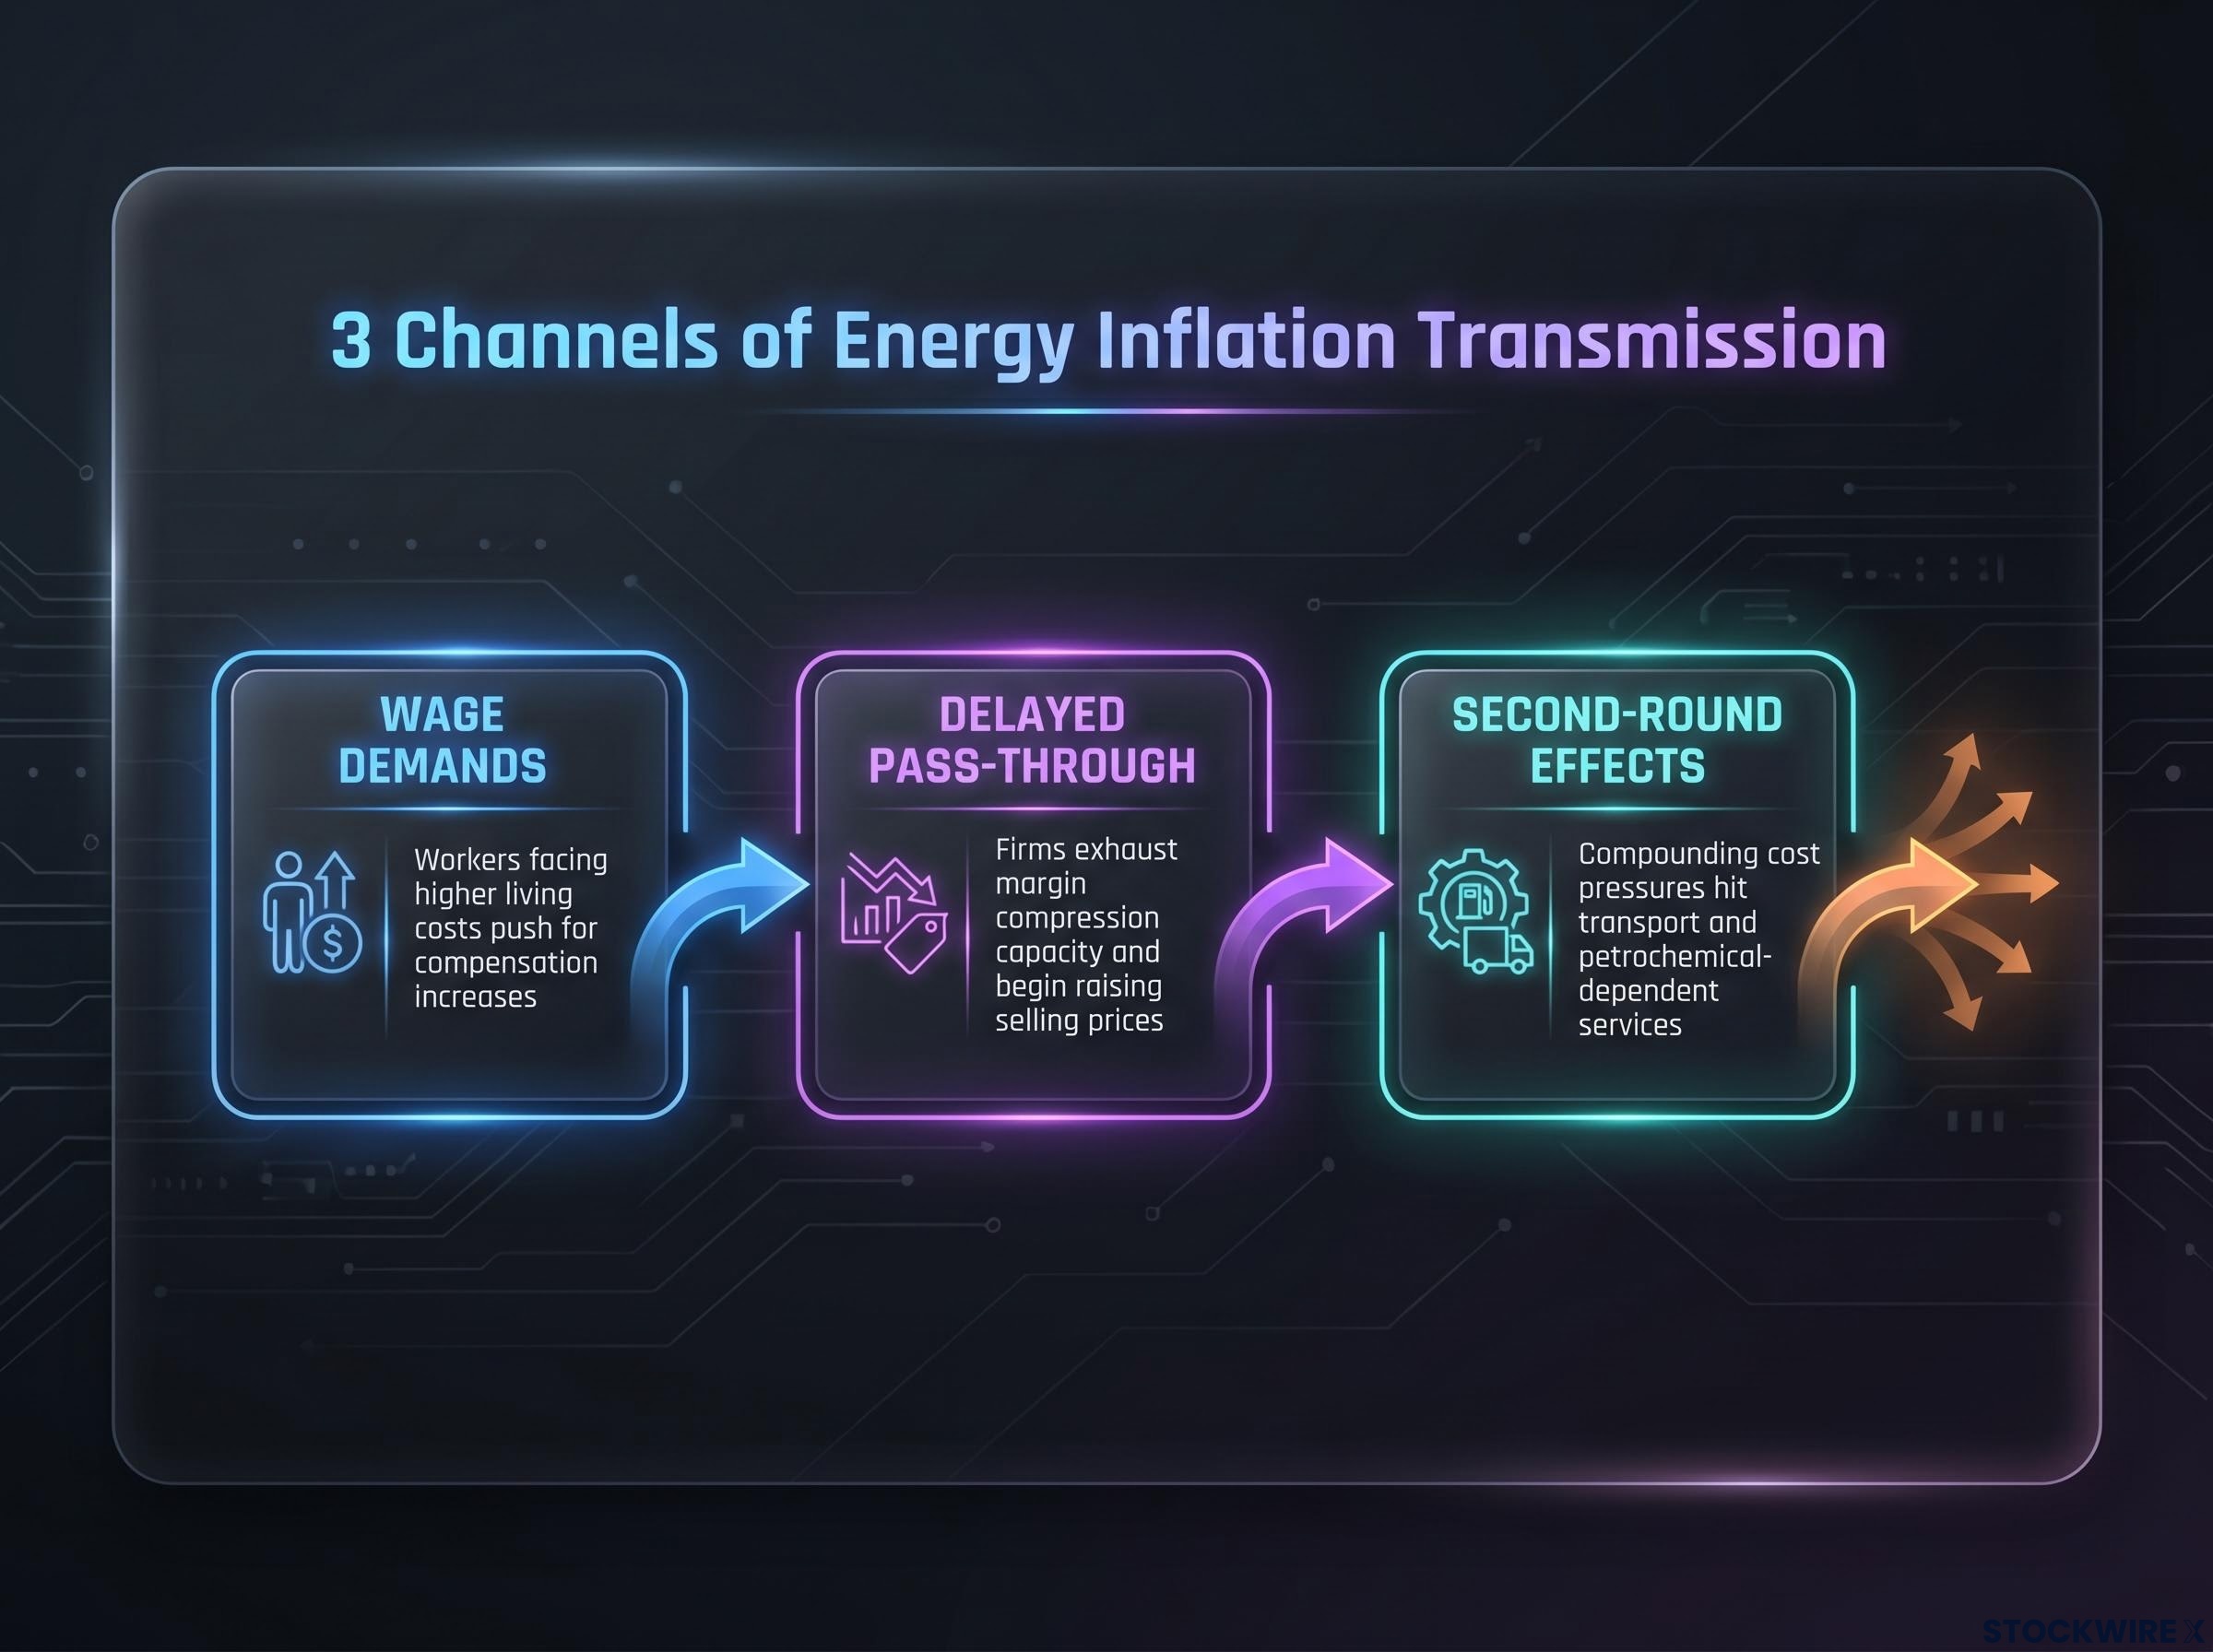
The transmission runs through three specific channels:
- Wage demands: Workers facing higher living costs push for compensation increases, translating energy-driven headline inflation into labour cost pressure that feeds core.
- Delayed pass-through: Firms absorbing input costs through margin compression eventually exhaust that capacity and begin raising selling prices, accelerating consumer-level inflation.
- Second-round effects: Services and core goods that depend heavily on transport and petrochemical inputs face compounding cost pressures over time, broadening the inflation footprint beyond energy.
The conflict has been running since 28 February 2026, meaning this is not a one-day shock but a multi-month macro input. Brent at $92.60 already reflects an elevated geopolitical risk premium, which means any confirmed physical Hormuz disruption would reprice from an already elevated base, not from a neutral starting point.
Why monetary policy cannot fix a supply-side shock
Rate increases cannot increase oil supply or resolve a geopolitical conflict. The Fed’s tools are asymmetrically ineffective against the current shock type. Tightening into a growth-negative oil shock risks overtightening and amplifying the drag on capital spending and hiring. Easing, or even signalling imminent easing, while headline inflation is re-accelerating risks unanchoring inflation expectations and undermining credibility.
That symmetrical constraint is the stagflation trap. Duration matters: limited, episodic strikes with ongoing diplomacy represent a materially different scenario than a sustained campaign targeting export infrastructure. The distinction between those two paths will determine whether the stagflation risk stays theoretical or becomes the dominant market narrative.
The FOMC policy fracture visible since the April 29 rate decision, where four dissents surfaced simultaneously against a hold at 3.5%-3.75%, illustrates precisely why the stagflation trap is not theoretical: hawks outnumbered the lone dovish dissenter three to one, yet PCE running at 3.5% against a 2% target and unemployment rising to 4.3% gave the committee no clearly superior option.
What investors should be watching, and why the next data prints matter more than usual
Conflict and energy signals
The difference between confirmed physical shipping disruption and headline noise from social media posts or disputed claims represents a vast pricing discontinuity, not a gradual repricing. The highest-value signals on this front are:
- Any credible confirmation of physical shipping disruption or attacks on major export infrastructure in or around the Strait of Hormuz, including follow-through on the stated Kharg Island threat
- Clear evidence that U.S.-Iran diplomacy is either advancing (a framework for freezing hostilities, a frozen asset release mechanism) or breaking down
- Regional spillover events involving Hezbollah, Gulf state infrastructure, or additional attacks on U.S. installations, such as the Israeli military’s 11 June early warning regarding Lebanese projectile launches
- CENTCOM’s real-time Hormuz monitoring updates, which remain the most authoritative source for physical disruption confirmation
Inflation and policy signals
The specific inflation inflection point that would force the Fed away from its “look through” framing is core PPI and CPI beginning to converge toward headline. The highest-value signals are:
- The next one to two PPI and CPI prints, with particular focus on core goods and services most sensitive to energy, and evidence of widening pass-through
- Fed communication shifts: any recalibration of language around “transitory versus persistent” drivers, and any adjustment in the stated balance between inflation and growth risks
- Corporate earnings guidance and margin commentary from energy-intensive sectors, which will provide early real-economy evidence of whether producer-level margin absorption is holding or beginning to break down
Cross-asset positioning considerations
The linked nature of these shocks pushes portfolio construction toward inflation resilience and energy sensitivity analysis. Energy equities and commodities function as natural hedges in this environment, though entry levels carry their own risk given already-elevated premia. Inflation-linked securities such as TIPS stand to benefit if headline surprises persist and inflation expectations rise. A quality and pricing-power bias in equities favours firms with low leverage and limited energy intensity, while shorter duration in fixed income reduces sensitivity to additional rate and term-premium repricing.
Cross-asset conflict dynamics in this cycle have broken from historical precedent in at least one important respect: gold fell 0.8% over the first three months of active hostilities despite ongoing military exchanges, because dollar strength from America’s net energy-exporter advantage and the rate implications of higher oil are simultaneously working against traditional safe-haven demand.
This article is for informational purposes only and should not be considered financial advice. Investors should conduct their own research and consult with financial professionals before making investment decisions.
The two-front challenge does not resolve cleanly, and that is the point
The central analytical insight is structural: oil prices are the coupling mechanism between the geopolitical and inflation shocks, and portfolio frameworks that treat them as independent inputs will systematically underestimate both tail risk and policy uncertainty.
How this resolves depends on two specific conditions. In the escalation scenario, confirmed physical Hormuz disruption or infrastructure damage forces a sharp repricing of crude, accelerates headline-to-core inflation migration, and corners the Fed into a policy response with no good options. In the managed tension scenario, the diplomatic parallel track produces a preliminary agreement while strikes remain episodic and contained, allowing the headline/core gap to narrow gradually.
The market is currently pricing somewhere between these two outcomes. The informational value of the next two to three months lies not in the daily headline flow but in whether core inflation begins to converge toward headline, whether the Fed’s “look through” framing holds, and whether back-channel U.S.-Iran diplomacy produces a preliminary agreement or collapses.
As El-Erian’s margin compression observation underscores, the buffer between a manageable energy shock and a broader inflation problem is real but finite. The framework’s value is not in predicting which scenario wins. It is in recognising the specific conditions under which each becomes dominant.
Past performance does not guarantee future results. Financial projections are subject to market conditions and various risk factors.