Why Oppenheimer’s Tesla Bull Case Skips FSD Entirely
49 mins ago

Lendlease has completed $2.3 billion in asset sales since May 2024, yet its gearing target has ballooned from 15% to the mid-30% range. Those two numbers should not coexist, and the fact that they do tells a story the Lendlease share price has already absorbed: a roughly 50% decline year-to-date as of 11 June 2026, with the company’s market capitalisation now sitting below total loan capital of approximately A$3.33 billion. A single Italian asset sale, announced on 1 June 2026, crystallised a $175 million post-tax operating loss after cash proceeds of $90 million landed against a book value of $265 million. These are not isolated data points. They form a pattern the market is pricing, even as many retail investors still look to earnings guidance for reassurance. What follows uses Lendlease as a working case study to explain what gearing revisions actually signal, how book value gaps translate into equity destruction, and what a practical balance sheet checklist looks like for any Australian listed property developer.
At the May 2024 strategy update, Lendlease reported gearing of 22.9% and outlined a path to 15% through approximately $3 billion in capital recycling. By early June 2026, the target had been revised to the mid-30% range, approximately 34%, after $2.3 billion in completed sales and roughly $2.8 billion announced or completed.
The arithmetic explains the gap. Disposal proceeds did not flow neatly into debt reduction. Instead, they were partly absorbed by three parallel demands on capital:
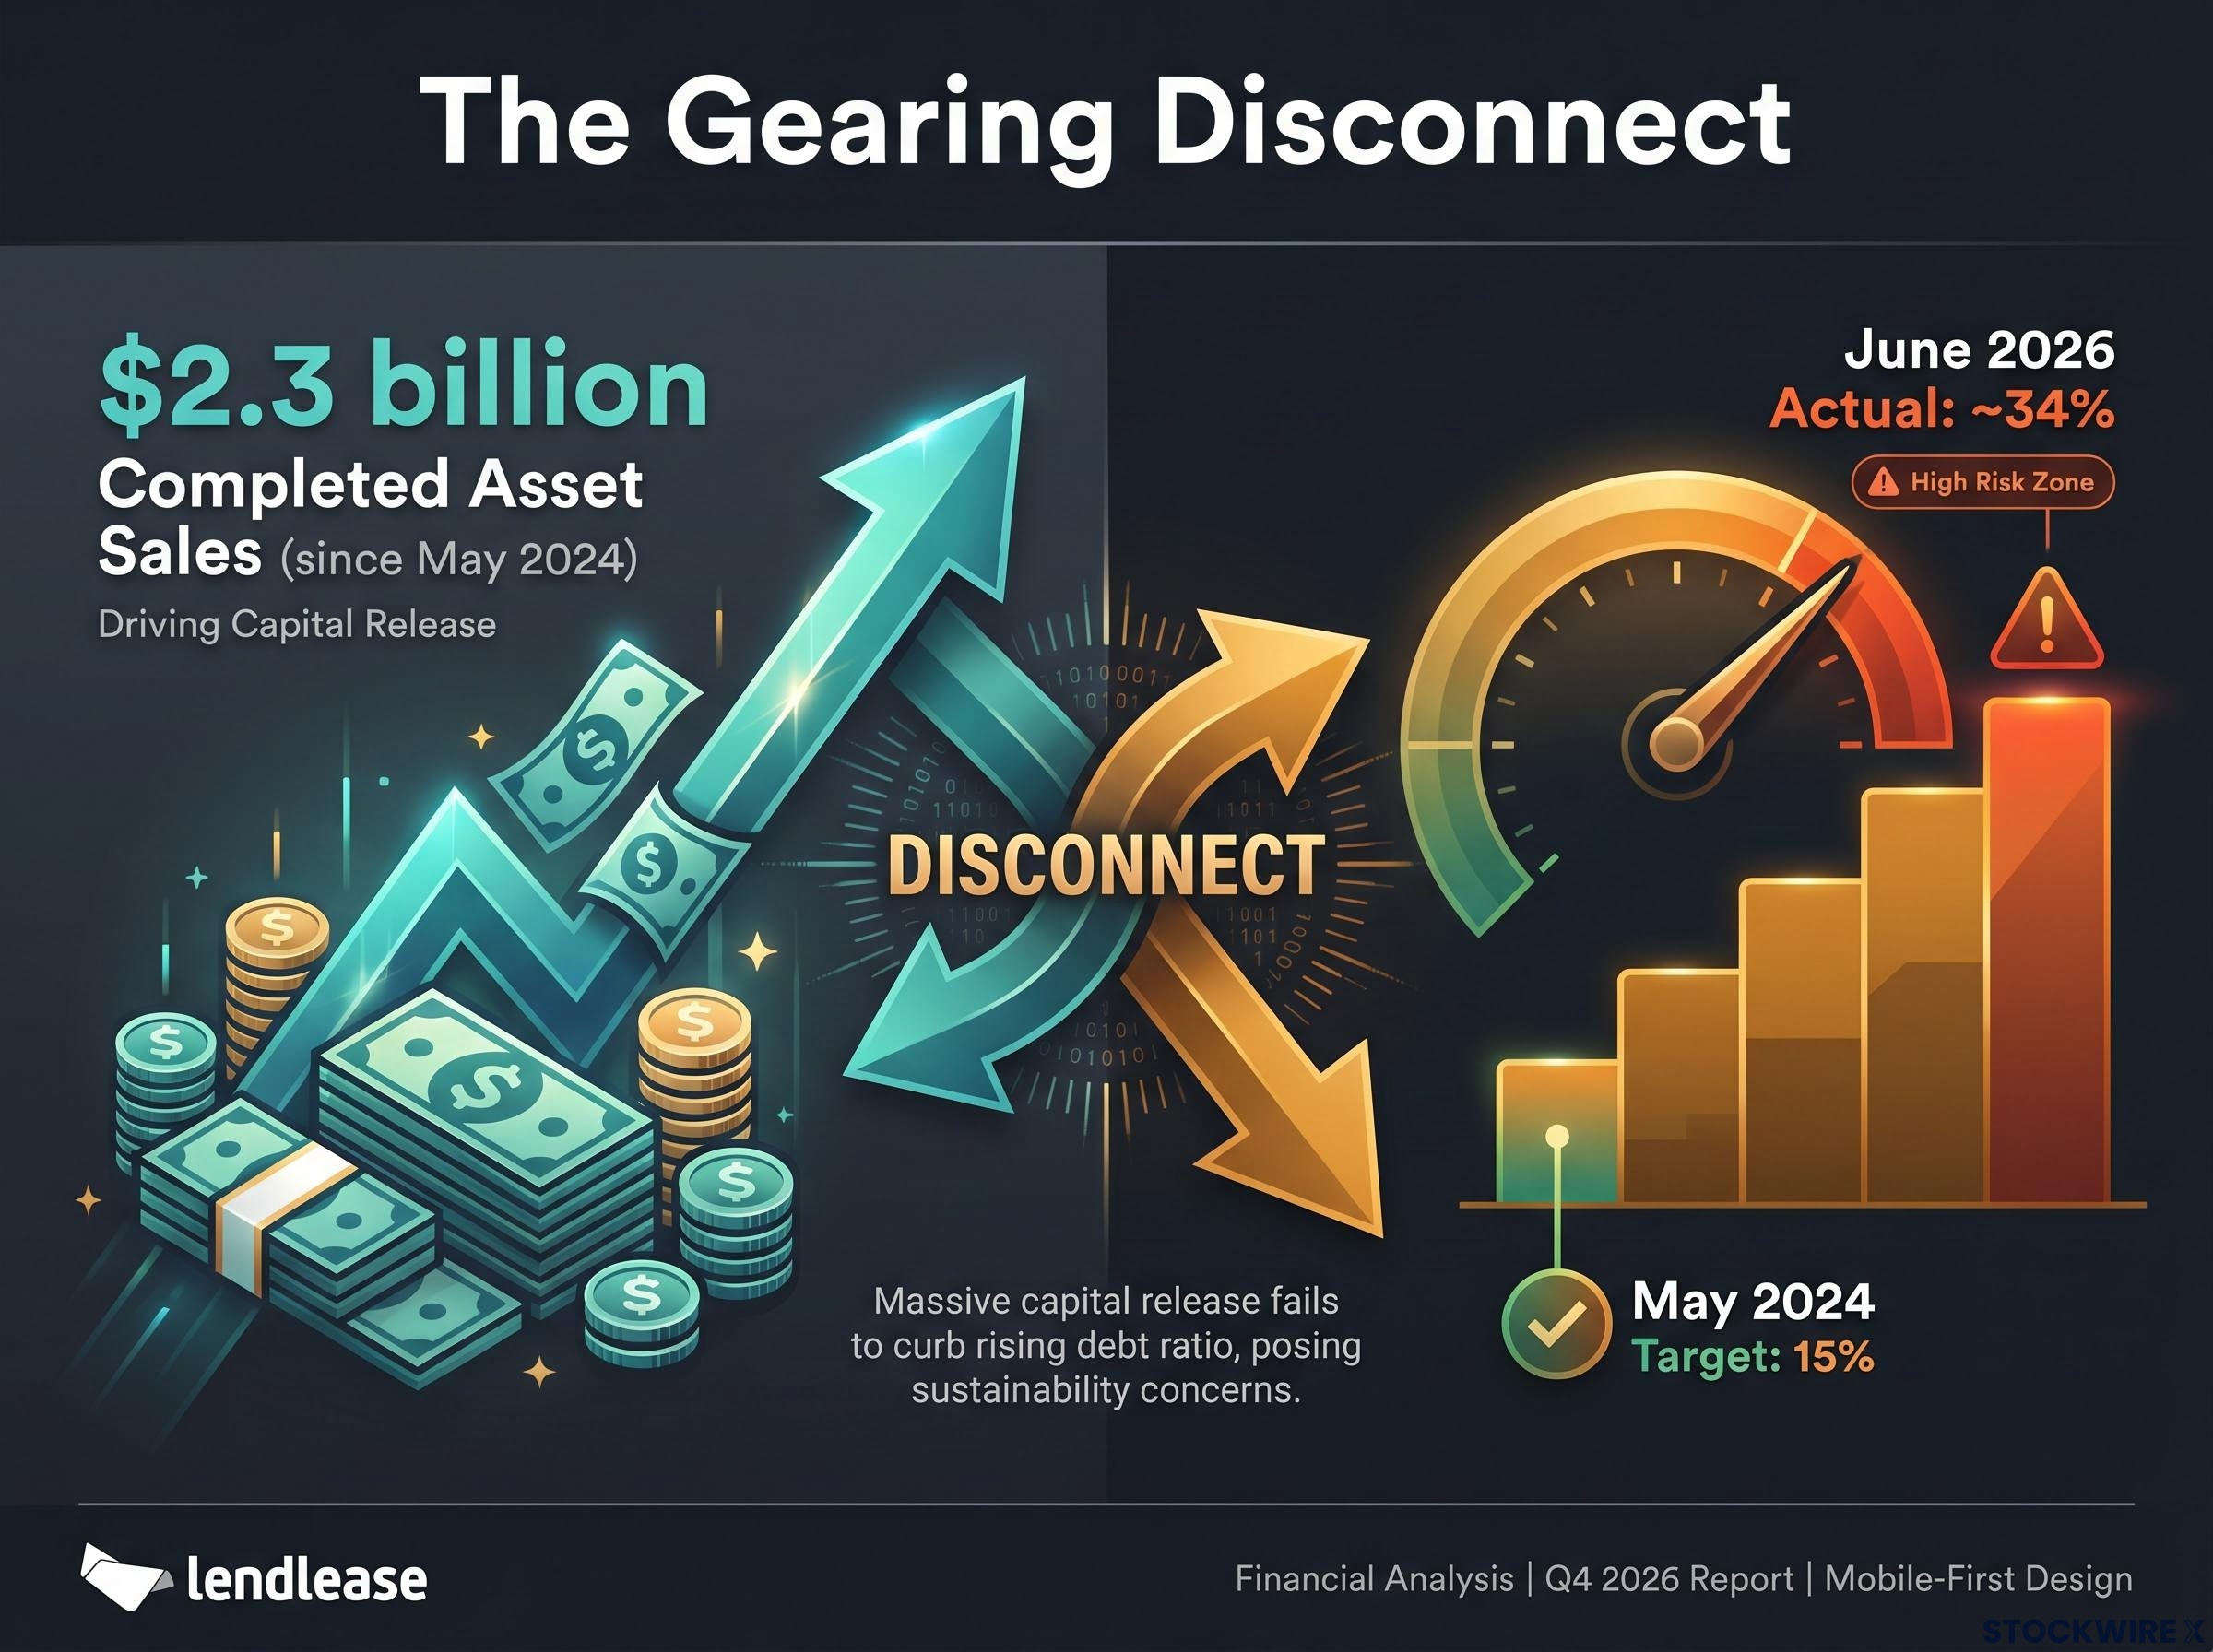
Lendlease revised its gearing target from 15% to the mid-30% range after completing $2.3 billion in asset sales, a revision that reflects the gap between headline disposal values and actual balance sheet improvement.
The lesson is specific but transferable. Retail investors often evaluate deleveraging programmes by headline sale values alone. That shortcut fails when proceeds are simultaneously consumed by ongoing capital commitments, and when the assets themselves sell for less than the balance sheet assumed they were worth.
The numbers tell the story in sequence. Lendlease carried its Milano Santa Giulia North development rights at $265 million on the balance sheet. On 1 June 2026, the company agreed to sell those rights to an investment group sponsored by Bizzi & Partners for cash proceeds of $90 million, with the buyer assuming approximately $160 million in project debt and future remediation obligations. The gross transaction value reached approximately $250 million. The recorded result: a $175 million post-tax operating loss, to be recognised in FY26.
The MSG North transaction involved Lendlease agreeing to transfer its Milano Santa Giulia North development rights to a Bizzi and Partners-sponsored investment group, with the buyer assuming approximately $160 million in project debt alongside the $90 million cash payment, a structure that shifted ongoing remediation obligations off Lendlease’s balance sheet in exchange for accepting the loss.
| Component | Value |
|---|---|
| Book value (carrying amount) | $265 million |
| Cash proceeds to Lendlease | $90 million |
| Buyer-assumed debt and obligations | ~$160 million |
| Post-tax operating loss (FY26) | $175 million |
Management described the sale as at a “significant discount to book value.” That phrase, applied to a single transaction, carries a broader signal. Book values for development assets are derived from historical cost plus capitalised expenditure, supplemented by cap-rate and comparable-transaction models that assume reasonable market liquidity and no forced selling. When the seller is under pressure to de-lever, exit geographies, or meet covenants, buyers can demand steep discounts. The book value reflects yesterday’s assumptions; the sale price reflects today’s risk premium.
Australian commercial real estate transaction volumes reached $49.8 billion in 2025 according to Financial Newswire, a figure that reflects a market rebound but also masks the uneven liquidity conditions across office and development assets where sellers under pressure to de-lever have continued to encounter steep buyer discounts.
The same valuation methodology is applied consistently across Lendlease‘s remaining assets. A discount revealed in one transaction does not prove other assets are overstated, but it invites scrutiny of similar holdings under similar conditions.
Lendlease‘s remaining commercial real estate exposure sits at approximately $1 billion. Even moderate repeated discounts to book across multiple sales would materially slow gearing reduction, because each sale that falls short of its carrying value generates a smaller net debt improvement than the disposal plan assumed. The Milan transaction turned a theoretical risk into a recorded loss, and the portfolio behind it has not yet been tested by the market at the same scale.
In asset-heavy development businesses, reported earnings can remain steady long after the balance sheet has begun to deteriorate. The Lendlease share price decline is the market making exactly that distinction, and understanding why requires separating what each metric captures.
Gearing measures net debt relative to assets or equity. It rises when assets are illiquid, long-dated, or falling in value, and when debt grows faster than equity. Property developers hold large, slow-moving assets: land banks, work-in-progress on long-dated developments, unsold completed stock, and commercial real estate valued using cap rates that shift with interest rates. These assets cannot be liquidated quickly at predictable prices when conditions turn.
Earnings per share guidance, by contrast, captures near-term accounting profit. A company can still report earnings, especially through partial project completions, while cash is being consumed by capital expenditure, debt is rising as projects are funded, and asset values are becoming questionable.
The same limitation applies to stock valuation metrics more broadly: P/E and EPS capture accounting profit across a single period but ignore capital structure, meaning two developers with identical earnings can carry dramatically different risk profiles depending on their leverage and the liquidity of their underlying assets.
Lendlease illustrates this precisely. In 1H FY26, the company swung from a net operating profit of approximately $122 million to an operating loss of approximately $200 million, with segment EBITDA down roughly 40% across Investments, Development, and Construction. Yet FY26 IDC earnings guidance of 28-34 cents per security was maintained.
What EPS guidance captures:
What gearing captures:
Lendlease‘s loan capital of approximately A$3.33 billion now exceeds its market capitalisation of approximately A$1.8-2.1 billion, a signal that the market values the equity at less than the debt sitting above it in the capital structure.

The income statement is a lagging indicator in this context. The balance sheet is where the risk lives, and the share price has responded accordingly.
Morgan Stanley holds an Equal-weight rating on Lendlease with a price target of $3.25, published in early June 2026. Broader consensus, as reported by Stockopedia, sits at Hold. Neither rating represents moderate conviction in a stable investment. In a high-uncertainty context, these ratings map the dispersion of possible outcomes rather than endorse a position.
The downside scenarios analysts flag explicitly are specific and sequential:
The bull case is not abstract. It depends on two or three specific transactions completing at or near book value, on a timeline management controls imperfectly. A successful divestment of the Victoria Cross Office asset is estimated to return between $400 million and $860 million in cash proceeds. Sale of the retirement portfolio could reduce gearing by an estimated 3-5 percentage points. FY27 cash flow improvement is contingent on Capital Release Unit outflows ending and targeted residential settlements occurring as planned.
With shares trading near record lows, around the mid-$2s to low-$3s and an intraday low of $2.90, the Hold consensus reflects a market in which upside requires several execution gates to clear simultaneously, while downside requires only one or two to fail. That is the information the rating carries.
The expectations gap between maintained guidance and a deteriorating balance sheet is the same mechanism that drives share price declines even when companies report profits, because the market prices forward balance sheet risk before the income statement catches up with what asset sales and gearing revisions have already revealed.
The Lendlease case compresses several analytical lessons into a single stock. The following six steps convert those lessons into a transferable framework for evaluating any ASX-listed property developer or capital-heavy business.
This sequence works as a filter. It identifies warning signs before they become share price events, rather than attempting to build a valuation model from the bottom up.
Investors exploring how a well-capitalised ASX developer navigates the same market conditions from a position of strength will find our full explainer on Finbar’s balance sheet approach useful, covering its $69 million cash position, 39% reduction in bank debt, and 81-100% presold project pipeline, metrics that illustrate what the checklist framework looks like when applied to a developer with low gearing and strong presale cover.
Lendlease‘s approximately 50% share price decline is the market pricing balance sheet deterioration that earnings guidance obscured for several reporting periods. The Milano Santa Giulia loss and the gearing revision are not operational failures in isolation. They are the outcome of a capital structure that assumed continuous, liquid asset recycling in markets that turned illiquid.
That assumption is not unique to Lendlease. Any asset-heavy developer navigating a weak-transaction-volume environment faces the same mechanics: disposal proceeds fall short of book, pipeline commitments consume capital regardless, and gearing stays elevated longer than the plan anticipated.
$2.3 billion in completed asset sales. Gearing still near 34%.
The durable takeaway is structural. In leveraged property businesses, the balance sheet is the investment thesis. When it degrades faster than management’s stated remediation timeline, the market corrects ahead of the accounts. That lesson will apply again, to a different developer, in a different cycle.
This article is for informational purposes only and should not be considered financial advice. Investors should conduct their own research and consult with financial professionals before making investment decisions. Past performance does not guarantee future results. Financial projections are subject to market conditions and various risk factors.
Gearing measures net debt relative to assets or equity, and for property developers it is a critical risk indicator because their assets are large, illiquid, and slow to sell at predictable prices. When gearing rises, lenders gain more leverage over the company and refinancing risk increases, which is why Lendlease's revised gearing target of around 34% has been closely watched by investors.
The Lendlease share price has declined roughly 50% year-to-date as of 11 June 2026, driven by a gearing target revision from 15% to the mid-30% range, a $175 million post-tax operating loss on the Milano Santa Giulia North asset sale, and the company's market capitalisation falling below its total loan capital of approximately A$3.33 billion.
Disposal proceeds can be offset by ongoing capital commitments such as development pipeline payments, and if assets sell below their book values the net debt reduction per sale is smaller than planned. At Lendlease, approximately $1 billion in second-half land and development payments consumed proceeds at the same time sales were completing, limiting the gearing improvement.
A sale completed at a significant discount to book value, such as Lendlease's Milano Santa Giulia North sale where $90 million in cash proceeds were received against a $265 million carrying value, suggests that other assets in the portfolio using the same valuation methodology may also be overstated when tested by actual market transactions.
In a high-uncertainty context, Hold and Equal-weight ratings signal a wide dispersion of possible outcomes rather than moderate conviction in a stable investment. Morgan Stanley's Equal-weight rating on Lendlease with a $3.25 price target reflects a thesis that is fragile to execution, meaning upside requires multiple transaction gates to clear while downside requires only one or two to fail.