Micron Confirms HBM4 Deal, Then Falls 7.7% in AI Selloff
1 hr ago

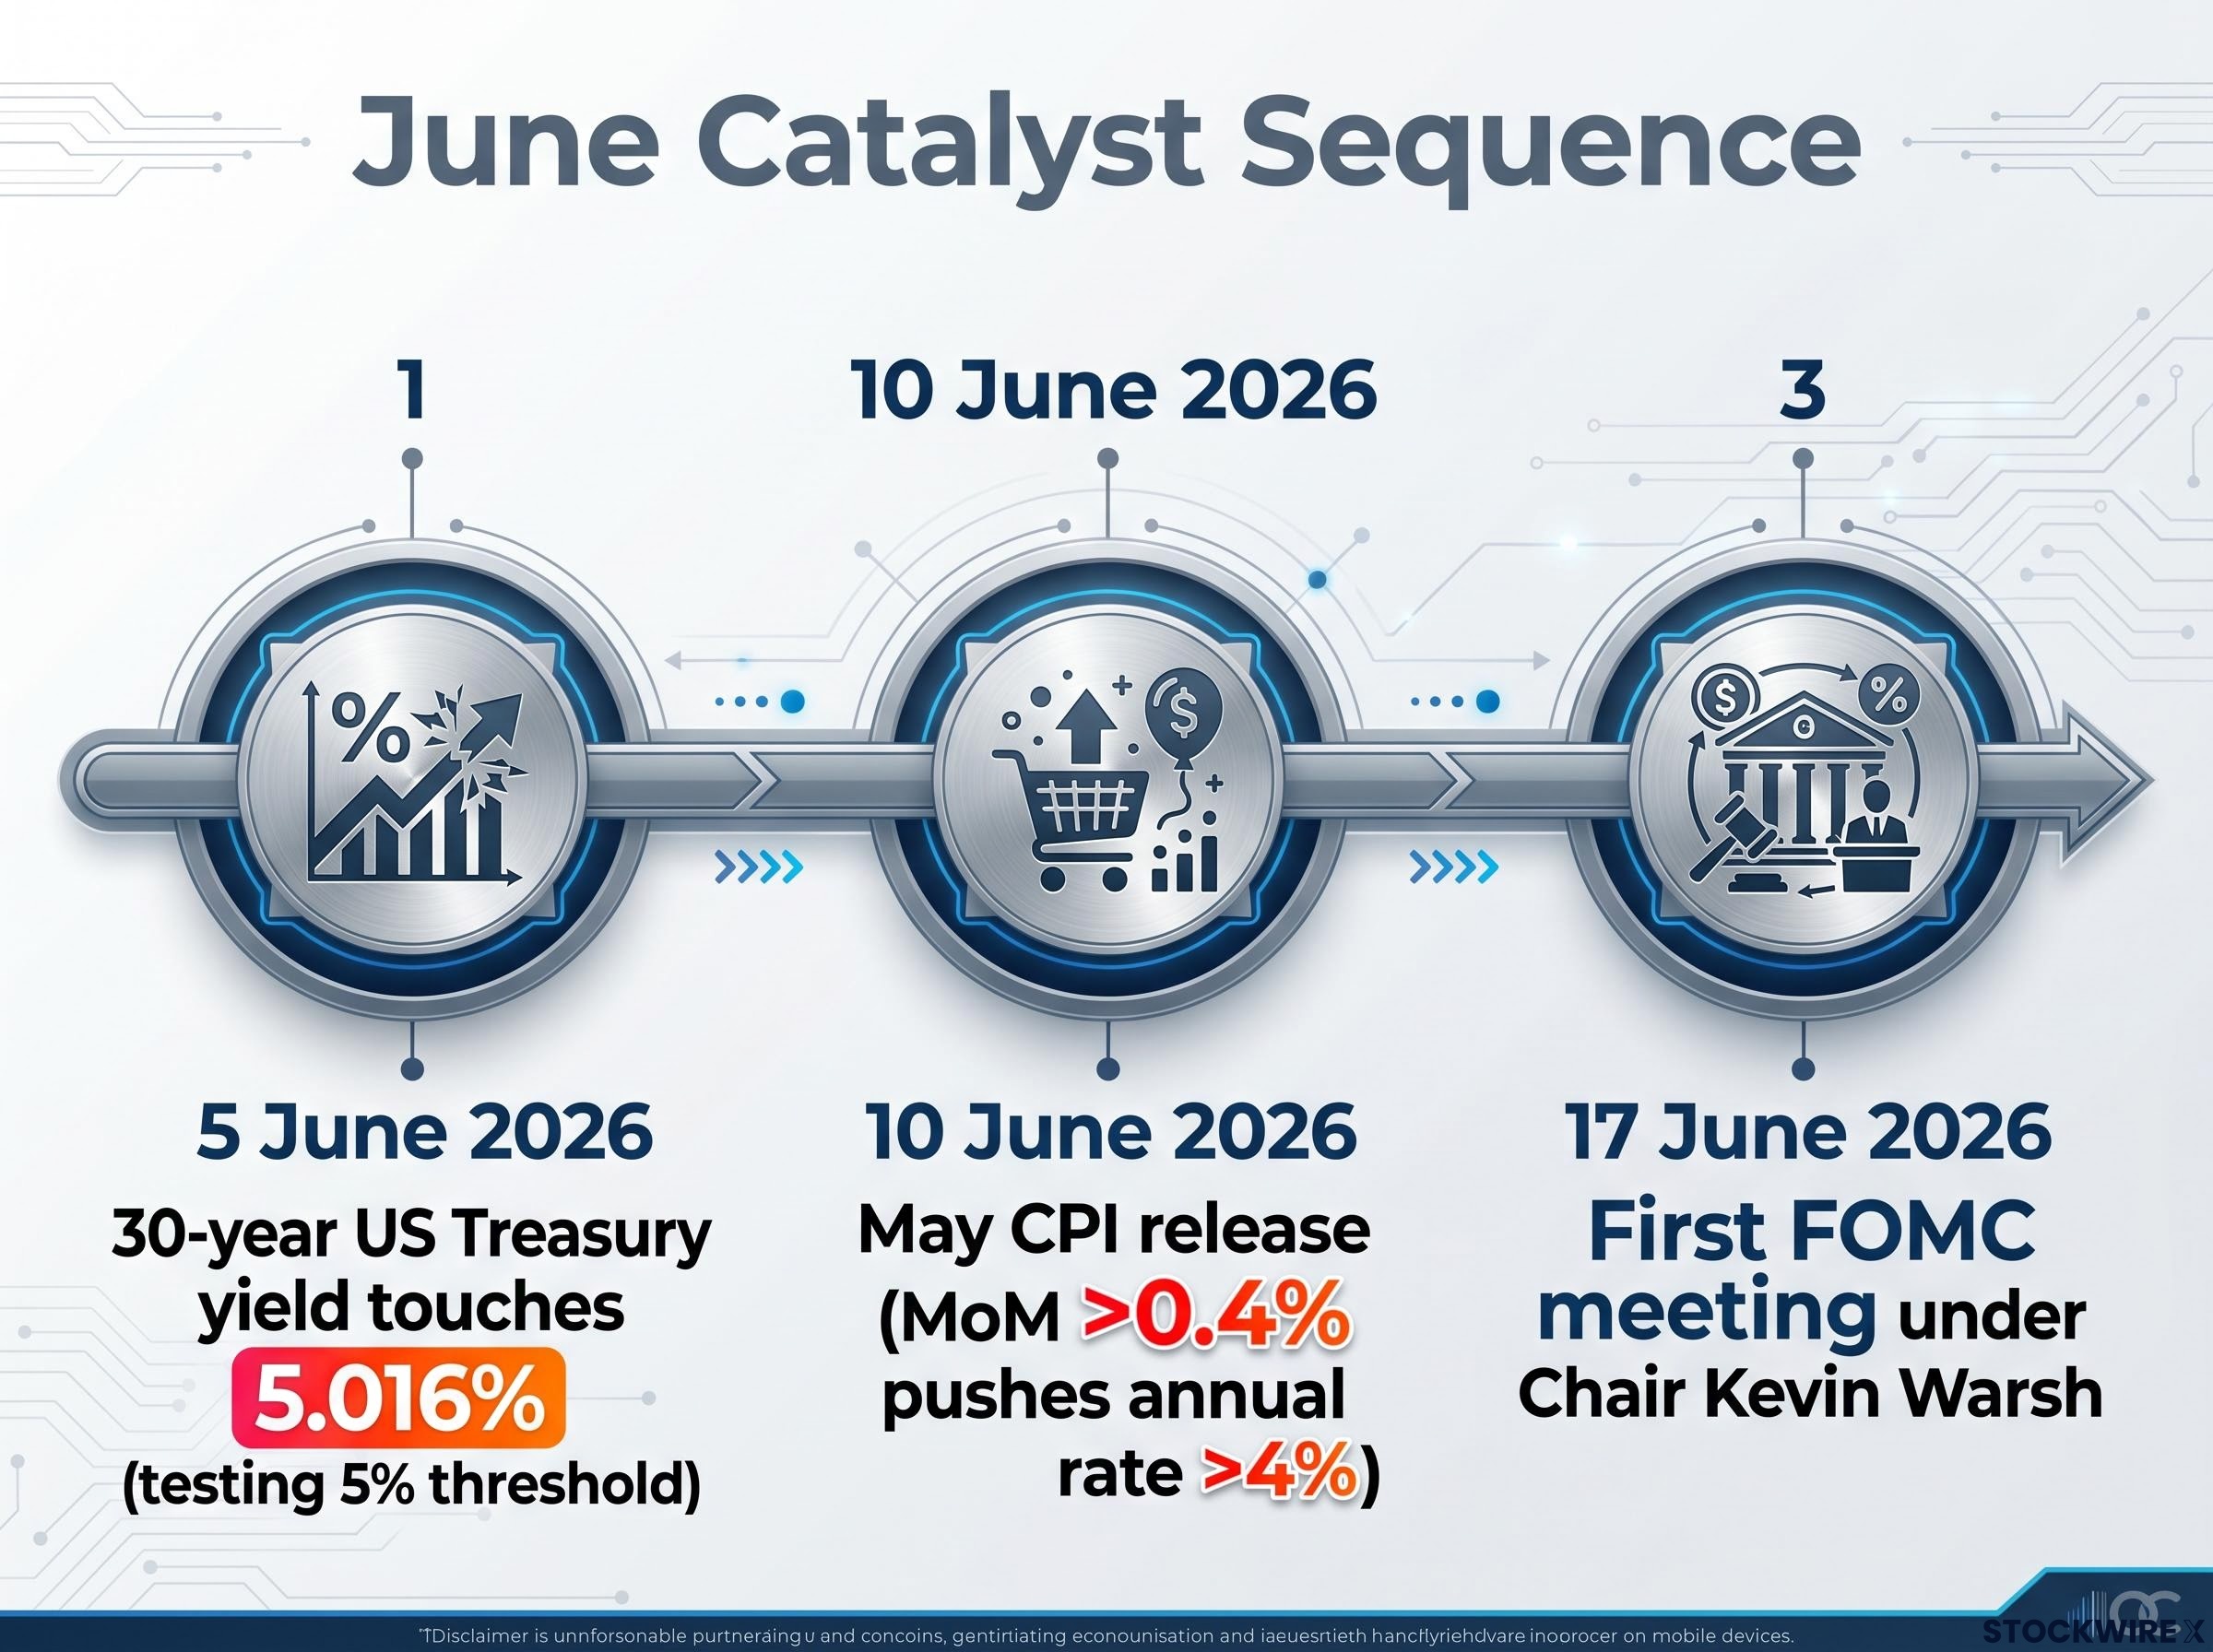
The 30-year US Treasury yield touched 5.016% on 5 June 2026, the exact level that Bank of America’s Michael Hartnett identified today as the threshold where bond markets begin to threaten the equity rally. In his weekly Flow Show note published the same day, Hartnett framed long-end sovereign bond yields as the single largest risk to stocks, with two catalysts arriving in the next 12 days: the June 10 CPI release and the June 17 Federal Open Market Committee (FOMC) meeting, the first chaired by Kevin Warsh. The warning is not a forecast for a distant quarter. The yield level is already being tested, the inflation data is already running hot, and the new Fed chair has not yet spoken. What follows is the specific dual-risk scenario Hartnett outlined, the quantitative levels that matter, and what a century of inflation data says about what comes next.
Hartnett, Bank of America’s chief investment strategist, used his 5 June 2026 Flow Show to deliver a direct warning: a surge in long-term sovereign bond yields is the primary catalyst that could end the current equity rally. The 30-year US Treasury yield closed in the 4.98-5.02% range across the first week of June, with intraday trading on 5 June pushing it to 5.016%, precisely at the threshold Hartnett cited as the danger line.
The equity rally, according to Hartnett, currently rests on two foundations: optimistic investor positioning and positive earnings expectations. A yield spike at the long end of the curve threatens both simultaneously, raising discount rates that compress valuations while signalling tighter financial conditions that weigh on earnings forecasts.
Bond market pressure on policy has become a more direct forcing mechanism than equity drawdowns since at least the April 2026 inflation acceleration, with Wolfe Research, Apollo, and Mohamed El-Erian each concluding that yield levels, not S&P 500 levels, now determine when and whether the White House modifies its economic stance.
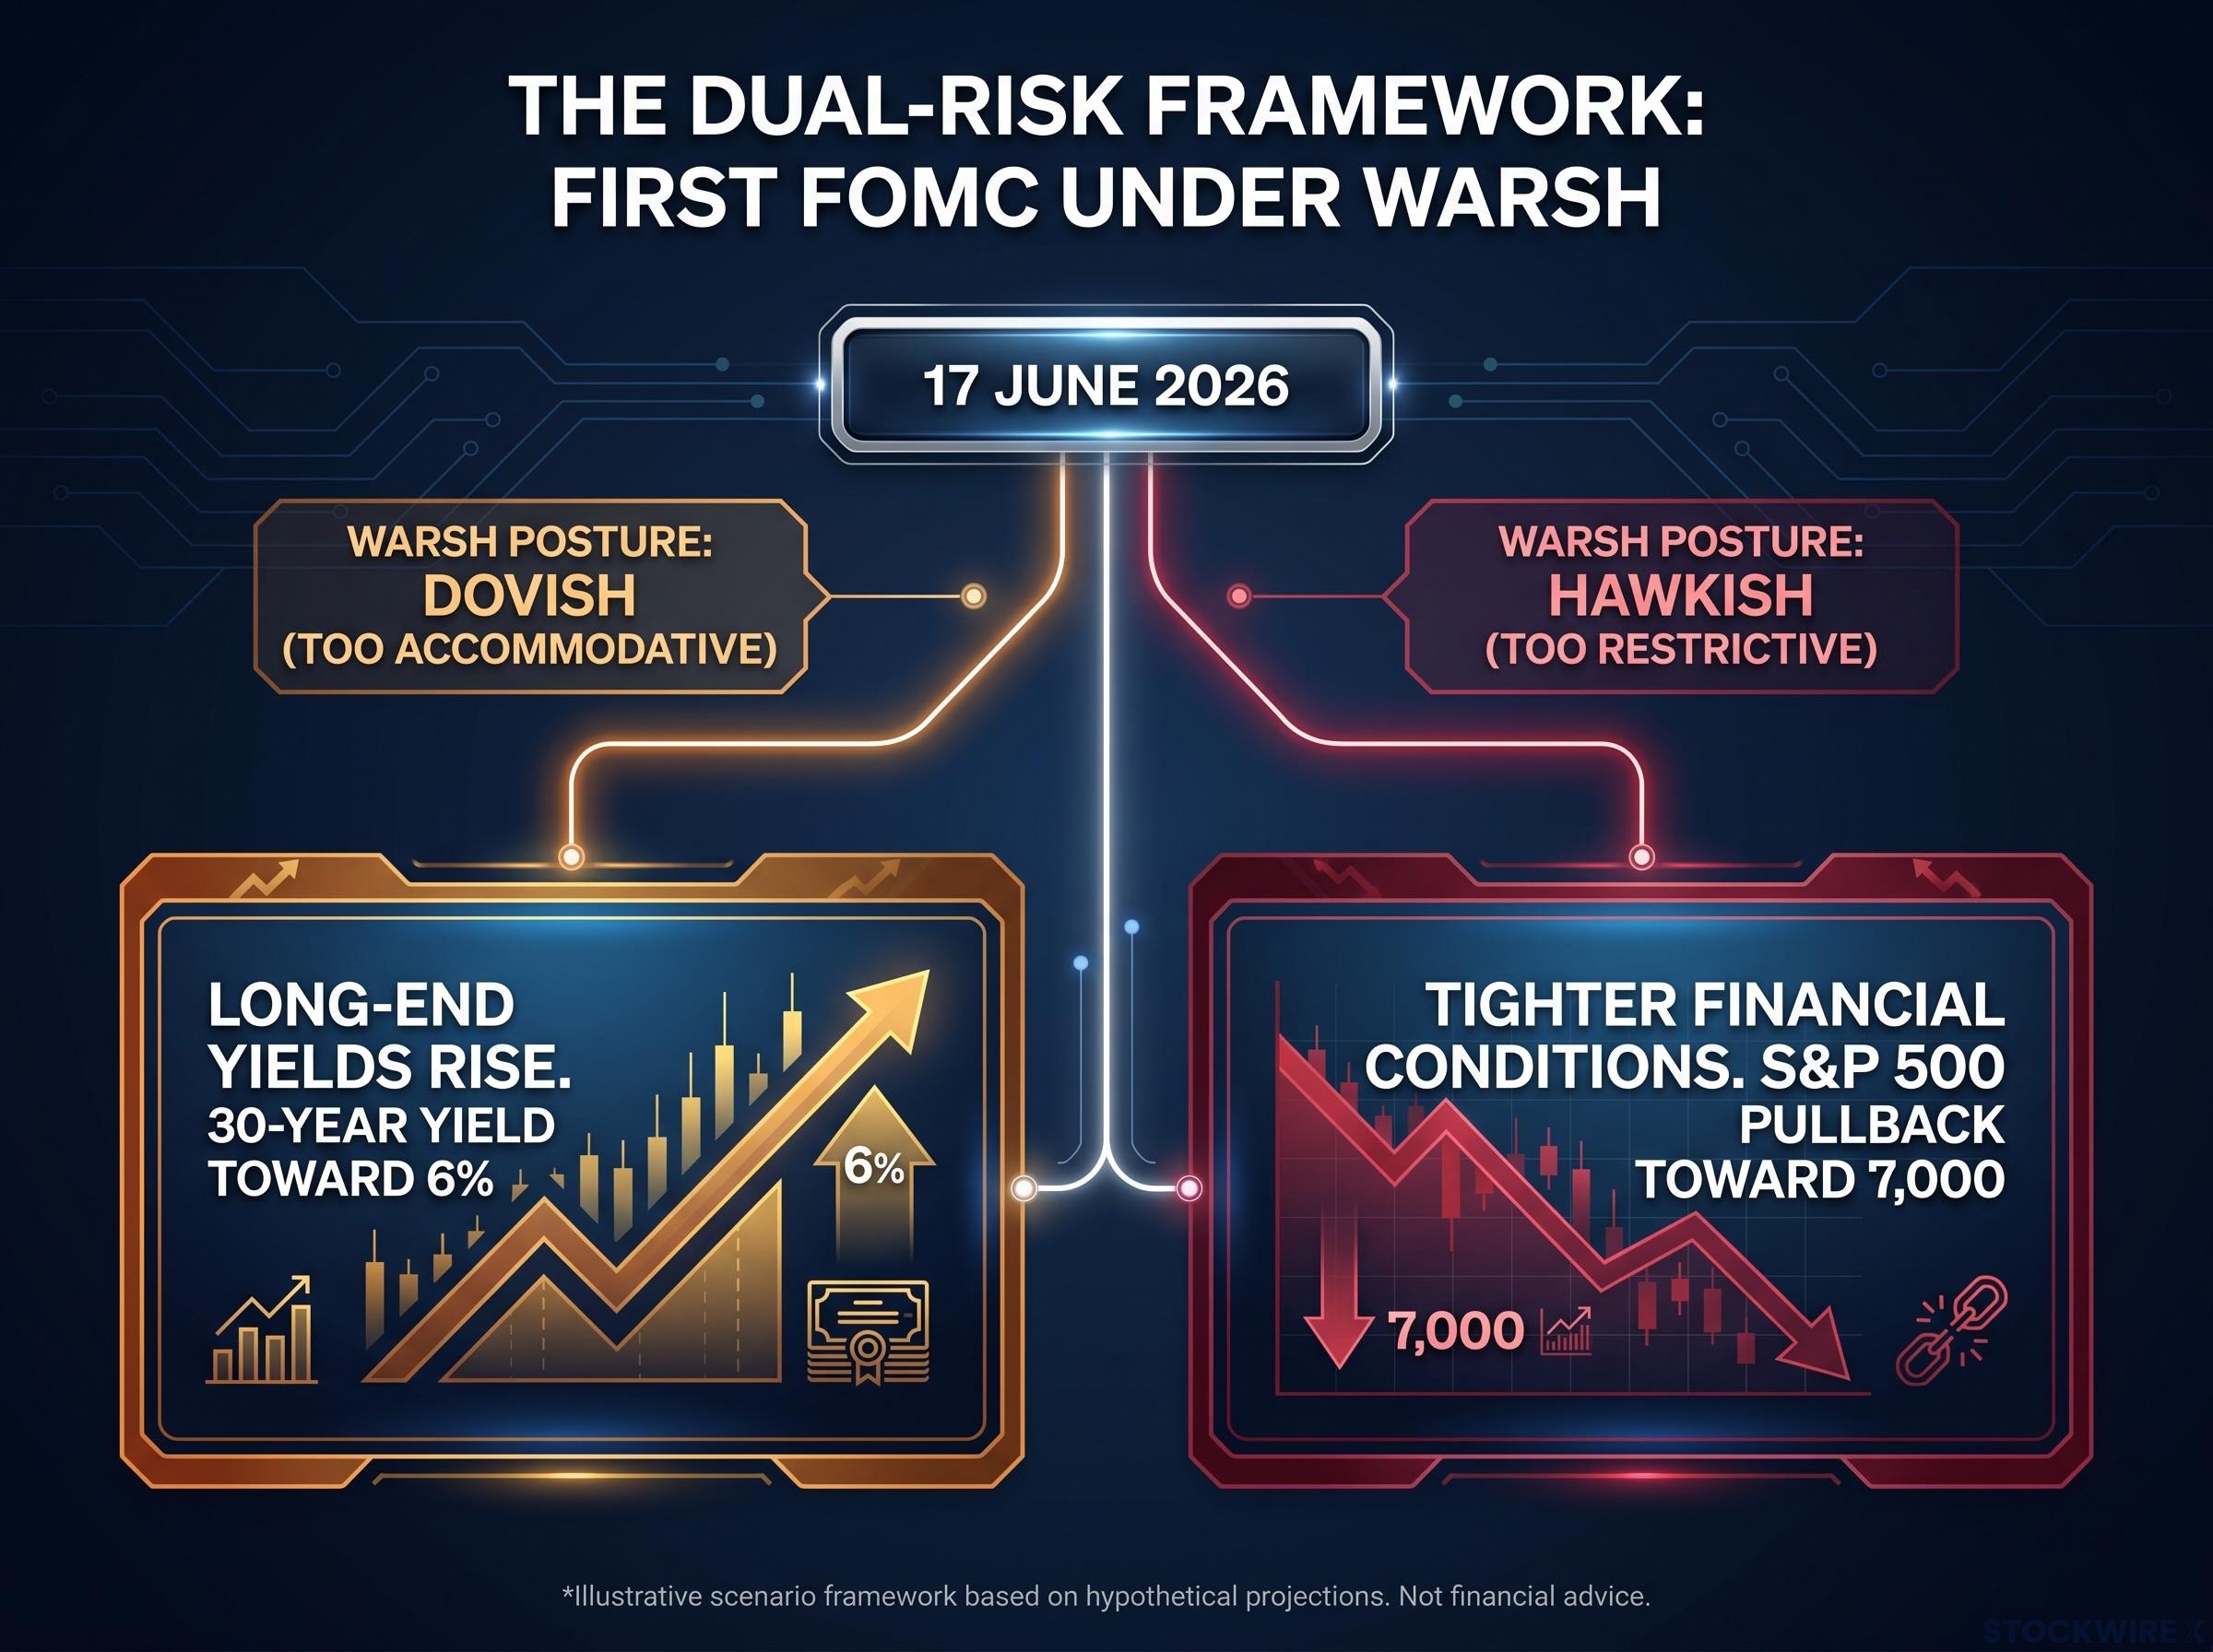
“Warsh too dovish and long-end heads toward 6%; Warsh too hawkish and S&P 500 pullback toward 7,000.” — Michael Hartnett, BofA Flow Show, 5 June 2026
The framing is notable for what it does not contain: a safe scenario. Hartnett is not warning about one direction of policy error. He is warning about both.
Kevin Warsh was sworn in as Federal Reserve Chair on 22 May 2026. His first FOMC meeting is 17 June 2026. Hartnett’s note treats that meeting as a binary risk event, with each branch producing a distinct but negative market outcome.
The FOMC divisions Warsh inherited were already visible before his formal confirmation: April’s meeting produced four dissenting votes, the most at any single Federal Reserve meeting since 1992, with hawks outnumbering the lone dovish dissenter three to one and the 30-year Treasury yield reaching 5.14% on 18 May independently of any rate decision.
In the dovish scenario, Warsh signals excessive accommodation. Bond markets interpret this as inflationary tolerance, and long-end yields are driven toward 6%. Higher discount rates compress equity valuations, particularly in growth-oriented sectors, and trigger a repricing of duration-sensitive portfolios.
In the hawkish scenario, Warsh signals excessive restriction. Financial conditions tighten, growth expectations are revised downward, and the S&P 500 pulls back toward the 7,000 level as corporate earnings forecasts deteriorate.
Hartnett does not assign a probability to either outcome. Both are presented as genuine tail risks stemming from the same starting event: the market’s first real read on Warsh’s policy posture.
| Warsh posture | Market transmission channel | Projected impact |
|---|---|---|
| Dovish (too accommodative) | Long-end yields rise on inflation expectations; discount rates compress equity valuations | 30-year yield toward 6% |
| Hawkish (too restrictive) | Tighter financial conditions weigh on growth and earnings expectations | S&P 500 pullback toward 7,000 |
The investor’s usual hedge, positioning for the “right” Fed outcome, does not apply here. Both branches carry downside, which changes how risk should be priced heading into 17 June.
The first catalyst arrives a full week before Warsh speaks. The Bureau of Labor Statistics is scheduled to release the May 2026 Consumer Price Index on 10 June 2026, and the trailing data suggests a hot print is more than plausible.
The Bureau of Labor Statistics CPI release for April 2026, published on 12 May 2026, confirmed the month-over-month reading of +0.6% and a year-over-year rate of 3.8%, and announced that May 2026 CPI data would be published on 10 June 2026.
The recent inflation trajectory:
Hartnett’s trigger threshold is a May MoM reading above 0.4%. That would push the annual rate above 4%, the level his historical analysis associates with negative equity returns. With the trailing three-month average running at 0.6%, the threshold appears achievable rather than extreme.
The sequencing matters. If the 10 June CPI delivers a hot print, Warsh walks into the 17 June meeting with the inflation narrative already set. His room to signal accommodation narrows. The market’s window to reprice tightens. The first domino falls before the second one is even in play.
Hartnett’s Flow Show draws on approximately 100 years of historical US data to establish a pattern that extends well beyond the current cycle. When annual inflation has exceeded 4%, the S&P 500 has, on average, delivered negative returns at both the three-month and six-month horizons.
When US inflation exceeds 4%, the S&P 500 has averaged a decline of approximately -4% over the subsequent three months and approximately -7% over six months, according to Hartnett’s analysis of roughly a century of historical data.
The pattern does not guarantee a repeat. But it establishes a baseline probability context that weighs against the assumption that equities can shrug off a sustained move above 4% annual inflation.
The inflation impact on equity returns above 4% annual CPI operates through a clear mechanical sequence: persistently high prices force the Fed to hold real rates elevated, which raises the discount rate applied to future earnings and compresses price-to-earnings multiples across the market, with energy, materials, and infrastructure typically the only sectors to show consistent outperformance during sustained above-4% episodes.
The pressure is not confined to the United States. Hartnett’s note flags that 46 of 68 global central banks are currently operating above their inflation targets or the midpoint of their target ranges. That breadth suggests the inflation problem is structural across developed and emerging economies, not a single-country anomaly that US policy alone can resolve.
Yield curves are undergoing bear flattening, consistent with markets beginning to factor in potential rate increases rather than the cuts that drove equity optimism through much of 2025. The combination of elevated inflation across the majority of central bank jurisdictions and a flattening yield curve reinforces Hartnett’s thesis that long-end yields remain vulnerable to further upside pressure.
Hartnett’s note does not stop at US Treasuries. The Flow Show identifies three sovereign bond yield levels as the thresholds where bond market stress begins to affect risk assets globally.
| Country | Sovereign yield maturity | Risk threshold | Current level |
|---|---|---|---|
| United States | 30-year | Above 5% | 4.98-5.02% (testing threshold) |
| United Kingdom | 30-year | Above 6% | Below threshold |
| Japan | 30-year | Above 4% | Below threshold |
The transmission mechanism is consistent across all three: elevated long-end yields at these levels raise discount rates, compress equity valuations in growth-oriented sectors, and can trigger de-risking in duration-sensitive portfolios. The US threshold is already being tested. If stress spreads to UK gilts or Japanese government bonds, the signal shifts from a single-market event to a systemic one.
Investors monitoring only US Treasury yields would miss two-thirds of the framework Hartnett is watching.
For investors wanting to build a fuller picture of the structural forces behind the move, our full explainer on global bond yield dynamics covers the oil-shock transmission mechanism, the breakdown of 60/40 portfolio protection when bonds and equities fall together, and the asset manager responses that have emerged across all three affected markets.
The full scenario compresses into a 12-day window. Two events, arriving in sequence, will either confirm or defuse the tail risks Hartnett outlined.
Hartnett’s framework does not require both catalysts to disappoint simultaneously. Either one acting independently is sufficient to trigger its respective scenario. The CPI print sets the context; the FOMC meeting delivers the verdict.
The 30-year Treasury yield is already at Hartnett’s cited 5% threshold. This is not a scenario for a future quarter; it is a stress test underway in real time. Both the CPI and FOMC catalysts arrive within the next 12 days, compressing the window for markets to adjust positioning.
Hartnett’s Flow Show positions this as the defining risk period for equity markets in June 2026. The outcome hinges on two data points that will be known before the month is half over.
This article is for informational purposes only and should not be considered financial advice. Investors should conduct their own research and consult with financial professionals before making investment decisions. Past performance does not guarantee future results. Financial projections are subject to market conditions and various risk factors.
—
The Hartnett bond yield warning refers to Bank of America strategist Michael Hartnett's alert that a 30-year US Treasury yield above 5% is the threshold where bond market stress begins to threaten the equity rally, by raising discount rates and compressing valuations.
According to Hartnett's analysis of roughly 100 years of historical US data, when annual inflation has exceeded 4%, the S&P 500 has averaged a decline of approximately 4% over the subsequent three months and approximately 7% over six months.
The two catalysts are the May 2026 CPI release on June 10 and the first FOMC meeting under new Fed Chair Kevin Warsh on June 17; a hot CPI print above 0.4% month-over-month would push the annual inflation rate above 4% and narrow Warsh's policy options heading into the following week.
If Warsh signals too much accommodation, bond markets may interpret it as inflationary tolerance, driving the 30-year yield toward 6% and compressing equity valuations; if he signals too much restriction, tighter financial conditions weigh on growth expectations and could pull the S&P 500 back toward 7,000.
Hartnett's framework flags three thresholds: the US 30-year yield above 5% (currently being tested), the UK 30-year gilt above 6%, and the Japanese 30-year government bond above 4%, with stress spreading to UK or Japanese markets signalling a systemic rather than single-country event.