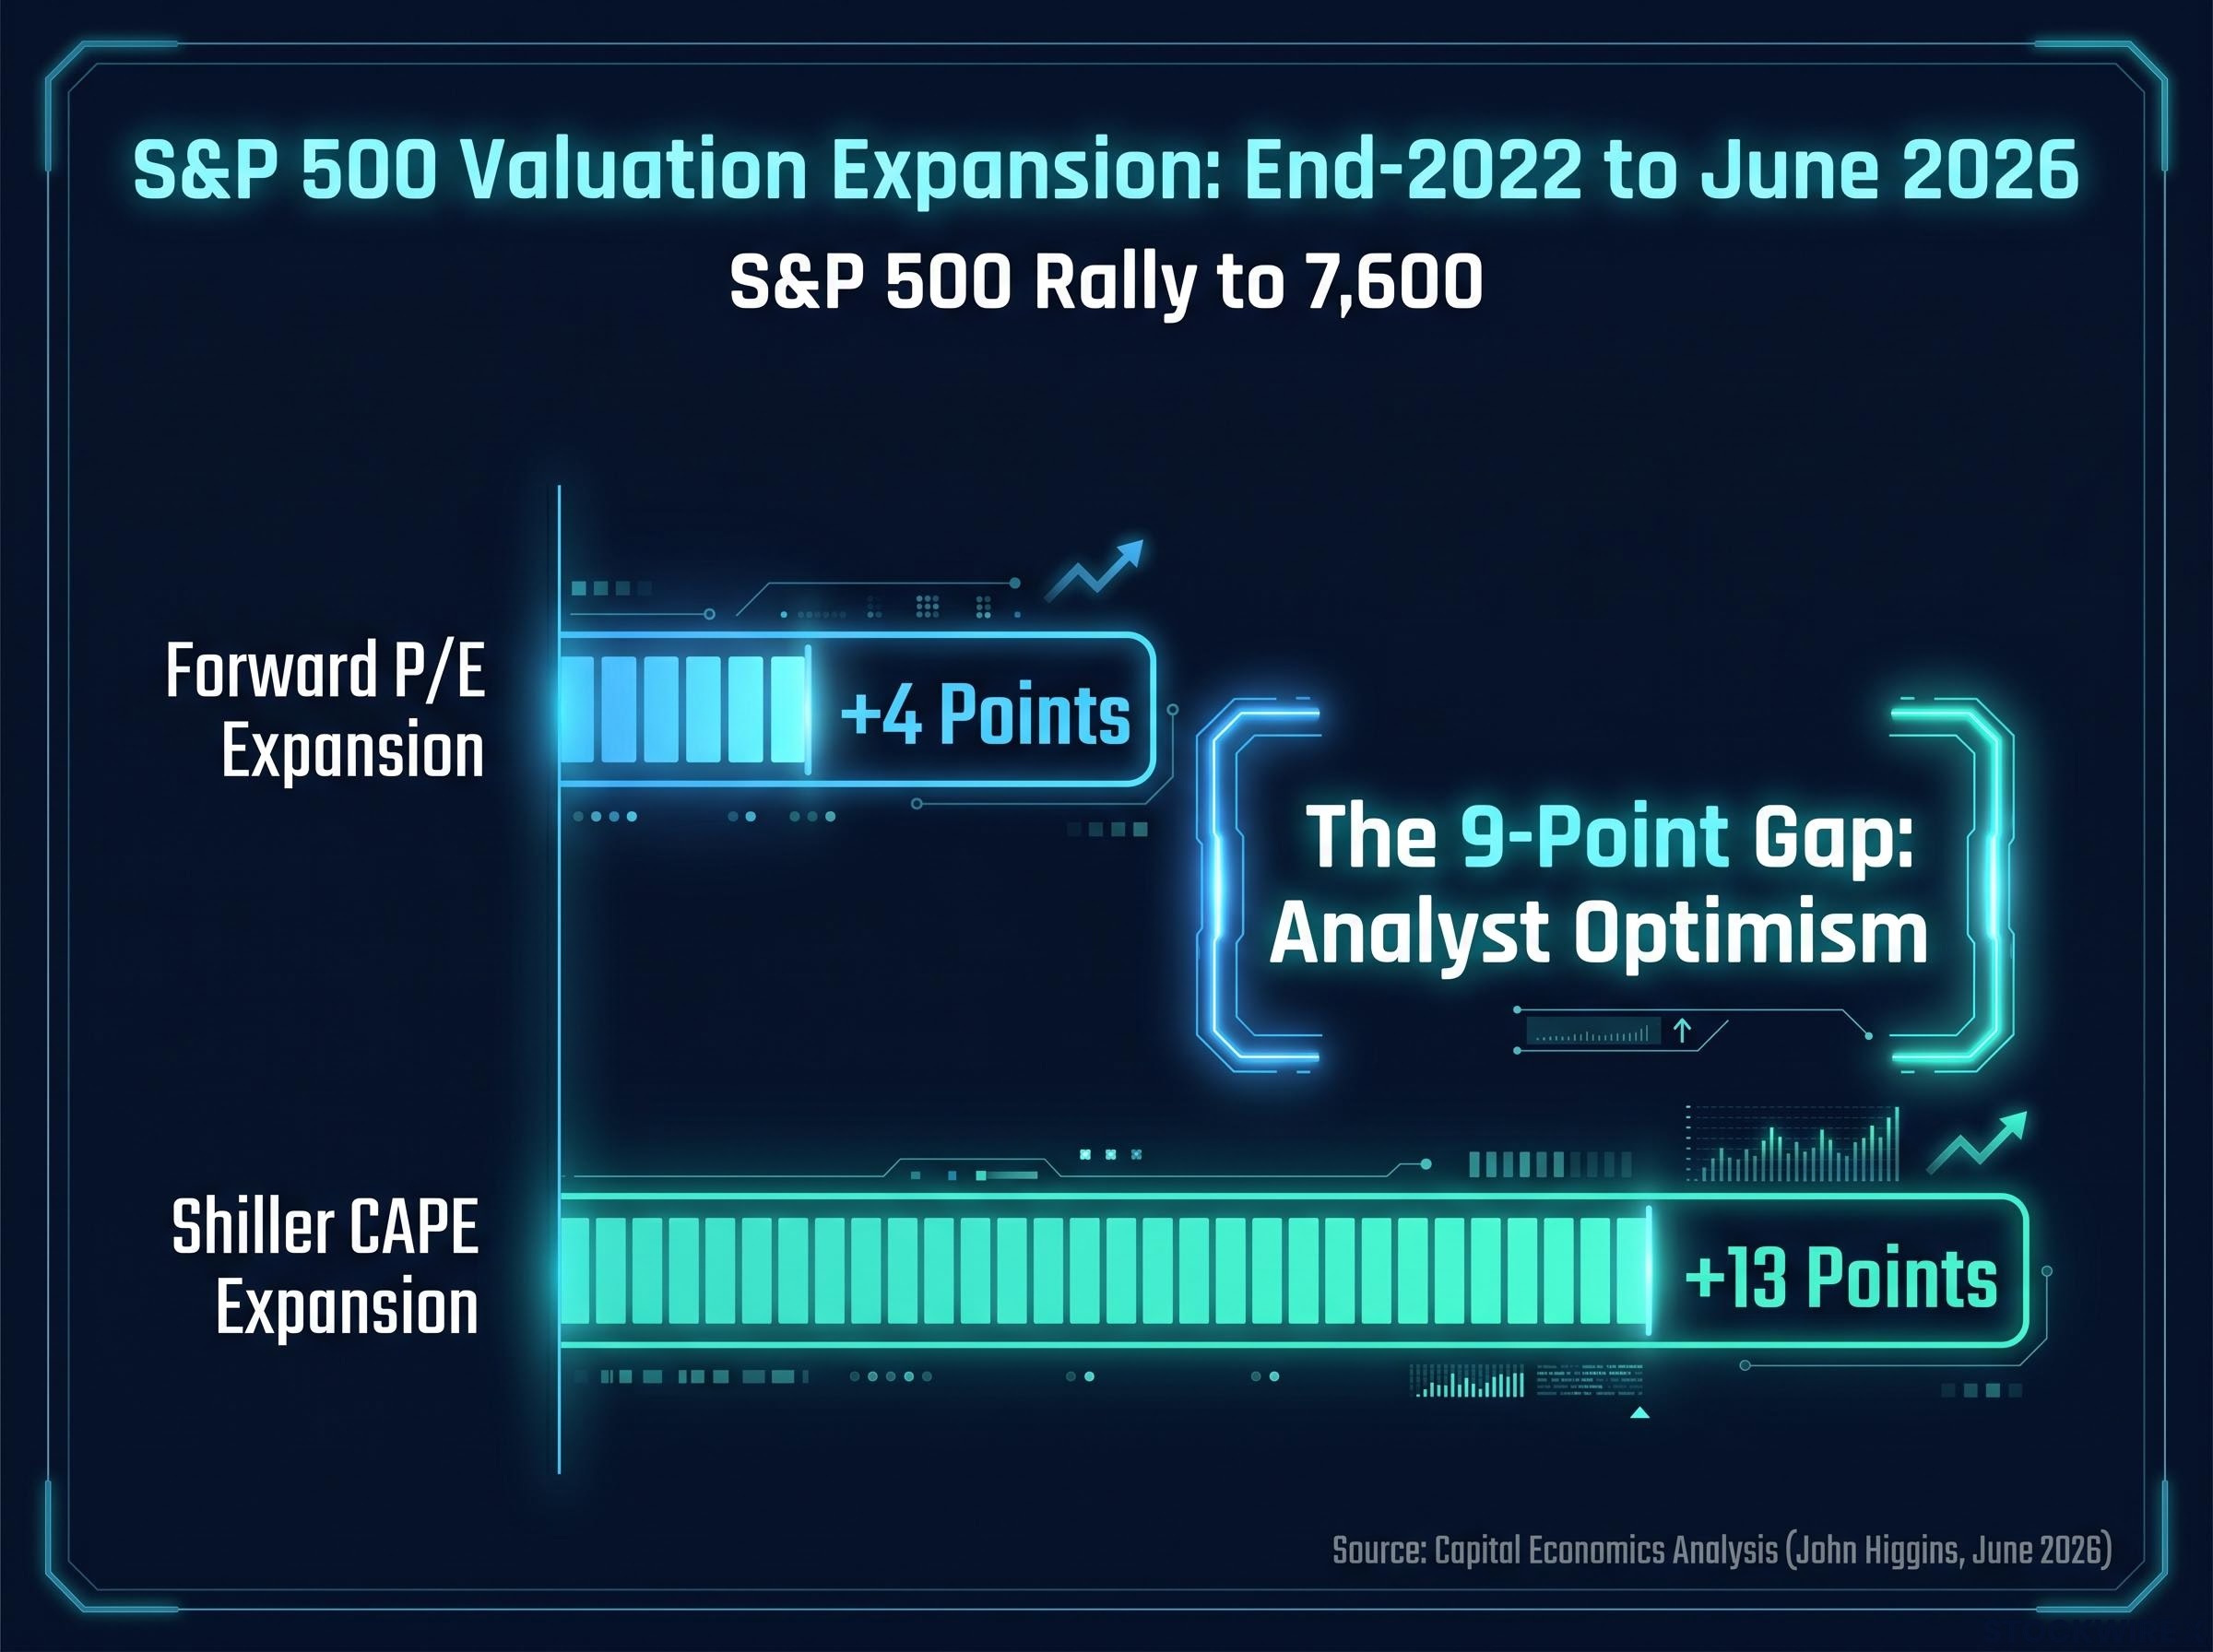
The S&P 500 crossed 7,600 for the first time in early June 2026. Whether that milestone represents one of the strongest earnings cycles in a generation or one of the most stretched valuations in market history depends entirely on which number an investor reads first.
A Capital Economics analysis published in early June 2026, authored by Chief Economic Adviser John Higgins, makes the divide unusually visible. The forward price-to-earnings ratio has expanded by roughly 4 points since end-2022. The Shiller CAPE has expanded by roughly 13 points over the same period. Both metrics measure the same index at the same price. The gap between them is not noise; it is a structural disagreement about what earnings actually are.
What follows is an explanation of how each metric works, why they diverge so sharply in an AI-driven market environment, what each framework’s reading implies about current risk, and what investors should do when two valuation signals point in opposite directions.
Two numbers, two verdicts on the same rally
The S&P 500 closed at 7,609.78 on 2 June 2026. Capital Economics measured the rally from end-2022 through that milestone and produced two readings that tell entirely different stories about how the market arrived there.
According to Capital Economics analysis by John Higgins, the forward P/E multiple expanded by approximately 4 points since end-2022, while the Shiller CAPE expanded by approximately 13 points over the same period.
Neither framework is broken. Both are internally consistent given their premises. The divergence arises because each metric uses a fundamentally different definition of earnings, and those definitions absorb AI-era optimism at very different speeds.
The two competing verdicts look like this:
- Forward P/E reading: The rally has been largely earnings-driven. Corporate profit growth has done most of the lifting, with only modest multiple expansion. The market is paying somewhat more for earnings, but earnings themselves have grown substantially.
- CAPE reading: The rally has been predominantly speculative. Valuation multiples have expanded dramatically, and the bulk of the index’s gain reflects investors paying higher prices relative to realised, inflation-adjusted profits.
The same company, at the same share price, produces these opposing conclusions. The rest of this article explains precisely why.
When big ASX news breaks, our subscribers know first
How the forward P/E ratio works, and what it sees in this market
The forward P/E ratio divides the current index price by consensus analyst forecasts for earnings per share over the next 12 months. It is the metric most commonly cited during earnings season, in broker notes, and in financial media coverage of whether stocks are “expensive” or “cheap.”
As of early 2025, the S&P 500 forward P/E stood at approximately 21x, according to data reported by the Wall Street Journal’s Karen Langley in April 2025, citing FactSet. That compares with a 10-year average of approximately 18x.
Current benchmark: Forward P/E of approximately 21x versus a 10-year average of approximately 18x (Wall Street Journal, April 2025, citing FactSet) and a long-term median closer to 16x (Invesco, March 2025).
The reading is above average, but it is not extreme by recent standards. The reason lies in how the denominator moves.
The P/E ratio blind spots that most commonly mislead investors include its inability to account for capital structure, its dependence on accounting earnings rather than cash generation, and its complete failure as a tool for loss-making companies; each limitation becomes more consequential when the metric is used in isolation to assess a market at record valuations.
What analyst consensus revisions do to the forward multiple
When a powerful narrative enters the market, analyst earnings estimates respond. The AI productivity story has driven substantial upward revisions to 2025 and 2026 earnings-per-share forecasts, as analysts incorporate expectations for margin expansion and revenue acceleration across technology and adjacent sectors.
Those upward revisions enlarge the denominator of the forward P/E calculation. As the denominator grows alongside the numerator (price), the ratio stays relatively compressed, even during a sharp rally. This is not a flaw in the metric; it is how the metric is designed to work. It prices in the market’s best current estimate of near-term profitability.
The Goldman Sachs EPS forecasts for 2026-2027 place S&P 500 earnings at $340 and $385 respectively, with AI-infrastructure beneficiaries expected to account for roughly half of the index’s earnings growth, illustrating precisely how AI optimism flows into analyst consensus estimates and compresses the forward P/E denominator.
The risk, as Invesco’s March 2025 analysis explicitly identifies, is that optimistic analyst earnings expectations during boom periods can distort the forward P/E, making valuations appear more reasonable than they may prove to be if those forecasts are not met.
How the Shiller CAPE works, and why it reads the same rally differently
The cyclically adjusted price-to-earnings ratio, known as CAPE, was developed by Robert Shiller. It divides the current index price by the average of the prior 10 years of real, inflation-adjusted earnings.
The purpose of the 10-year smoothing window is to average across a full business cycle. In any given year, earnings can spike during a boom or collapse during a recession. CAPE removes those single-year distortions by using a decade of realised results.
As of end-February 2025, the S&P 500 CAPE stood at approximately 37.2x, according to Invesco’s March 2025 analysis using Datastream and Shiller-style methodology. Invesco’s composite U.S. market CAPE registered even higher at 41.1x. Data aggregators tracking Shiller’s series placed the CAPE at approximately 39.58 as of May 2026, though this figure has not been independently verified.
CAPE at historic extremes has a precise historical reference point: the only reading higher than today’s 39-40x range was the dot-com peak of 44.2, reached during an era when the top 10 S&P 500 constituents represented approximately 27% of the index, compared with 40-43% today, a concentration shift that makes the current episode structurally distinct from any previous comparison period.
The trajectory from roughly 37x in early 2025 to readings near 39-40x by mid-2026 is consistent with the Capital Economics finding of approximately 13 points of CAPE expansion since end-2022.
| Dimension | Forward P/E | CAPE (Shiller) |
|---|---|---|
| Definition | Price ÷ consensus forecast EPS (next 12 months) | Price ÷ average of 10 years of real, inflation-adjusted EPS |
| Earnings basis | Forward-looking analyst estimates | Backward-looking realised earnings |
| Current reading (early 2025) | Approximately 21x | Approximately 37.2x |
| Expansion since end-2022 | Approximately 4 points | Approximately 13 points |
Why AI-driven earnings optimism flows through forward P/E but not CAPE
The denominator mechanics explain the entire gap. Forward P/E’s denominator updates in real time as analysts revise their forecasts. When consensus EPS rises sharply on AI optimism, the denominator expands immediately, absorbing much of the price increase and limiting apparent multiple expansion.
CAPE’s denominator is a 10-year rolling average of realised, inflation-adjusted earnings. It moves slowly by design. A sharp upward revision in forward EPS has almost no short-term effect on this denominator, because the earnings have not yet been reported, let alone averaged across a decade. CAPE therefore rises with price, recording the full extent of the multiple expansion that forward P/E partially absorbs.
The case for and against each framework at current valuations
The defence of CAPE
Invesco’s March 2025 paper, “The Shiller P/E and S&P 500 returns revisited,” provides the most recent comprehensive institutional defence of the framework. The authors tested CAPE’s relationship with forward 10-year returns from 1926 to 2017 and found that the metric retains significant explanatory power across the full sample. The Wharton Jacobs Levy Center has described CAPE as “by far the most consistent predictor of subsequent equity returns.”
The two strongest arguments for CAPE’s relevance at current levels:
- Empirical predictive power across 90 years of data. Even after adjusting for accounting changes, sector composition shifts, profit margin expansion, and interest-rate regimes, Invesco finds that Shiller-style measures continue to be a reliable predictor of long-term real and nominal stock returns.
- Independence from analyst forecast optimism. Because CAPE does not incorporate forward estimates, it is not subject to the same upward bias that can inflate the denominator of forward P/E during narrative-driven booms.
The critiques of CAPE
Three structural objections recur in the institutional literature:
- GAAP accounting distortion. Jeremy Siegel has argued that changes in accounting standards, particularly more aggressive write-downs during recessions, depress reported earnings in downturns and inflate the 10-year average denominator, making CAPE appear structurally higher than it was in earlier eras.
- Sector-mix change. The S&P 500 contains a far greater proportion of high-margin technology companies today than in prior decades, which may justify a structurally higher CAPE.
- Capital-allocation shifts. Shareholder-friendly buyback programmes and dividend policies have changed the relationship between reported earnings and total shareholder returns, potentially rendering historical CAPE comparisons less direct.
The Financial Analysts Journal research on CAPE accounting distortions identifies mark-to-market rules introduced since the 1990s as a source of systematic downward bias in reported GAAP earnings during recessions, lending peer-reviewed weight to Siegel’s argument that the CAPE denominator may reflect structurally more conservative earnings figures than those used in earlier historical periods.
Invesco’s empirical response to these critiques is direct: even incorporating these structural shifts, CAPE remains useful for long-horizon return expectations. The adjustments reduce the metric’s signal somewhat but do not eliminate it.
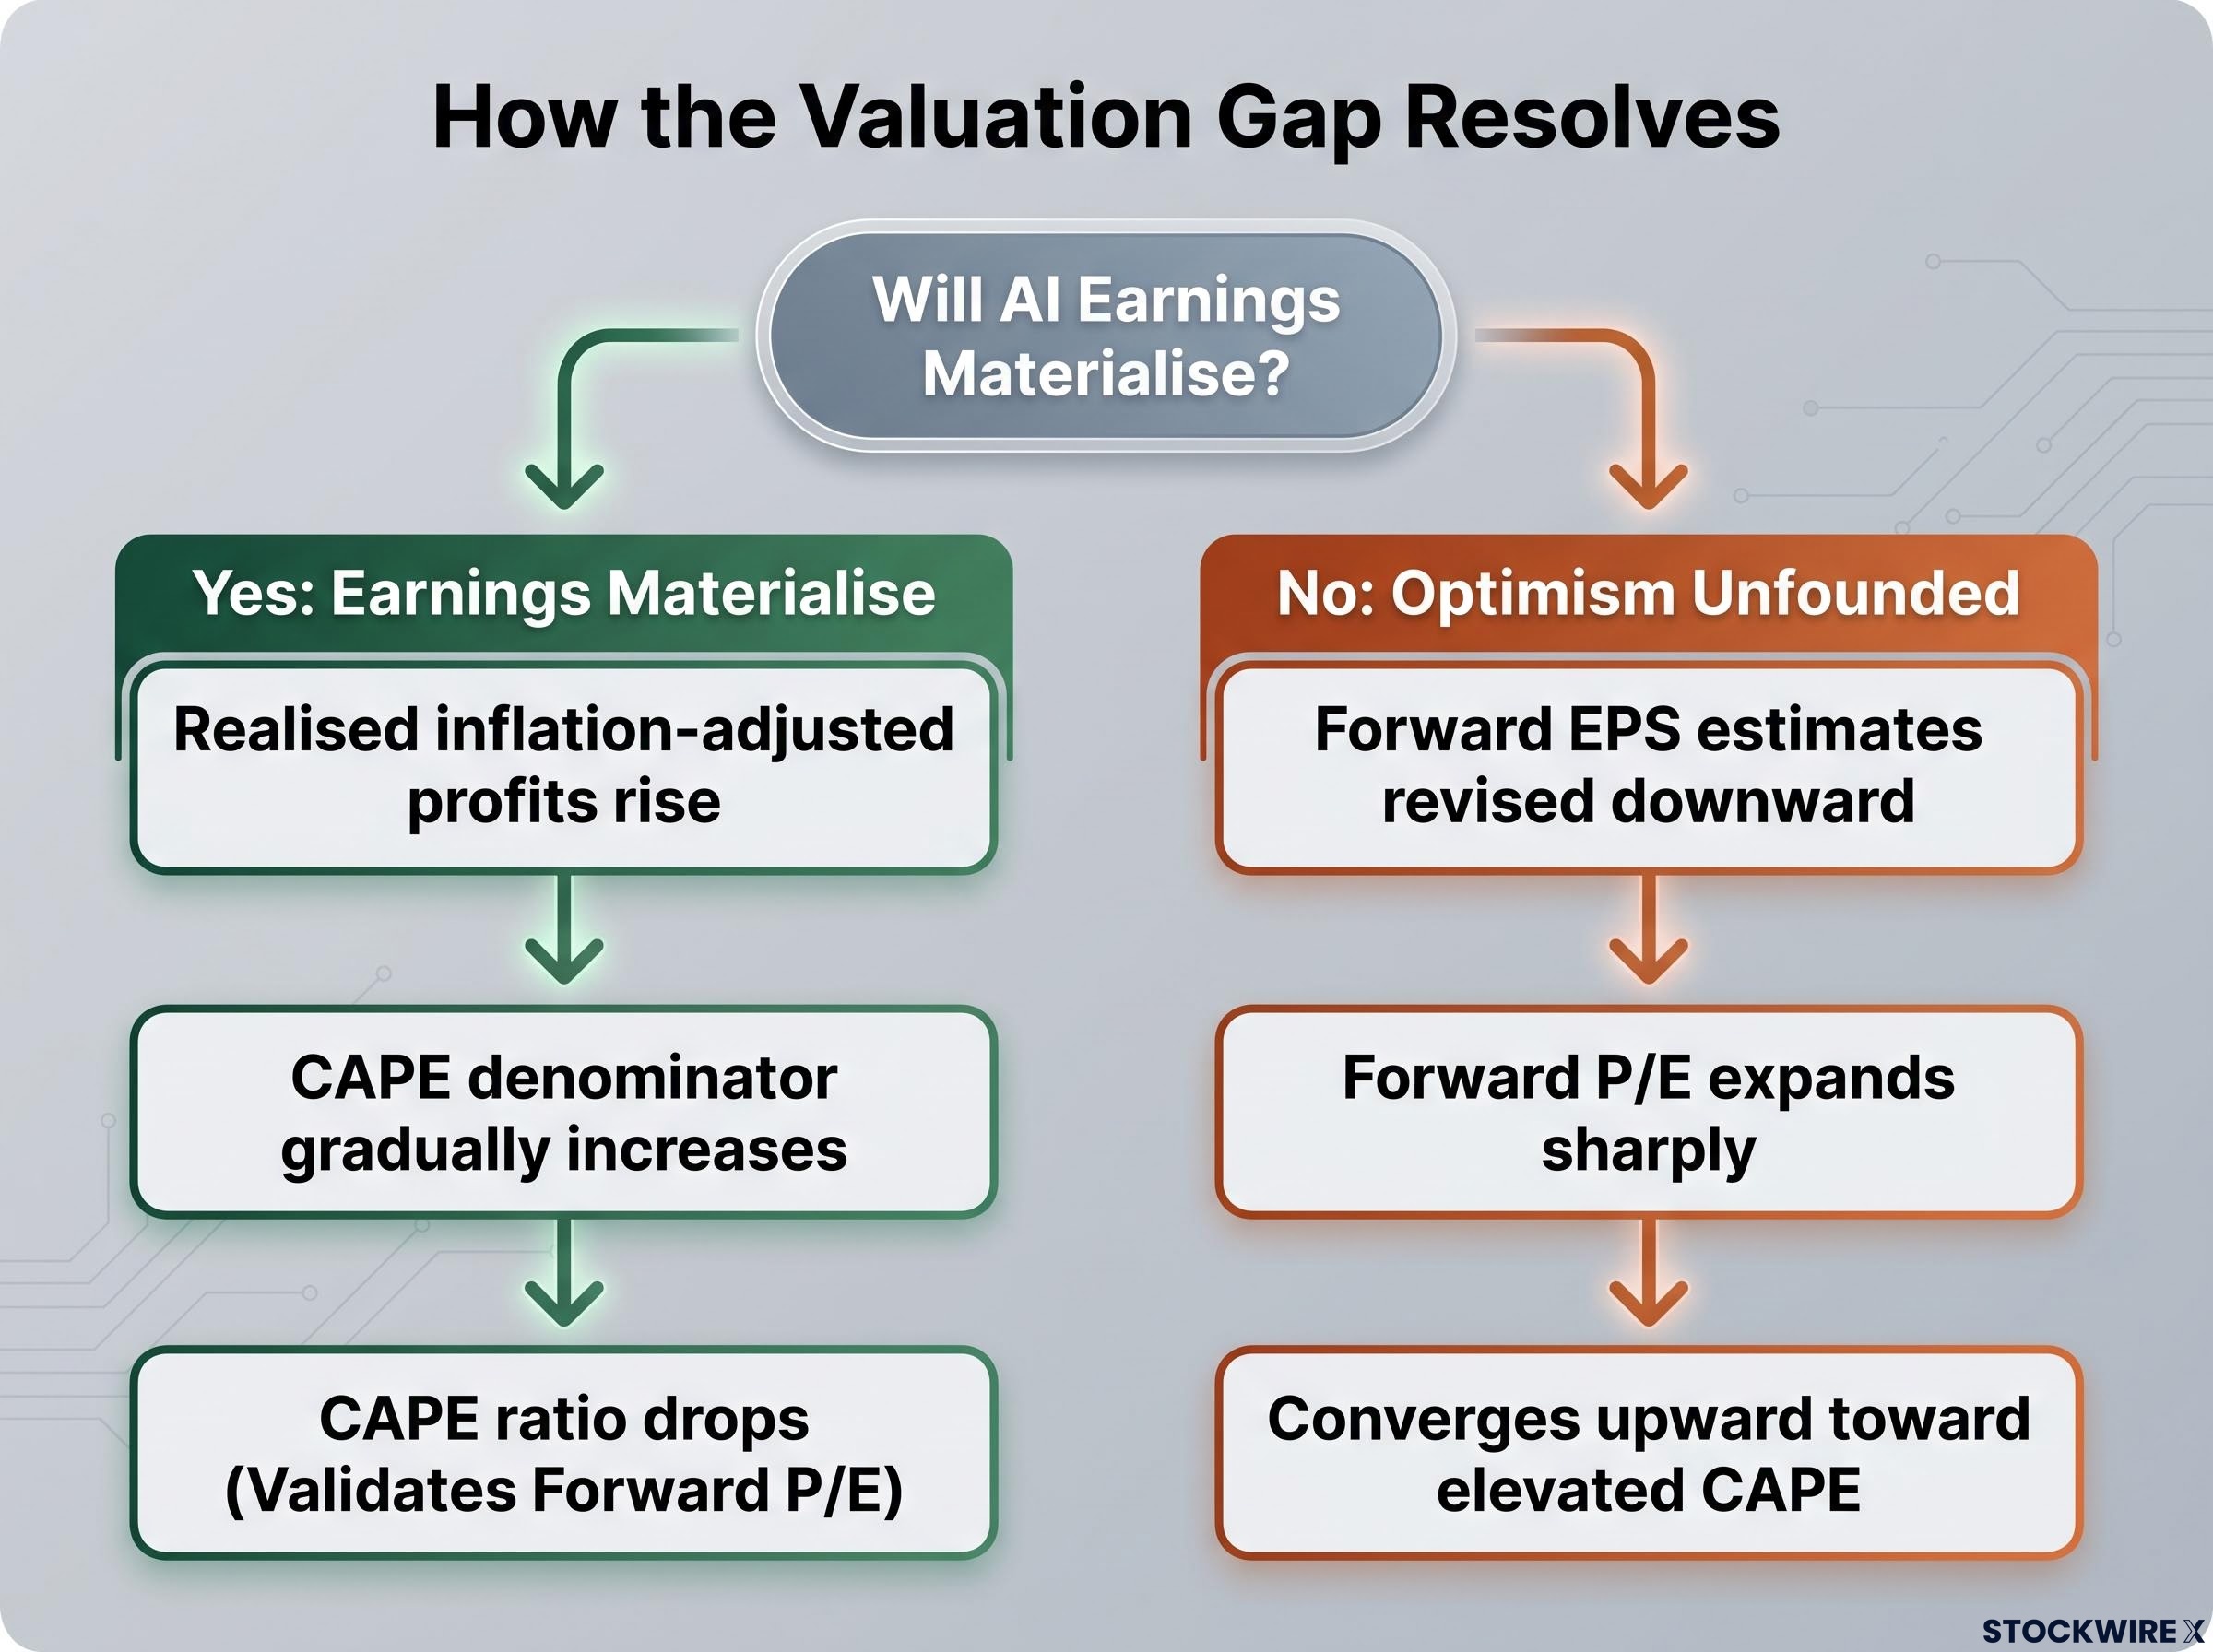
The unresolved question: will AI earnings eventually close the CAPE gap?
If AI-driven productivity gains are real and durable, realised earnings will eventually grow fast enough to reduce the lag in CAPE’s denominator. Over time, the two metrics would converge as reported profits catch up to analyst forecasts.
No 2025 or 2026 peer-reviewed or institutional research has modelled this outcome systematically. The argument that AI productivity distorts CAPE’s backward-looking denominator remains an open analytical question, not a settled empirical result.
Q1 2026 earnings delivery provides early evidence on which scenario is unfolding: blended S&P 500 EPS growth of 27.1%, nearly double the 13.1% consensus estimate, was driven heavily by AI-monetisation results from hyperscalers, giving the forward P/E denominator a concrete near-term anchor that partially explains why the multiple has remained compressed relative to CAPE.
Invesco’s March 2025 analysis implicitly argues that when a narrative drives earnings forecasts sharply higher, CAPE serves as a useful counterweight precisely because it is not affected by analyst optimism.
The two resolution scenarios carry very different investment implications:
- AI earnings materialise. If the productivity gains embedded in forward EPS forecasts flow through to realised, inflation-adjusted results over the next several years, CAPE’s denominator will gradually rise, bringing the ratio down and validating the forward P/E reading retrospectively.
- AI optimism proves unfounded. If forward EPS estimates are revised downward as projected productivity gains fail to materialise, the forward P/E will expand sharply, converging upward toward CAPE’s already elevated reading, confirming that CAPE had been signalling the more accurate picture all along.
The Capital Economics framing captures the stakes: whether the rally since end-2022 has been fundamentally driven or speculatively driven depends on which of these scenarios ultimately plays out.
What each metric’s reading means for investors assessing risk today
The two metrics are not competitors. They answer different questions about different time horizons, and sophisticated investors typically use them in combination.
Forward P/E at approximately 21x, compared with a 10-year average of approximately 18x, suggests the market is not cheap on near-term earnings. The premium is moderate but real, and it depends on analyst forecasts proving accurate.
The question of whether strong earnings are earnings already priced in sits at the centre of the current valuation debate: Bank of America’s internal model shows the S&P 500 as expensive on 16 of 20 valuation metrics, with the forward P/E at approximately 21.4x sitting 20% above its 10-year average, even as the firm raised its 2026 EPS estimate to $335.
CAPE in the range of 37-40x places the market in territory that has historically been associated with below-average 10-year forward returns, according to research from the Wharton Jacobs Levy Center and Invesco’s 1926-2017 backtesting.
| Dimension | Forward P/E | CAPE |
|---|---|---|
| Time horizon | Short to medium term (6-18 months) | Long term (7-10 years) |
| Earnings basis | Consensus analyst forecasts | 10-year real, inflation-adjusted actuals |
| Current reading | Approximately 21x | Approximately 37-40x |
| Signal type | Near-term earnings pricing | Long-run return expectation |
| Primary use case | Earnings season assessment, tactical positioning | Strategic asset allocation, retirement planning |
A framework for holding both signals at once
The 13-point gap between CAPE expansion and 4-point forward P/E expansion since end-2022 is itself a signal. It quantifies how much of the current valuation premium depends on analyst optimism about future AI earnings proving correct.
A trader with a 12-month horizon weights forward P/E more heavily, because the metric captures the earnings trajectory the market is pricing over that period. A long-term investor building a retirement allocation weighs CAPE more heavily, because the metric’s predictive power strengthens over longer horizons. The practical task for either investor is calibrating how much confidence to assign to the analyst optimism embedded in the 9-point gap between the two frameworks.
The valuation debate will be settled by earnings, not methodology
Forward P/E and CAPE are not producing different verdicts because one metric is wrong. They are producing different verdicts because they measure different things about earnings: one captures where analysts believe profits are heading; the other captures where profits have actually been.
The gap between them, approximately 4 points of expansion on one measure and 13 points on the other, is a precise quantification of the market’s bet on AI-driven earnings delivery. That bet is neither confirmed nor refuted by methodology. It will be confirmed or refuted by the earnings data of the next several years: whether realised, inflation-adjusted profits close the gap between forward expectations and CAPE’s slower-moving denominator.
Investors who understand the structural source of this divergence are better positioned to update their view as each quarterly earnings cycle arrives, rather than reacting to whichever metric a given commentator happens to cite.
This article is for informational purposes only and should not be considered financial advice. Investors should conduct their own research and consult with financial professionals before making investment decisions.