
UBS Backs Five Non-Dollar Currencies as Bearish Dollar Bet Builds
5 hrs ago

The average 2026 ASX IPO has returned 34.5% on its first day of trade. That number is also almost entirely misleading.
With 16 companies listing on the ASX by the end of May 2026, more than triple the pace seen at the same point in 2025, the IPO market appears to have turned a corner. Headline return figures are circulating in broker notes and financial media, reinforcing the impression of a standout year for new listings. The reality beneath those figures tells a different story. Three companies account for the entire positive aggregate return across the cohort, and the remaining 13 listings have, on average, lost money for investors who held from their float price.
This analysis unpacks what sits behind the headline numbers, identifies which companies are driving the averages, examines what the data looks like once they are removed, and outlines what that gap means for retail investors evaluating whether to participate in upcoming floats.
The surface statistics are genuinely striking. Across all 16 ASX IPOs that completed listing between January and May 2026, the average first-day return was 34.5%, according to Market Index analysis by Kerry Sun published 3 June 2026. Some 80% of debuts recorded a positive first-day move.
For a casual reader scanning a broker summary or a financial media headline, those figures suggest a market that is rewarding new issuance generously. One adjustment changes the picture.
Strip out Bison Resources (ASX: BSR), a Nevada gold explorer that surged 225% on its opening day, and the average first-day return drops to 20.9%. Still positive, but nearly 14 percentage points lower from removing a single stock in a 16-company cohort.
The divergence sharpens when the lens shifts from first-day returns to cumulative performance, the measure that captures what investors actually earned by holding the shares.
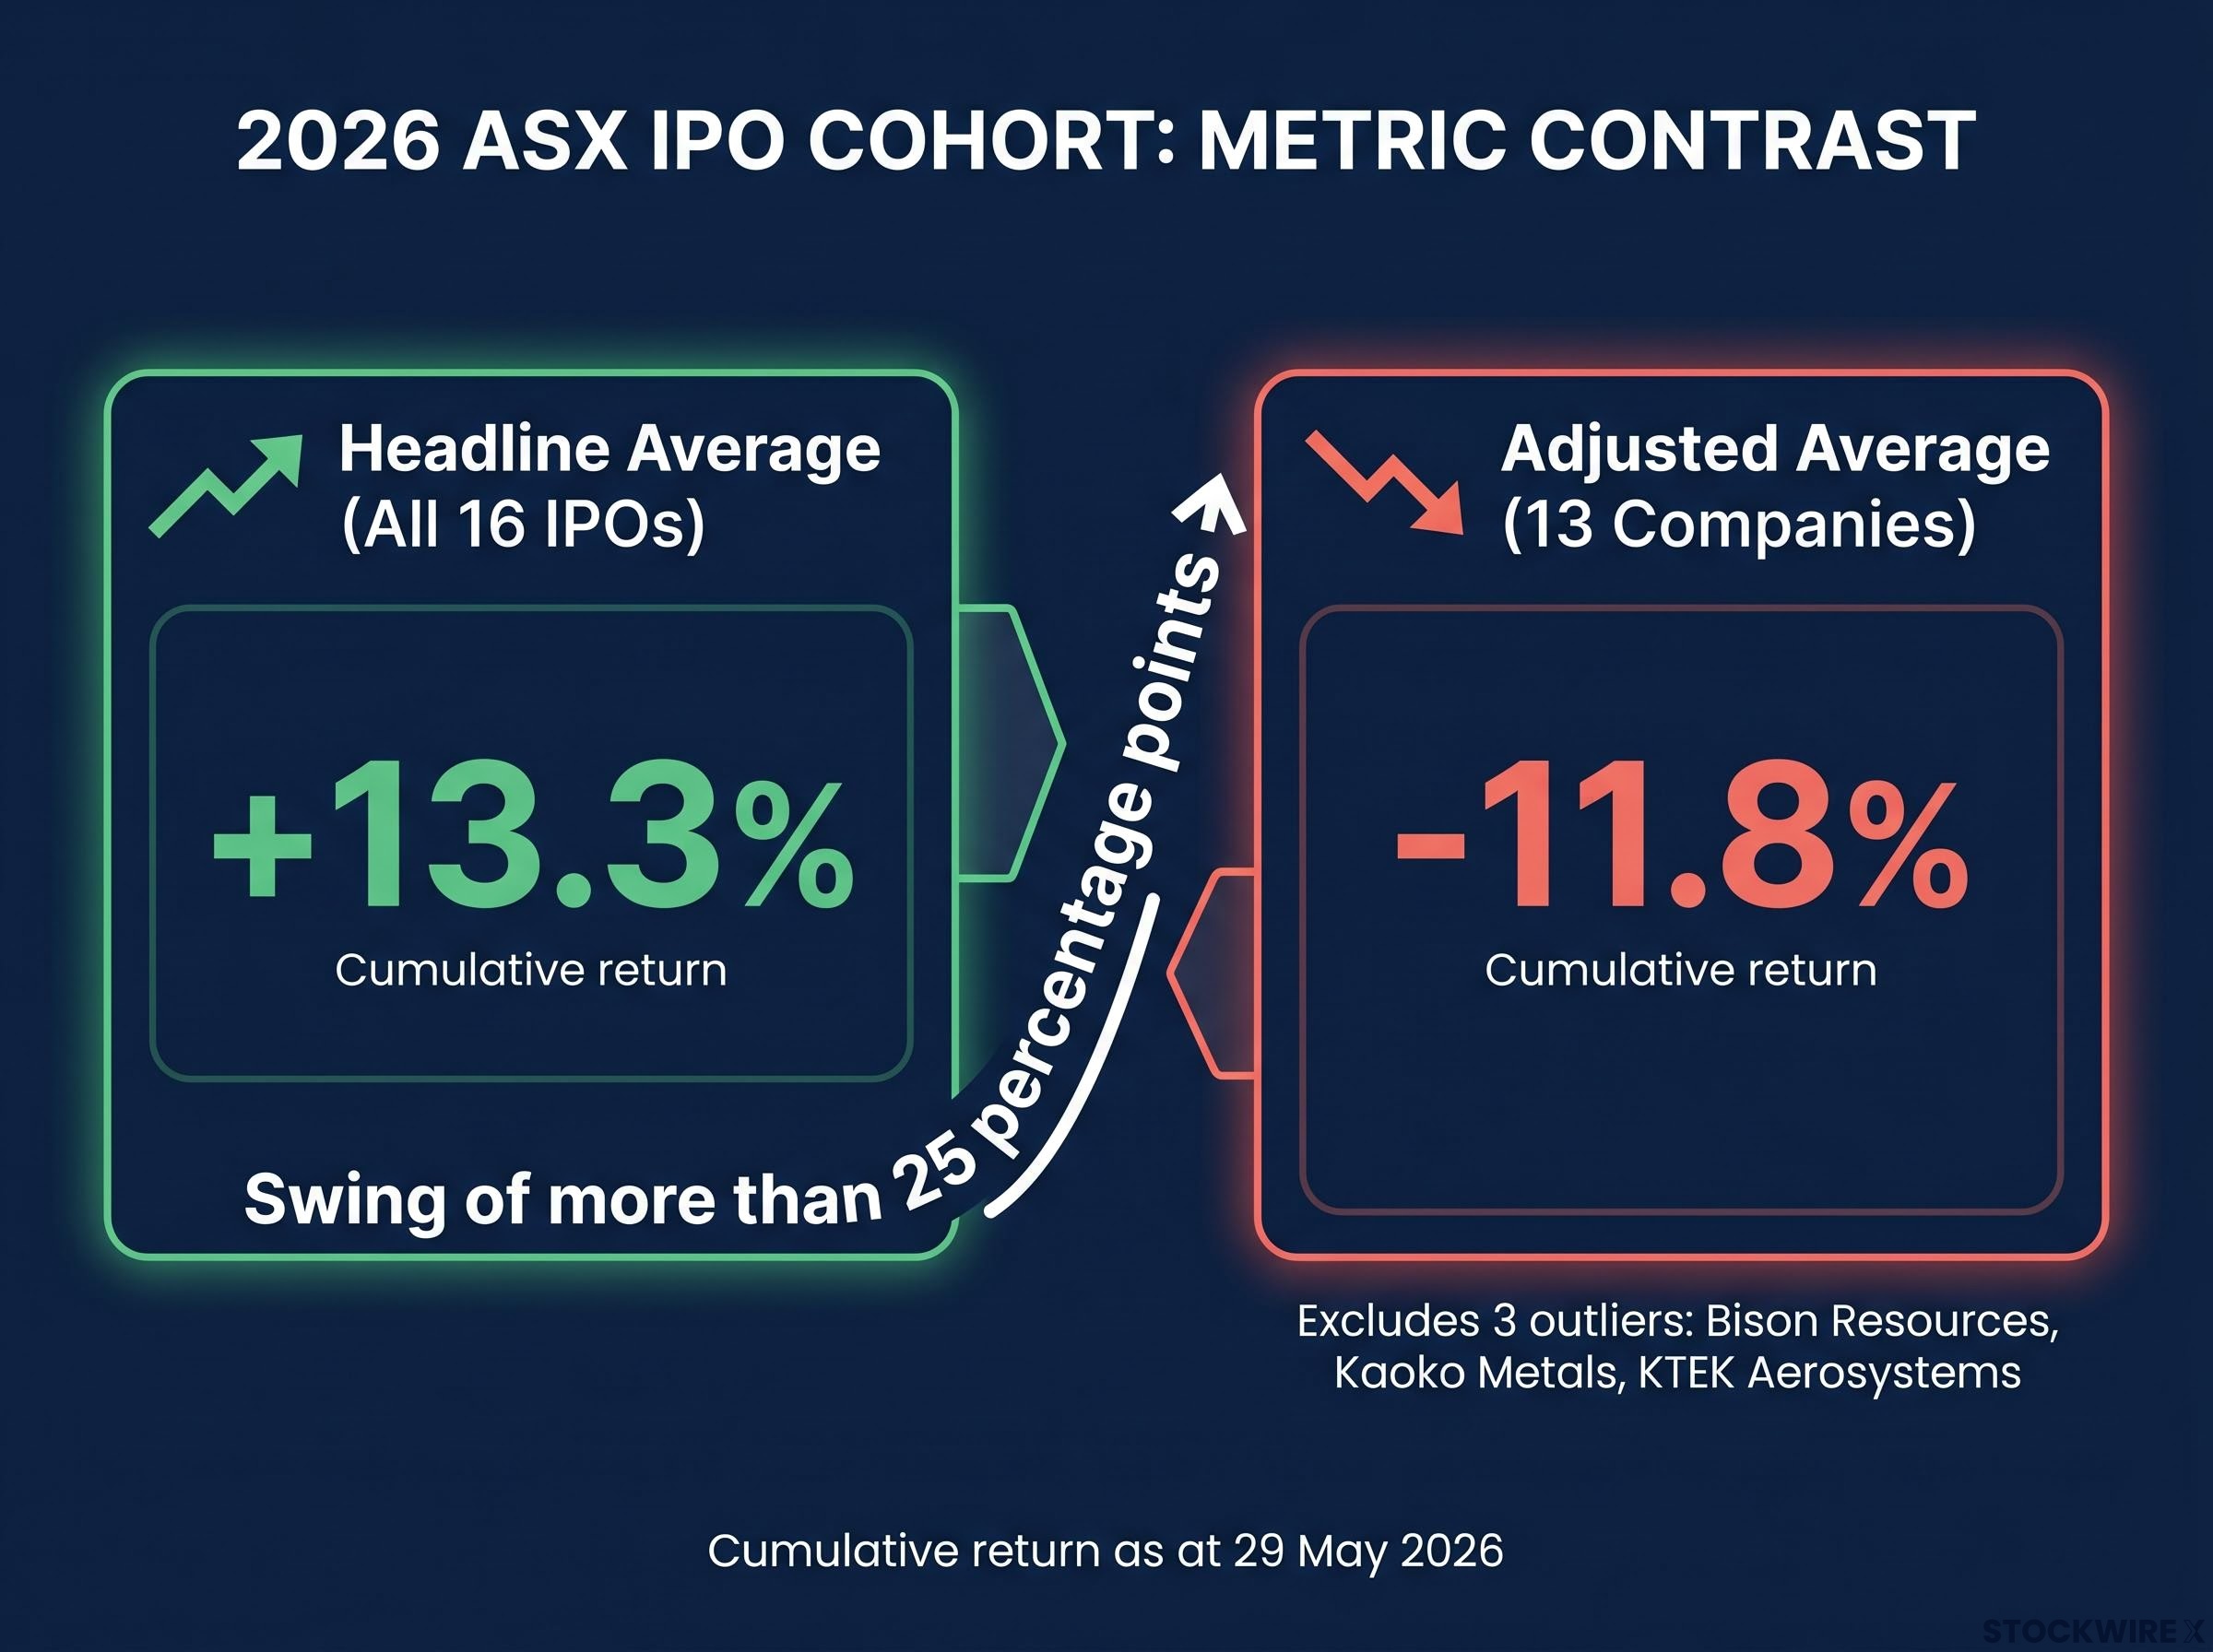
Across the full cohort, the average cumulative return as at 29 May 2026 was 13.3%. Remove Bison Resources, Kaoko Metals (ASX: KAO), and KTEK Aerosystems (ASX: KTK), and the average cumulative return for the remaining 13 companies falls to -11.8%.
The adjusted average cumulative return for the 2026 ASX IPO cohort, excluding three outliers, is -11.8%, a swing of more than 25 percentage points from the headline figure.
All nine of the first companies to list in 2026 were trading below their debut prices as at 29 May 2026. The gap between the event of listing and the ongoing experience of owning the shares could hardly be wider.
Bison Resources listed at an IPO price of A$0.20 and surged 225% on its first day of trade. As at 29 May 2026, its cumulative return stood at +150.0%. For investors who held BSR from the float, the outcome was exceptional.
For everyone else in the cohort, that outcome was distortive. In a 16-company group, one observation carrying a 225% first-day return pulls the arithmetic mean with an outsized force that would be negligible in a 200-company index. A single stock in a small sample does not just contribute to the average; it can redefine it.
Kaoko Metals, a Namibia copper-silver-gold explorer that listed in May 2026, and KTEK Aerosystems, which listed on 18 May 2026 after a heavily oversubscribed $10 million raise, compounded the effect. Together, these three outliers transformed a negative aggregate cumulative return into a positive one.
| Company | Ticker | IPO Price | Day-One Change | Cumulative Return |
|---|---|---|---|---|
| Bison Resources | BSR | A$0.20 | +225.0% | +150.0% |
| Kaoko Metals | KAO | — | Significant premium | Significant upside outlier |
| KTEK Aerosystems | KTK | — | Significant premium | Significant upside outlier |
Three companies in a 16-stock cohort account for the entire positive aggregate return. That is not a measure of IPO market health. It is a measure of those three floats.
IPO return distributions are almost always skewed to the right. A stock’s price cannot fall below zero, which places a hard floor at -100%. There is no equivalent ceiling on gains, meaning a small number of extreme winners can pull the mean far above the median, the midpoint that better represents a typical outcome.
The distinction matters. The mean averages every result equally, giving a 225% return the same mathematical weight as a -17.5% one. The median identifies the middle observation, the return an investor would most likely have experienced had they picked a listing at random. When a published figure reports the “average” IPO return without disclosing whether it is the mean or median, and without noting the skew, the number is structurally incomplete.
The 2026 ASX cohort illustrates the mechanism in real time. The headline mean cumulative return is 13.3%. The adjusted figure for the 13 non-outlier companies is -11.8%. Any investor who read only the headline figure would form a materially different expectation from one who saw both numbers.
ASIC’s MoneySmart guidance (updated 2023) warns that “a company’s share price can fall below the issue price after listing” and that first-day trading is not a reliable guide to long-term performance.
Three questions are worth asking whenever a published IPO average appears:
These questions apply to every IPO market summary, not just the 2026 cohort. The habit of asking them is more durable than any single data point.
The 2026 ASX cohort is a live illustration of a pattern documented across decades of market data: IPO long-term underperformance relative to comparably sized established companies averages 3.3% per year over the first five years of trading, a drag that compounds materially on any meaningful allocation.
The adjusted aggregate tells the story in the abstract. Individual company outcomes make it concrete.
49 Metals (ASX: 49M), a Nevada gold explorer, listed on 30 March 2026 after a $10 million IPO at A$0.20 per share. Its first-day return was -17.5%. By 29 May 2026, its cumulative return had deteriorated to -37.5%.
Unity Metals (ASX: UM1), a South-East Asia gold and copper explorer, listed in January 2026 after raising $8.66 million at A$0.20 per share. It recorded no movement on its first day. By 29 May 2026, cumulative losses stood at -45.0%.
| Company | Ticker | IPO Price | Day-One Change | Cumulative Return |
|---|---|---|---|---|
| 49 Metals | 49M | A$0.20 | -17.5% | -37.5% |
| Unity Metals | UM1 | A$0.20 | 0.0% | -45.0% |
| L1 Gold Fund | LGF | A$2.00 | +1.5% | 0.0% |
Both 49 Metals and Unity Metals are small-cap resources explorers, consistent with the dominant sectoral composition of 2026 listings and with the risk profile ASIC and brokers have flagged for junior explorers. The L1 Gold Fund (ASX: LGF), which listed at A$2.00 and sat at break-even as at 29 May 2026, was the closest to flat in the cohort.
The loss range between -37.5% and -45.0% for two representative small-cap listings within months of their floats illustrates the concrete cost of the gap between the average and the typical.
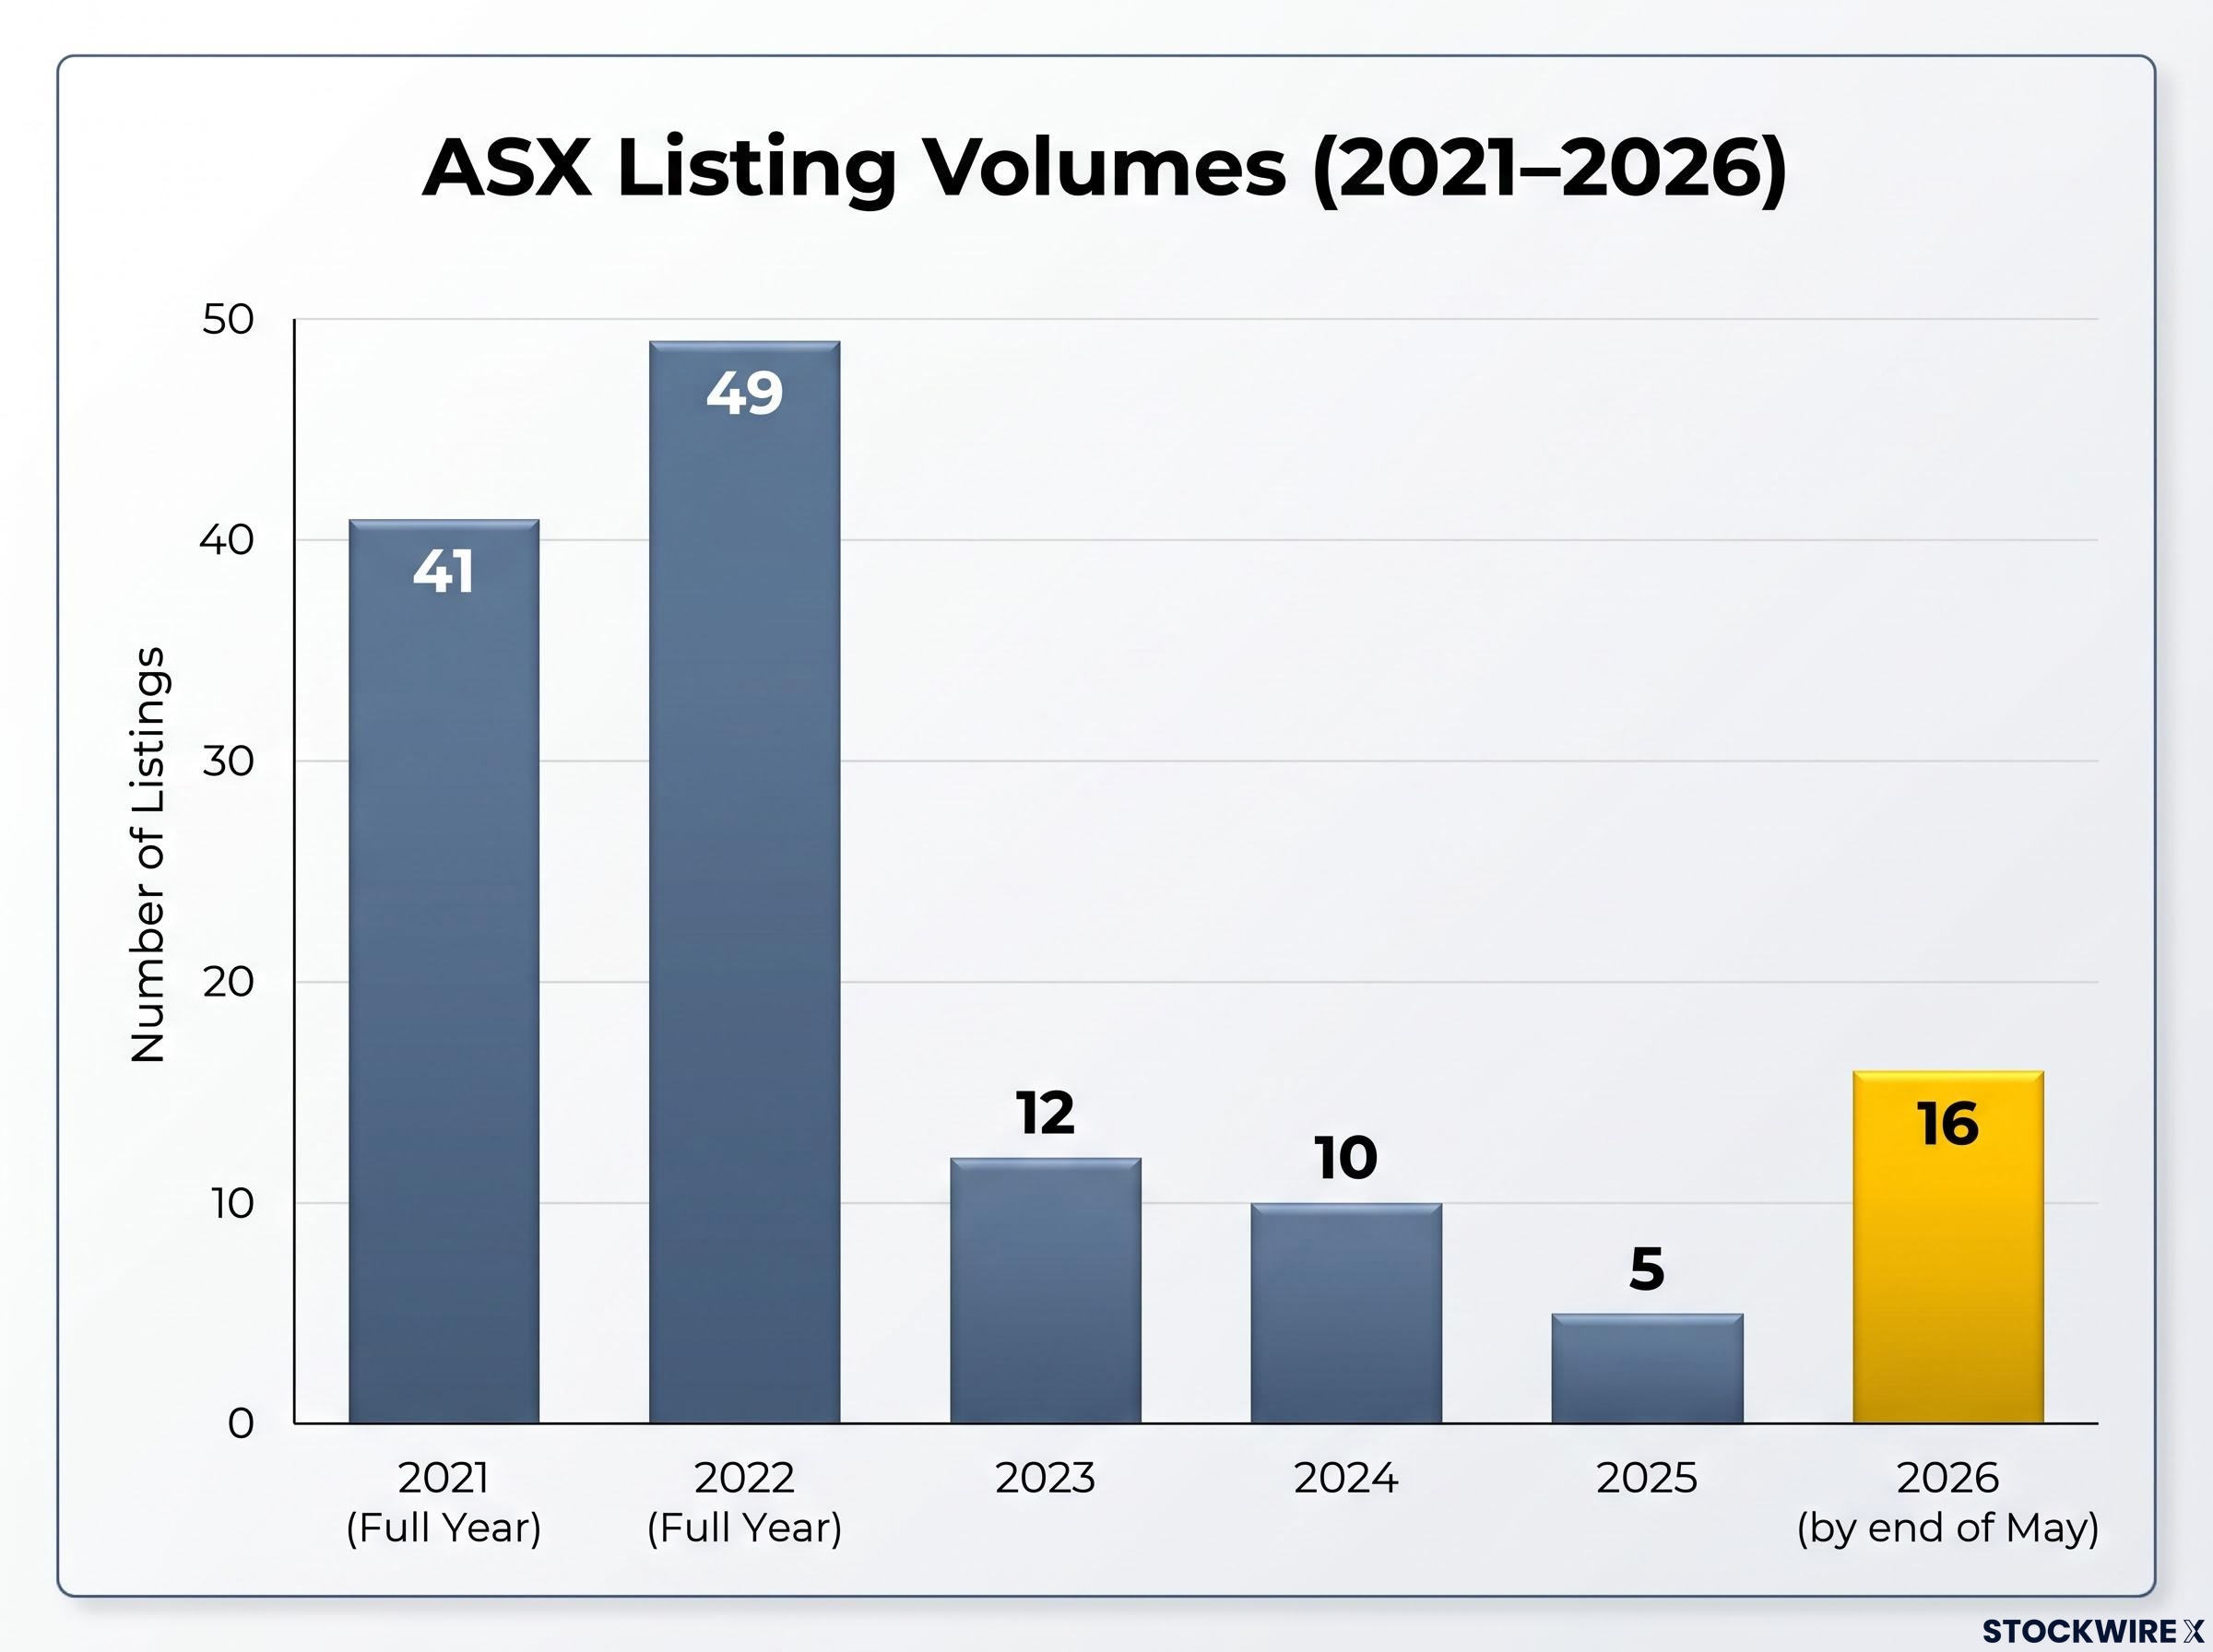
The volume recovery is real. Year-to-date ASX listing counts tell a clear story:
For context, the ASX recorded 41 full-year listings in 2021 and 49 in 2022, meaning the 2026 pace, while sharply higher than recent years, remains well below peak activity.
The volume increase, however, carries no information about return quality. The sectors driving the recovery, primarily small-cap resources and early-stage explorers, are precisely the categories where post-listing underperformance is most common.
Sentiment outpacing fundamentals is not confined to high-profile technology listings; it is a documented feature of IPO cycles more broadly, with clusters of marquee filings historically signalling that insiders believe valuations are near peak and that timing favours sellers over public buyers.
A recovery led by junior miners and pre-revenue explorers carries different risk characteristics than one driven by established mid-cap or technology listings. Wilson Asset Management observed in March 2024 that elevated interest rates and risk aversion had depressed small-cap valuations and made equity raising more challenging. Bell Potter’s small resources outlook from April 2024 noted subdued investor appetite for early-stage explorers due to risk-off sentiment and funding constraints.
The Reserve Bank of Australia held the cash rate at 4.35% at its May 2024 meeting, describing policy as “restrictive.” The RBA’s November 2024 statement reiterated that elevated rates were weighing on output and employment. Under these conditions, speculative small-cap issuance carries heightened risk, and volume recovery alone tells retail investors nothing about whether any given float is worth participating in.
The RBA February 2025 monetary policy decision confirmed that, even as the Board moved to lower the cash rate, policy remained restrictive and private demand subdued, conditions that continued to weigh on the risk appetite driving demand for speculative small-cap equity issuance throughout the early 2026 listing cycle.
The 2026 cohort is not an argument against IPO participation. It is an argument for informed participation. Three adjustments follow directly from the analysis:
IPO allocation mechanics explain why retail investors face a structural disadvantage before the first share trades: institutions receive allocations at the offer price, while most retail participants enter the secondary market after the opening pop has already been captured, absorbing the premium rather than benefiting from it.
The ASX listing process requirements mandate prospectus lodgement as a core step before any company can trade, meaning the document exists as a regulatory obligation rather than a marketing artefact, and its disclosures on use of funds, financial position, and risk factors carry a level of specificity that broker summaries rarely replicate.
For the 13 non-outlier companies in the 2026 ASX IPO cohort, the average cumulative return as at 29 May 2026 was -11.8%. This is the realistic baseline for a randomly selected listing.
The 80% positive first-day return rate is not structurally dishonest. It is simply incomplete. First-day returns measure the event of listing. Cumulative returns measure the experience of ownership. The two are not the same metric, and conflating them leads to misallocated capital.
ASX investor education materials and the ASIC MoneySmart IPO guidance page remain useful structural resources for evaluating upcoming floats.
This article is for informational purposes only and should not be considered financial advice. Investors should conduct their own research and consult with financial professionals before making investment decisions. Past performance does not guarantee future results.
The 2026 ASX IPO market has recovered in volume terms and produced headline returns that look impressive on the surface. Both metrics obscure a cohort where the majority of listings have lost value from their float price.
Bison Resources, Kaoko Metals, and KTEK Aerosystems represent genuine success stories for investors who held them. Allowing those three outcomes to stand in for the broader picture, however, misrepresents what the typical 2026 IPO has delivered.
More active IPO markets create more opportunities. They also generate more noise in aggregate data, making individual selection harder, not easier. Retail investors considering upcoming floats would benefit from consulting the ASIC MoneySmart IPO guidance page and the ASX prospectus lodgement database before committing capital. The exclusion-scenario lens, asking what the numbers look like without the outliers, applies to any return statistics encountered in IPO marketing materials. The 2026 data makes a strong case that the habit is worth forming now.
For readers who recognise the patterns described in this cohort analysis and want to audit their broader approach to new listings and speculative issuance, our dedicated guide to common Australian investing mistakes covers six documented errors backed by ASIC data, including the specific dynamics around social media tips and leveraged exposure to early-stage companies.
The headline average first-day return for 2026 ASX IPOs is 34.5%, but this figure is heavily distorted by three outlier stocks. Excluding those three companies, the average cumulative return for the remaining 13 listings falls to -11.8% as at 29 May 2026.
IPO return distributions are skewed to the right because a stock cannot fall below zero but can rise without limit, meaning a small number of extreme winners can pull the mean far above the median. In a small cohort like the 2026 ASX IPO group, a single stock with a 225% first-day return can redefine the entire average.
By the end of May 2026, 16 companies had listed on the ASX, more than triple the pace seen at the same point in 2025, when only 5 companies listed across the full year. Despite the volume recovery, the 2026 pace remains well below peak activity levels of 41 listings in 2021 and 49 in 2022.
Retail investors should read the prospectus rather than relying on broker summaries or media headlines, check what the median return looks like alongside the mean, and assess performance with outliers removed to get a realistic base case. ASIC's MoneySmart guidance also warns that retail investors risk overpaying when they chase IPO hype.
First-day returns measure the price move on the opening day of trading, while cumulative returns measure what an investor actually earned by holding the shares over a period after listing. The 2026 ASX cohort shows a 34.5% average first-day return but an adjusted cumulative return of -11.8% for the 13 non-outlier companies, illustrating how dramatically the two measures can diverge.


