Five major economic data releases land across four trading days this week, and by Friday afternoon the market will have fresh readings on US employment, European inflation, and Canadian hiring simultaneously. The week beginning 2 June 2026 is one of the densest macro data weeks of the mid-year calendar. The ISM Manufacturing index dropped on Monday, eurozone CPI follows on Wednesday, the ISM Services index arrives on Thursday, and then the US non-farm payrolls report and Canadian employment figures land together on Friday 5 June. Each release feeds directly into central bank decisions that are weeks away, not months, making accurate interpretation unusually consequential right now.

This guide walks through every major release in calendar order, explains what the consensus forecast signals, highlights where the real risk to markets lies if the data surprises, and provides a framework for connecting each print to the policy and asset price implications that follow.
How economic data releases move markets: the mechanic behind the calendar
Markets do not wait for data to arrive before forming a view. By the time any headline number hits the screen, traders, fund managers, and algorithmic systems have already positioned around the expected result. That expectation, compiled from economist surveys and market-implied pricing, is the consensus forecast. A release only generates meaningful price movement when the actual print deviates from what was already anticipated.
The relationship between PMI data and consensus pricing is more subtle than it first appears: equity markets typically absorb the directional trend of a survey result weeks or months before the official release, concentrating the market-moving signal in the deviation from expectation rather than the absolute level of the index.
This distinction matters more than it might seem. A strong employment number, for instance, is not automatically good news for markets. If it reduces the probability of a rate cut that bond markets had already priced in, the same “strong” print can push bond prices lower and lift yields. The relationship between data quality and market direction is conditional, not fixed.
Fed research on equity market reactions to macroeconomic surprises demonstrates that the gap between actual data releases and median market expectations, rather than the absolute level of any indicator, is the primary driver of price moves, a finding that reinforces why tracking consensus benchmarks before each release matters more than reacting to headlines alone.
Three concepts underpin this week’s calendar:
- Consensus forecast: The median expectation from surveyed economists for a given release, serving as the benchmark against which the actual number is judged.
- Market-implied expectation: The level already embedded in asset prices through futures, options, and swap markets, which may differ from the economist consensus.
- Data dependency: The stated posture of a central bank that has committed to letting incoming data determine its next policy move, rather than following a pre-announced path.
All three major central banks in focus this week, the Federal Reserve (Fed), the European Central Bank (ECB), and the Bank of Canada, are operating in some form of data-dependent mode. That compresses the feedback loop between a single print and a policy decision.
“Economists estimate the US labour market now only needs to create around 10,000 jobs per month to hold the unemployment rate steady.”
That breakeven figure reframes every payrolls number this week. A print of 95,000 is not modest relative to that threshold; it represents substantial net labour market improvement.
When big ASX news breaks, our subscribers know first
Monday’s manufacturing ISM: tariff reshoring, cost pressures, and what 53.1 actually means
The May 2026 ISM Manufacturing index consensus sits at 53.1, a marginal increase from April’s 52.7. Any reading above 50 signals expansion, and at 53.1 the US manufacturing sector would be posting its strongest stretch of activity in over a year.
| Release | Date | Consensus | Prior Reading |
|---|---|---|---|
| ISM Manufacturing (May 2026) | Monday, 1 June 2026 | 53.1 | 52.7 |
Tariff-driven reshoring of production has contributed to that buoyancy. Domestic orders have firmed as supply chains adjust to trade policy shifts, and recent order strength supports the above-50 reading. The expansion looks real.
Then there is the story inside the story. The prices-paid sub-component, which tracks input costs across the manufacturing sector, is near its highest level in approximately four years. The same tariff dynamics supporting activity are also pushing raw material and component costs higher.
- The headline ISM index measures overall manufacturing activity: new orders, production, employment, supplier deliveries, and inventories, combined into a single diffusion reading.
- The prices-paid sub-component isolates input cost pressure, tracking how many manufacturers are reporting higher costs relative to lower costs. It is the Fed’s inflation early-warning signal within the manufacturing survey.
For equity investors in industrials or materials, and for anyone tracking the Fed’s inflation calculus, the prices-paid reading matters as much as the headline. Persistent input cost inflation narrows the window for rate relief even if growth holds up.
Wednesday’s eurozone CPI: why a soft core reading may not stop the ECB from hiking
The ECB’s own preferred internal inflation measures are at historically low levels. A precautionary rate hike is still widely expected. Those two facts sit in apparent contradiction, and the Wednesday 3 June eurozone CPI release is the data point that connects them.
The May 2026 headline CPI consensus is 3.2%, up from an implied prior reading of 3.0%. Core CPI, which strips out volatile energy and food prices, is forecast at 2.4%. National inflation data from France, Germany, Italy, and Spain have already signalled the headline figure will come in broadly in line with expectations. Secondary price transmission effects from energy costs remain relatively contained.
Here is where the tension sharpens. The supercore measure, which captures components most tied to domestic economic activity, and the trimmed-mean measure, which excludes the largest price swings in either direction, both remain at historically low levels. By those gauges, underlying inflationary pressure is muted.
- Headline CPI: The broadest measure of consumer price changes, including food, energy, and all goods and services.
- Core CPI: Headline CPI minus volatile food and energy components, used to assess underlying price trends.
- Supercore / trimmed-mean composite: Narrower measures that isolate domestically generated inflation from one-off or external shocks, considered the ECB’s preferred internal gauges.
The ECB faces a dual challenge. Headline inflation remains above target, which justifies tightening. Growth is slowing, which argues for caution. The risk of a policy error runs in both directions: hiking into a downturn, or pausing while headline inflation expectations become entrenched. That stagflation-adjacent tension is why the ECB has framed any coming increase as precautionary rather than aggressive.
“Even a modest moderation in the eurozone headline rate is unlikely to alter the expectation that the ECB will proceed with a precautionary rate hike.”
The ECB policy meeting falls within approximately two weeks of this release, compressing the feedback loop between the data and the decision. European equities and the euro will both be sensitive to any surprise in either direction.
Thursday’s services ISM: reading the softness beneath the expansion signal
The May 2026 ISM Non-Manufacturing consensus of 53.7 represents continued expansion in the sector that accounts for the majority of US economic activity. The number is a slight increase from the prior reading. On the surface, that is reassuring.
The reassurance fades when the internals come into view. Business sentiment within the survey has been weakening. Labour market conditions reported by services firms have softened. The headline composite remains above 50, but the components that drive forward momentum are pointing in the wrong direction.
Three specific headwinds are weighing on the services outlook:
- Elevated inflation continues to compress margins for services businesses that cannot pass through costs as easily as goods producers.
- Higher interest rates are raising financing costs and dampening demand in rate-sensitive services categories, from housing-adjacent services to consumer credit-dependent spending.
- Increased political uncertainty is prompting businesses to delay hiring and investment decisions, creating a drag on activity that the headline composite does not fully capture.
What the sub-components tell traders that the headline does not
Markets increasingly look past the composite ISM headline to the employment and new-orders sub-indexes as leading indicators of momentum shifts. These internal readings function as early signals: when they soften while the headline holds above 50, it historically precedes downward revisions in subsequent months.
The deterioration visible in ISM employment sub-components is not new this week: April’s nonfarm payroll report delivered a headline beat of 115,000 jobs while ISM Manufacturing Employment sat at 46.4 and ISM Services Employment at 48.0, both in contraction, illustrating exactly the gap between composite headline strength and internal labour market signals that Thursday’s services ISM is expected to extend.
A deteriorating sub-index profile within a technically expansionary headline is also a forward indicator for Friday’s labour market data. If services firms are reporting weaker hiring conditions, the non-farm payrolls number arriving the next morning may be softer than the 95,000 consensus anticipates.
Friday’s dual jobs day: US payrolls and Canadian employment arrive together
Friday 5 June is not two separate data releases. It is a single compound event. The US non-farm payrolls report and the Canadian employment figures land simultaneously, and North American bond, equity, and currency markets will reprice both in real time.
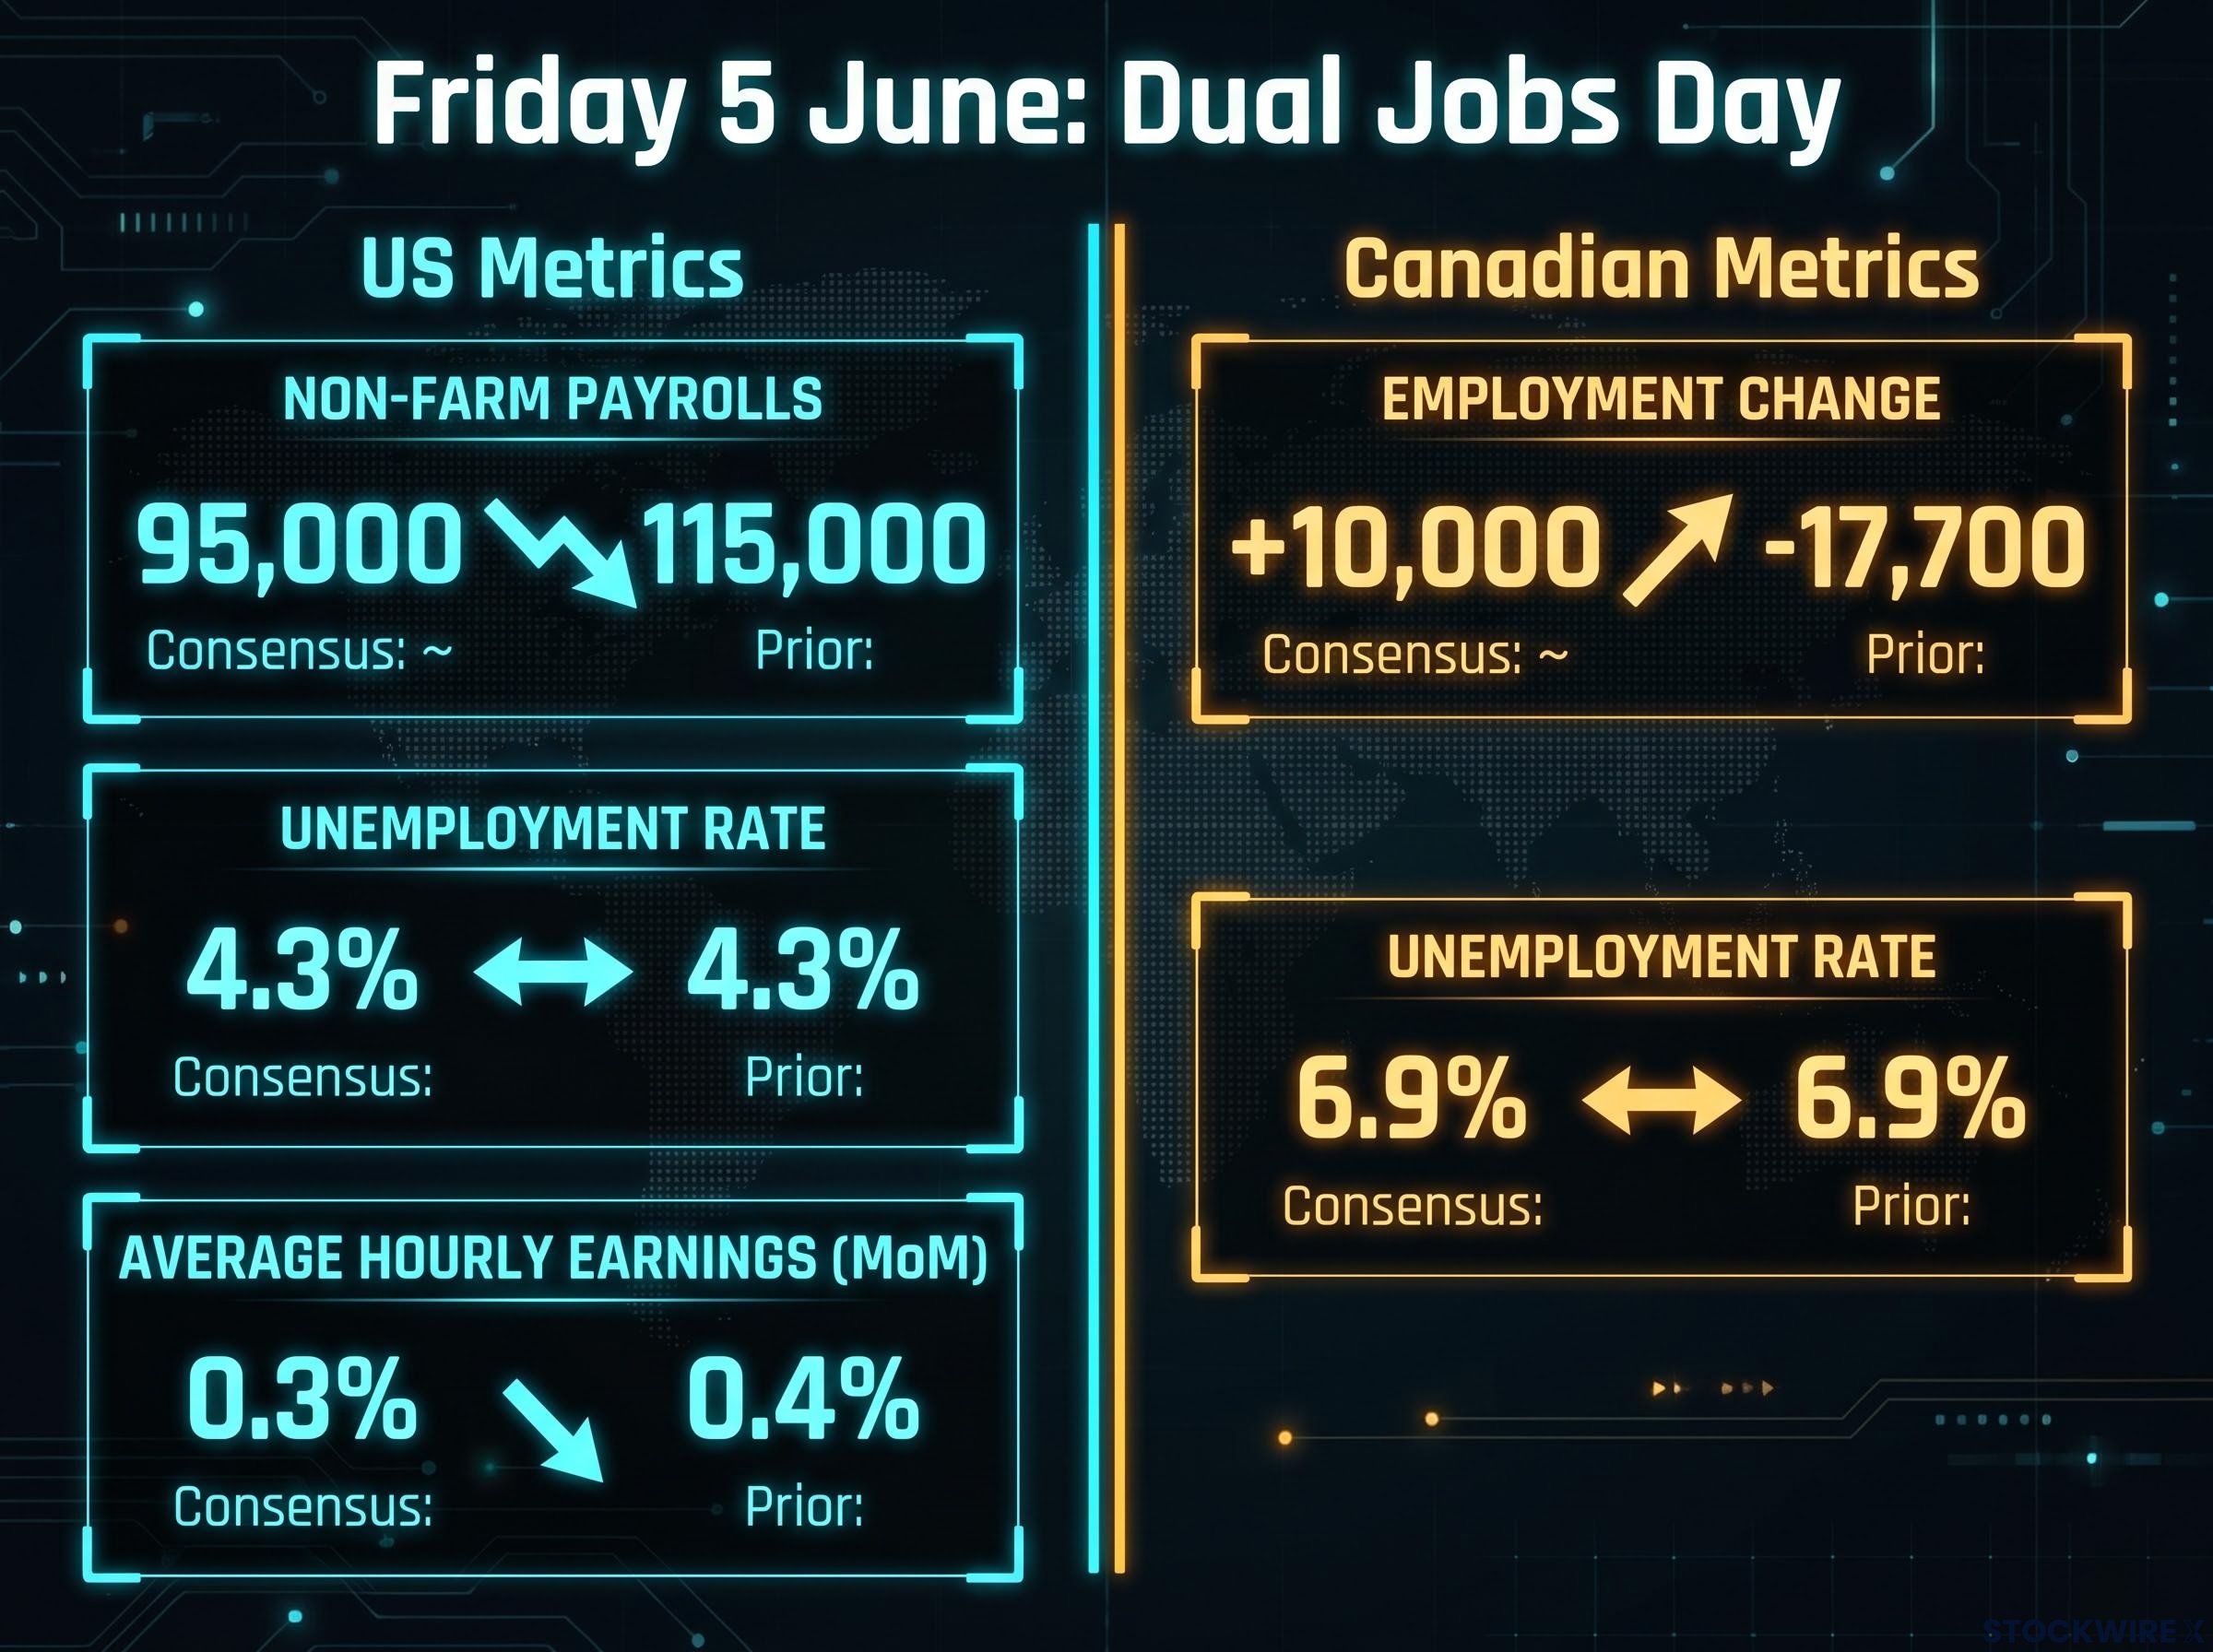
| Release | Country | Consensus | Prior Reading | Key Watch Point |
|---|---|---|---|---|
| Non-Farm Payrolls | US | ~95,000 | 115,000 | Headline vs breakeven threshold |
| Unemployment Rate | US | 4.3% | 4.3% | Stability at current level |
| Average Hourly Earnings (MoM) | US | 0.3% | 0.4% | Wage inflation deceleration |
| Employment Change | Canada | ~+10,000 | -17,700 | Recovery from prior contraction |
| Unemployment Rate | Canada | 6.9% | 6.9% | BoC data dependency trigger |
The US report contains three distinct sub-components, each carrying independent market signal:
- Headline payrolls measure the net number of jobs created or lost, serving as the broadest gauge of labour demand.
- The unemployment rate captures the share of the workforce actively seeking but unable to find employment, functioning as the Fed’s primary labour market health indicator.
- Average hourly earnings track wage growth, which the Fed watches as a leading indicator of services inflation since labour costs are the largest input for most services businesses.
“A further deceleration in average hourly earnings to 0.3% month-on-month would ease one of the Fed’s remaining inflation concerns, even if the headline payrolls number disappoints.”
On the Canadian side, the consensus of approximately 10,000 jobs added represents a recovery from the prior month’s contraction of 17,700 positions. The unemployment rate is expected to hold steady at 6.9%. The Bank of Canada is explicitly data-dependent at present, and elevated uncertainty from tariff-related trade risks and Middle East geopolitical tensions gives this single print outsized policy signalling weight.
The USD/CAD currency pair, North American equity futures, and government bond yields in both countries will all be repricing simultaneously on Friday afternoon. Readers who understand the consensus benchmarks for both reports will be better positioned to interpret market moves in real time rather than reacting to headlines alone.
The next major ASX story will hit our subscribers first
Reading the week as a whole: what the data sequence signals about where policy goes next
Taken individually, each of this week’s five releases tells a contained story. Taken together, they answer a larger question: is the global economy tracking toward a managed slowdown with inflation on a clear downward path, or does the combination of sticky price pressure and decelerating activity represent something more uncomfortable?
The through-line connecting the releases runs as follows. US manufacturing is expanding, but input costs are at multi-year highs. Eurozone headline inflation is ticking higher even as core measures cool. The US services sector remains technically in expansion while its internals deteriorate. And the North American labour market is healthy by breakeven standards but clearly decelerating from the pace of prior quarters.
| Day | Release | Consensus Forecast | Prior Reading |
|---|---|---|---|
| Monday | ISM Manufacturing | 53.1 | 52.7 |
| Wednesday | Eurozone CPI (Headline) | 3.2% | 3.0% |
| Thursday | ISM Services | 53.7 | Slightly lower |
| Friday | US Non-Farm Payrolls | ~95,000 | 115,000 |
| Friday | Canadian Employment | ~+10,000 | -17,700 |
Each asset class has its own sensitivity map for the week:
- Bonds: Most sensitive to Friday’s US wage growth figure and Wednesday’s eurozone headline CPI. Both feed directly into rate expectations.
- Equities: Most sensitive to the ISM readings (Monday and Thursday), which signal the growth trajectory, and to any payrolls surprise that shifts the rate-cut probability.
- FX: Most sensitive to the dual Friday release, where the simultaneous US and Canadian prints will move USD/CAD directly, and to the eurozone CPI reading’s effect on EUR/USD.
The ECB meeting falls within approximately two weeks of Wednesday’s print. The Bank of Canada’s data-dependent posture makes Friday’s Canadian figure an immediate policy input. Surprises relative to consensus, not absolute levels, are what will drive near-term price action across all three asset classes.
For readers ready to trace where this week’s data feeds next, the concentration of central bank decisions in June 2026 places the ECB, Fed, Bank of Japan, and Bank of England in a single eight-day decision window, meaning the payrolls, CPI, and ISM prints landing this week feed directly into four simultaneous policy recalibrations rather than one sequential chain of decisions.
The data week begins: how to use this calendar before Friday’s close
By Friday 5 June’s close, investors will have received five major prints across four days, spanning manufacturing, services, inflation, and employment in three jurisdictions. That is a rare concentration of market-moving information in a single week.
The practical framework is straightforward. Knowing the consensus before each release is what allows investors to distinguish a market surprise from a market confirmation. That distinction determines whether a data point represents genuinely new information or a validation of what was already priced.
The single highest-risk day is Friday, when the US non-farm payrolls and Canadian employment reports land simultaneously and will be interpreted together by North American markets in real time. Wednesday’s eurozone CPI is the other high-impact moment, given its proximity to the ECB policy decision.
Mark those two dates. Revisit the consensus benchmarks in this guide against the actual prints as they are released. The gap between expectation and reality is where the signal lives.
This article is for informational purposes only and should not be considered financial advice. Investors should conduct their own research and consult with financial professionals before making investment decisions.
Past performance does not guarantee future results. Financial projections are subject to market conditions and various risk factors.