
The US economy is sending two signals at once, and they contradict each other. April 2026 Personal Consumption Expenditures (PCE) inflation sits at 3.8% year-on-year while Q1 GDP growth has just been revised down to 1.6% annualised, its second consecutive sub-2% reading. On 29 May 2026, the Bureau of Economic Analysis released its second estimate of Q1 2026 GDP, confirming the deceleration just as multiple Federal Reserve officials spent the past week openly flagging that rate hikes remain on the table.
The combination forces a difficult question: is this a manageable soft patch the Fed can wait out, or an early-warning configuration that demands a change in how investors are positioned? What follows parses what the data actually says, what the most consequential Fed voices are signalling, why Treasury markets are telling a different story than the central bank, and what institutional strategists at six major firms are doing about it right now.
The numbers behind the tension: GDP, PCE, and what the revision actually shows
Start with the growth picture. Q4 2025 GDP came in at 0.5% annualised. The advance estimate for Q1 2026 offered some relief at 2.0%. That relief was revised away on 29 May: the BEA’s second estimate brought Q1 down to 1.6% SAAR, confirming a second consecutive quarter of sub-2% growth.
The composition of the revision matters more than the headline. The downward move came largely from inventory drawdowns and weaker trade components. Final sales to private domestic purchasers, the measure that strips out volatile inventory and trade swings and captures underlying demand health, held up better. That distinction separates a temporary drag from a genuine demand pullback.
The BEA’s advance estimates carry average absolute revisions of approximately 0.6 percentage points, which means interpreting GDP data releases requires distinguishing between signal and statistical noise before repositioning around any single print.
Pair the GDP data with the April 2026 PCE release:
- Headline PCE: 3.8% year-on-year
- Core PCE: 3.3% year-on-year
- Core PCE month-on-month: 0.2%
Personal income declined 0.1% in April while real consumer spending rose only 0.1%. The consumer is still spending, but barely, and earning less while doing it. The tension between slowing output and sticky inflation is not an abstraction; it is sitting in the same data release.
The BEA’s April 2026 personal income and outlays release confirms the precise figures underpinning this tension: headline PCE at 3.8% year-on-year, core PCE at 3.3%, personal income down 0.1%, and real consumer spending up just 0.1%, a combination that captures the narrowing margin between household resilience and outright demand contraction.
Where does Q2 go from here? Four institutional forecasts span a narrow but telling range:
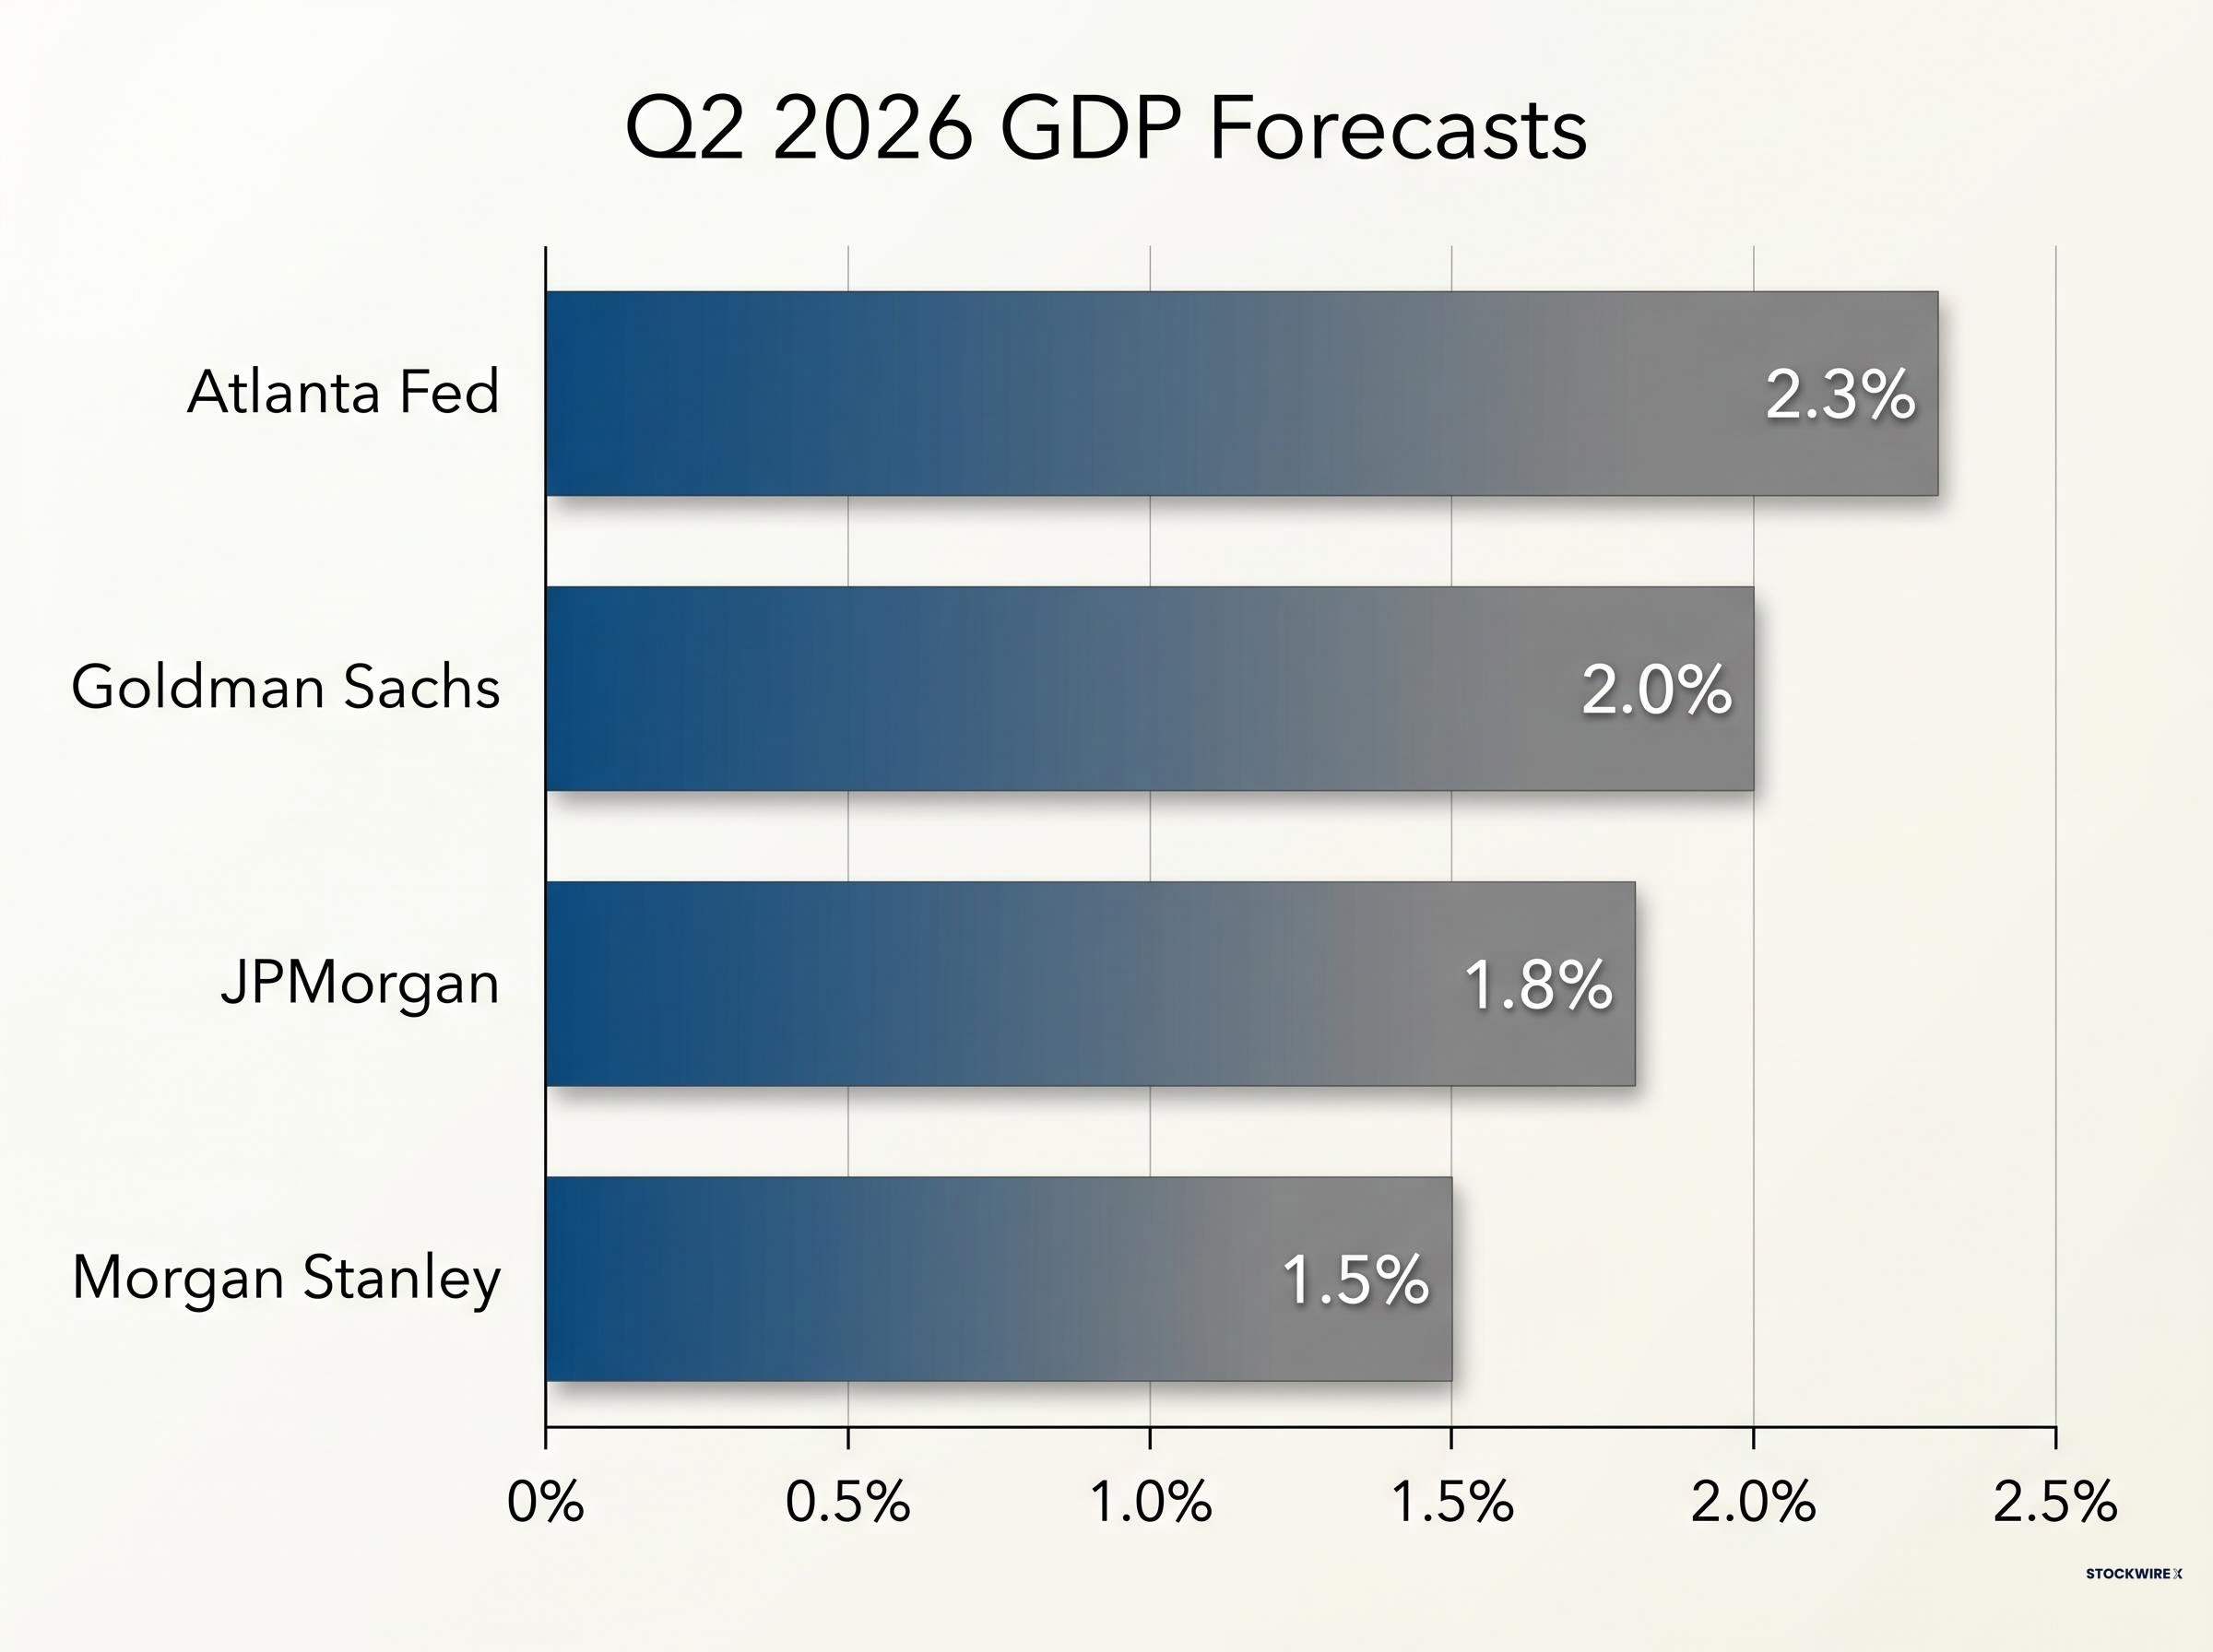
| Institution | Q2 2026 Forecast (SAAR) | Prior Estimate | Key Driver of Revision |
|---|---|---|---|
| Atlanta Fed GDPNow (28 May) | 2.3% | N/A | Nowcast model; real-time data inputs |
| Goldman Sachs (28 May) | 2.0% | 2.2% | Weaker capex and inventory data |
| JPMorgan (27 May) | 1.8% | 2.1% | Softer housing and retail figures |
| Morgan Stanley (27 May) | 1.5% | N/A | Tighter credit conditions; slower goods demand |
The range runs from 1.5% to 2.3%, consistent with moderate growth rather than contraction, but every named institution has revised lower.
When big ASX news breaks, our subscribers know first
What Jefferson, Cook, and Goolsbee are actually saying, and where they disagree
The Fed is not a monolith right now. Five officials have spoken publicly since 20 May 2026, and their views form a spectrum wide enough to affect how markets price the next move.
- Philip Jefferson (Fed Vice Chair, Reuters, 24 May 2026): Policy is “restrictive” and the Fed can “afford to be patient.” Inflation will “gradually move lower” as tariff and energy effects fade. Did not endorse a cut timetable.
- Lisa Cook (Fed Governor, Bloomberg/Reuters, 23 May 2026): “Prepared to support further policy firming” if inflation progress “stall[s] or reverse[s].” Cited upside risks from geopolitical developments and energy prices. Said she would “not hesitate” to back a hike if data showed renewed acceleration.
- Austan Goolsbee (Chicago Fed President, Financial Times, 22 May 2026): Wants “several more months of improving inflation data” before supporting cuts. Warned that AI-driven productivity optimism could itself become “an inflation risk if demand gets ahead of real capacity gains.” Characterised policy as “restrictive but not crushing.”
- John Williams (New York Fed President, WSJ, 21 May 2026): “Too soon to be talking about rate cuts.” Hikes remain implicitly on the table if inflation persists, though this is not his base case.
- Jerome Powell (Fed Chair, Bloomberg/WSJ, 14 May 2026): Prepared to keep rates at current levels “for as long as needed.” Did not rule out hikes but characterised them as “not our baseline.”
Lisa Cook, 23 May 2026: “Prepared to support further policy firming” if inflation progress “stall[s] or reverse[s].”
The March 2026 FOMC dot plot showed a median expectation of one 25 basis point cut in 2026. No new dot plot arrives until the June 2026 meeting. Between now and then, every data release carries outsised weight because it could tip the internal debate in either direction. Jefferson’s patience and Cook’s conditional hawkishness represent two plausible paths from the same starting point.
The arrival of Kevin Warsh as Fed Chair on 22 May 2026 adds a layer of institutional hawkishness beyond the current committee’s debate; Warsh holds a structurally higher neutral rate view than his predecessor and has signalled support for accelerating quantitative tightening, which could amplify the policy tightening bias already visible in Cook’s and Williams’s public statements.
Why the bond market is ignoring the Fed’s hawkish signals
What the yield move signals about growth expectations
The 10-year Treasury yield closed at 4.455% on 29 May 2026, down 3 basis points on the session and approximately 23 basis points lower over the preceding six sessions, its lowest closing level since 12 May 2026. The VIX settled at 15.74, down 3.38% on the day.
Officials are talking tougher. Yields are falling. The apparent contradiction resolves once the bond market’s forward logic becomes visible.
Falling real yields and breakeven inflation rates suggest markets see lower trend growth and some eventual inflation easing, not an immediate recession call. According to Bloomberg, foreign and liability-driven buyers at yields above 4.4% are providing structural support for longer maturities, adding a demand layer independent of the macro outlook.
Foreign and liability-driven buyers providing structural demand above 4.4% reflects a broader bond yield normalisation thesis, where 30-year yields near 5.1% are consistent with pre-QE historical ranges rather than crisis-level pricing, a frame that matters for investors deciding whether duration is a tactical opportunity or a structural trap.
What the market is pricing
The dynamic is bull-flattening: front-end rates remain anchored by near-term “higher for longer” expectations, while longer maturities are rallying on expectations that tight policy will eventually weigh hard enough on growth to force easing in 2027. Futures markets are assigning a higher probability to no hikes in 2026 and modest cuts starting the following year.
A rates strategist at TD Securities told Reuters on 28 May 2026: “The Fed is talking tough, but the bond market is looking at 1.6% growth and sticky inflation and saying: this is a policy mistake in the making.”
The Financial Times described the move as “policy-error hedging.” Bloomberg framed it as “a divergence between what Fed officials say they are prepared to do and what investors believe they will ultimately have to do.” The gap between rhetoric and pricing is not academic. It directly affects whether duration adds or subtracts from portfolio performance, and whether investors following the Fed’s words are positioned for the right scenario.
Treasury yields as policy signals have taken on a new primacy in 2026; Wolfe Research, Bloomberg Opinion, and Apollo have each concluded that bond market stress now functions as the primary forcing mechanism on White House decision-making, displacing the equity selloff as the pressure lever that historically triggered policy pivots.
Soft patch or stagflation warning? How to read the current configuration
Six institutions have put a label on this environment. None of them have called it outright stagflation. None of them have dismissed the risk entirely.
- Goldman Sachs (FT, 29 May 2026): “Consistent with a soft-landing trajectory, though with elevated inflation making the mix uncomfortable for the Fed.” Characterised the situation as “not yet stagflation but moving in that direction if disinflation stalls.”
- Bank of America (WSJ, 29 May 2026): “Late-cycle slowdown, not an imminent recession.” Warned that “if inflation stays near 4% with growth below 2%, stagflation narratives will grow louder.”
- JPMorgan (FT, 28 May 2026): Drew parallels to late-2018/early-2019, when the Fed was tightening into a slowdown and then pivoted abruptly.
- PIMCO (FT, 26 May 2026): Framed the configuration as “late-cycle 1994-1995 rather than the 1970s,” with a risk of policy overshoot but a plausible soft landing.
- BlackRock (Reuters, 26 May 2026): Argued that structural forces, including demographics, technology, and global competition, limit the likelihood of a sustained 1970s-style wage-price spiral.
- Bloomberg (27 May 2026): “Stagflation-lite risk, not a full replay of the 1970s.”
The historical analogues cluster around the same conclusion: today’s mix of approximately 3.8% PCE and 1.6% GDP growth is uncomfortable but structurally different from the worst precedents. Inflation expectations are better anchored, the labour market has not deteriorated sharply, and the Fed’s credibility is higher than it was in the mid-1970s. How investors label this environment has direct allocation consequences. Stagflation calls favour real assets and short duration; soft-landing calls favour quality growth and moderate duration. The label matters.
What institutional strategists are doing with portfolios right now
The dominant institutional theme is a barbell construction: quality cash-generative equities on one side, high-quality intermediate-to-long duration fixed income on the other, with targeted inflation hedges as a third element. When strategists at six firms with different mandates and risk tolerances arrive at similar portfolio shapes, the convergence itself carries information.
Equities: quality over beta
Goldman Sachs (Bloomberg, 28 May 2026) is overweight quality US large caps with strong free cash flow and pricing power, favouring technology platforms, semiconductors tied to AI infrastructure, and healthcare. JPMorgan (FT, 27 May 2026) is tilting toward quality value sectors: healthcare, staples, and selected industrials positioned to benefit from reshoring and infrastructure demand. Bank of America (WSJ, 28 May 2026) is running a barbell within equities: defensive growth (healthcare, utilities, staples) on one end and energy and infrastructure-linked industrials on the other.
The shared logic across all three: pricing power, free cash flow generation, and balance sheet quality are the selection filters in an environment where funding costs remain elevated. All are avoiding unprofitable growth, highly leveraged cyclicals, and high-yield credit where late-cycle default risk is rising.
Fixed income and inflation hedges
BlackRock (Reuters, 28 May 2026) holds a moderate overweight in high-quality duration, including US Treasuries and agency mortgage-backed securities, while underweighting high yield. PIMCO (FT, 26 May 2026) favours a 5-10 year core duration position with tactical extension to longer maturities as a hedge against a sharper downturn, overweighting agency MBS and investment-grade corporates. Morgan Stanley (WSJ, 27 May 2026) is instructing clients to add duration on dips above 4.5% in the 10-year, a specific tactical entry point for readers monitoring yields, and to rotate from floating-rate loans into higher-quality fixed-rate credit.
On real assets, UBS (Bloomberg, 27 May 2026) carries a modest overweight to gold, supported by central bank demand and real-yield dynamics, with selective energy equities over broad commodities. Bank of America recommends TIPS and gold as complementary inflation hedges, particularly if core PCE remains above 3%, alongside short-term T-bills for optionality amid policy uncertainty.
| Asset Class | Institutional Bias | Key Institutions | Rationale |
|---|---|---|---|
| Quality large-cap equities | Overweight | Goldman Sachs, JPMorgan, Bank of America | Pricing power and cash flow resilience at elevated funding costs |
| High-quality duration (USTs, agency MBS, IG credit) | Moderate overweight | BlackRock, PIMCO, Morgan Stanley | Income generation plus hedge against sharper growth slowdown |
| Gold and TIPS | Modest overweight | UBS, Bank of America | Inflation and policy-error hedge |
| High yield and leveraged loans | Underweight | BlackRock, Morgan Stanley | Late-cycle default risk; tightening credit conditions |
| Unprofitable growth equities | Underweight | Goldman Sachs, Bank of America | Vulnerable to sustained high rates and earnings compression |
Understanding the stagflation concept and why this moment is genuinely different
Stagflation describes the simultaneous occurrence of three conditions: stagnant or contracting economic growth, elevated inflation, and high or rising unemployment. The combination neutralises standard monetary policy tools because tightening to fight inflation deepens the growth slowdown, while easing to support growth risks accelerating prices further. The central bank is caught between two mandates pulling in opposite directions.
The term entered mainstream vocabulary during the 1970s, when oil supply shocks, wage-price spiral dynamics, and a Fed that initially failed to act decisively created a decade-long episode. PCE inflation peaked above 10% during that cycle.
Applied to the current data, the three conditions measure as follows:
- Stagnant growth: Q1 2026 GDP at 1.6% annualised is below trend but still positive. Growth is slowing, not contracting.
- Elevated inflation: April PCE at 3.8% year-on-year is well above the Fed’s 2% target. This condition is present.
- High unemployment: The labour market has not deteriorated sharply. This condition is not present.
Two of the three conditions are partially or fully met. The third, which historically distinguished genuine stagflation from a difficult growth-inflation mix, remains absent. According to BlackRock (Reuters, 26 May 2026), structural forces including demographics, technology, and global competition limit the likelihood of a sustained wage-price spiral. Bloomberg characterised the current environment on 27 May 2026 as “stagflation-lite risk, not a full replay of the 1970s.”
The distinction between “stagflation-lite” and a full stagflationary regime is not semantic. Investors who conflate the two may overweight real assets and underweight quality duration at precisely the wrong time. Getting the label right matters for getting the allocation right.
The investor’s verdict on a divided Fed and an uncertain growth path
The tension will not resolve on its own. The Fed is prepared to hold or hike, bond markets are pricing eventual cuts, and growth is slowing without collapsing. Three specific data signals will determine which path materialises:
- Core PCE trajectory: Sustained readings above 3% into Q3 2026 would make Cook’s hike-readiness language the operative signal, per the framing from both Cook and Goolsbee.
- Q2 GDP: A print at or below 1.5% (Morgan Stanley’s low-end forecast) would strengthen the bond market’s policy-error thesis. A reading above 1.8% would support the Fed’s patience.
- 10-year yield direction: Any reversal of the recent rally would suggest the market is reconverging with the Fed’s hawkish rhetoric rather than fading it.
Goldman Sachs (FT, 29 May 2026): “Not yet stagflation but moving in that direction if disinflation stalls.”
The barbell quality construction that six institutional strategists have converged on is not a prediction that stagflation arrives or that the soft landing succeeds. It is a structure explicitly built to survive both scenarios without requiring a directional call. The June 2026 FOMC meeting, where a new dot plot will either confirm or revise the March 2026 median expectation of one cut, is the next formal inflection point. Until then, the data will do the talking.
This article is for informational purposes only and should not be considered financial advice. Investors should conduct their own research and consult with financial professionals before making investment decisions. Past performance does not guarantee future results. Financial projections are subject to market conditions and various risk factors.