
The personal consumption expenditures (PCE) price index posted its highest year-over-year reading since May 2023 when March 2026 data landed. The consumer price index (CPI) accelerated further, reaching 3.8% year-over-year in April 2026. With the Bureau of Economic Analysis (BEA) scheduled to release the next PCE print during the week of 28 May 2026, the inflation debate in US markets has sharpened considerably.
Investor anxiety is understandable. Elevated energy costs tied to Middle East tensions have kept headline inflation figures running hotter than consensus expected at the start of the year. But reading the same data through a different lens produces a different conclusion. Fisher Investments has taken a contrarian position, arguing that subdued money supply growth means this spike carries less lasting power than the numbers imply. The disagreement is not about the data itself; it is about what the data means for the trajectory ahead.
What follows is an examination of both sides of the US inflation debate in 2026: the headline numbers driving market anxiety, the monetary mechanism behind the contrarian case, and what the coming PCE release could mean for investors positioned in US equities.
The inflation numbers that are rattling markets right now
Two data series have dominated the conversation. CPI, the more widely cited measure, accelerated from 3.3% year-over-year in March 2026 to 3.8% in April 2026. The PCE index, which carries greater weight in Federal Reserve deliberations, printed at 3.5% year-over-year in March, its highest level in nearly three years.
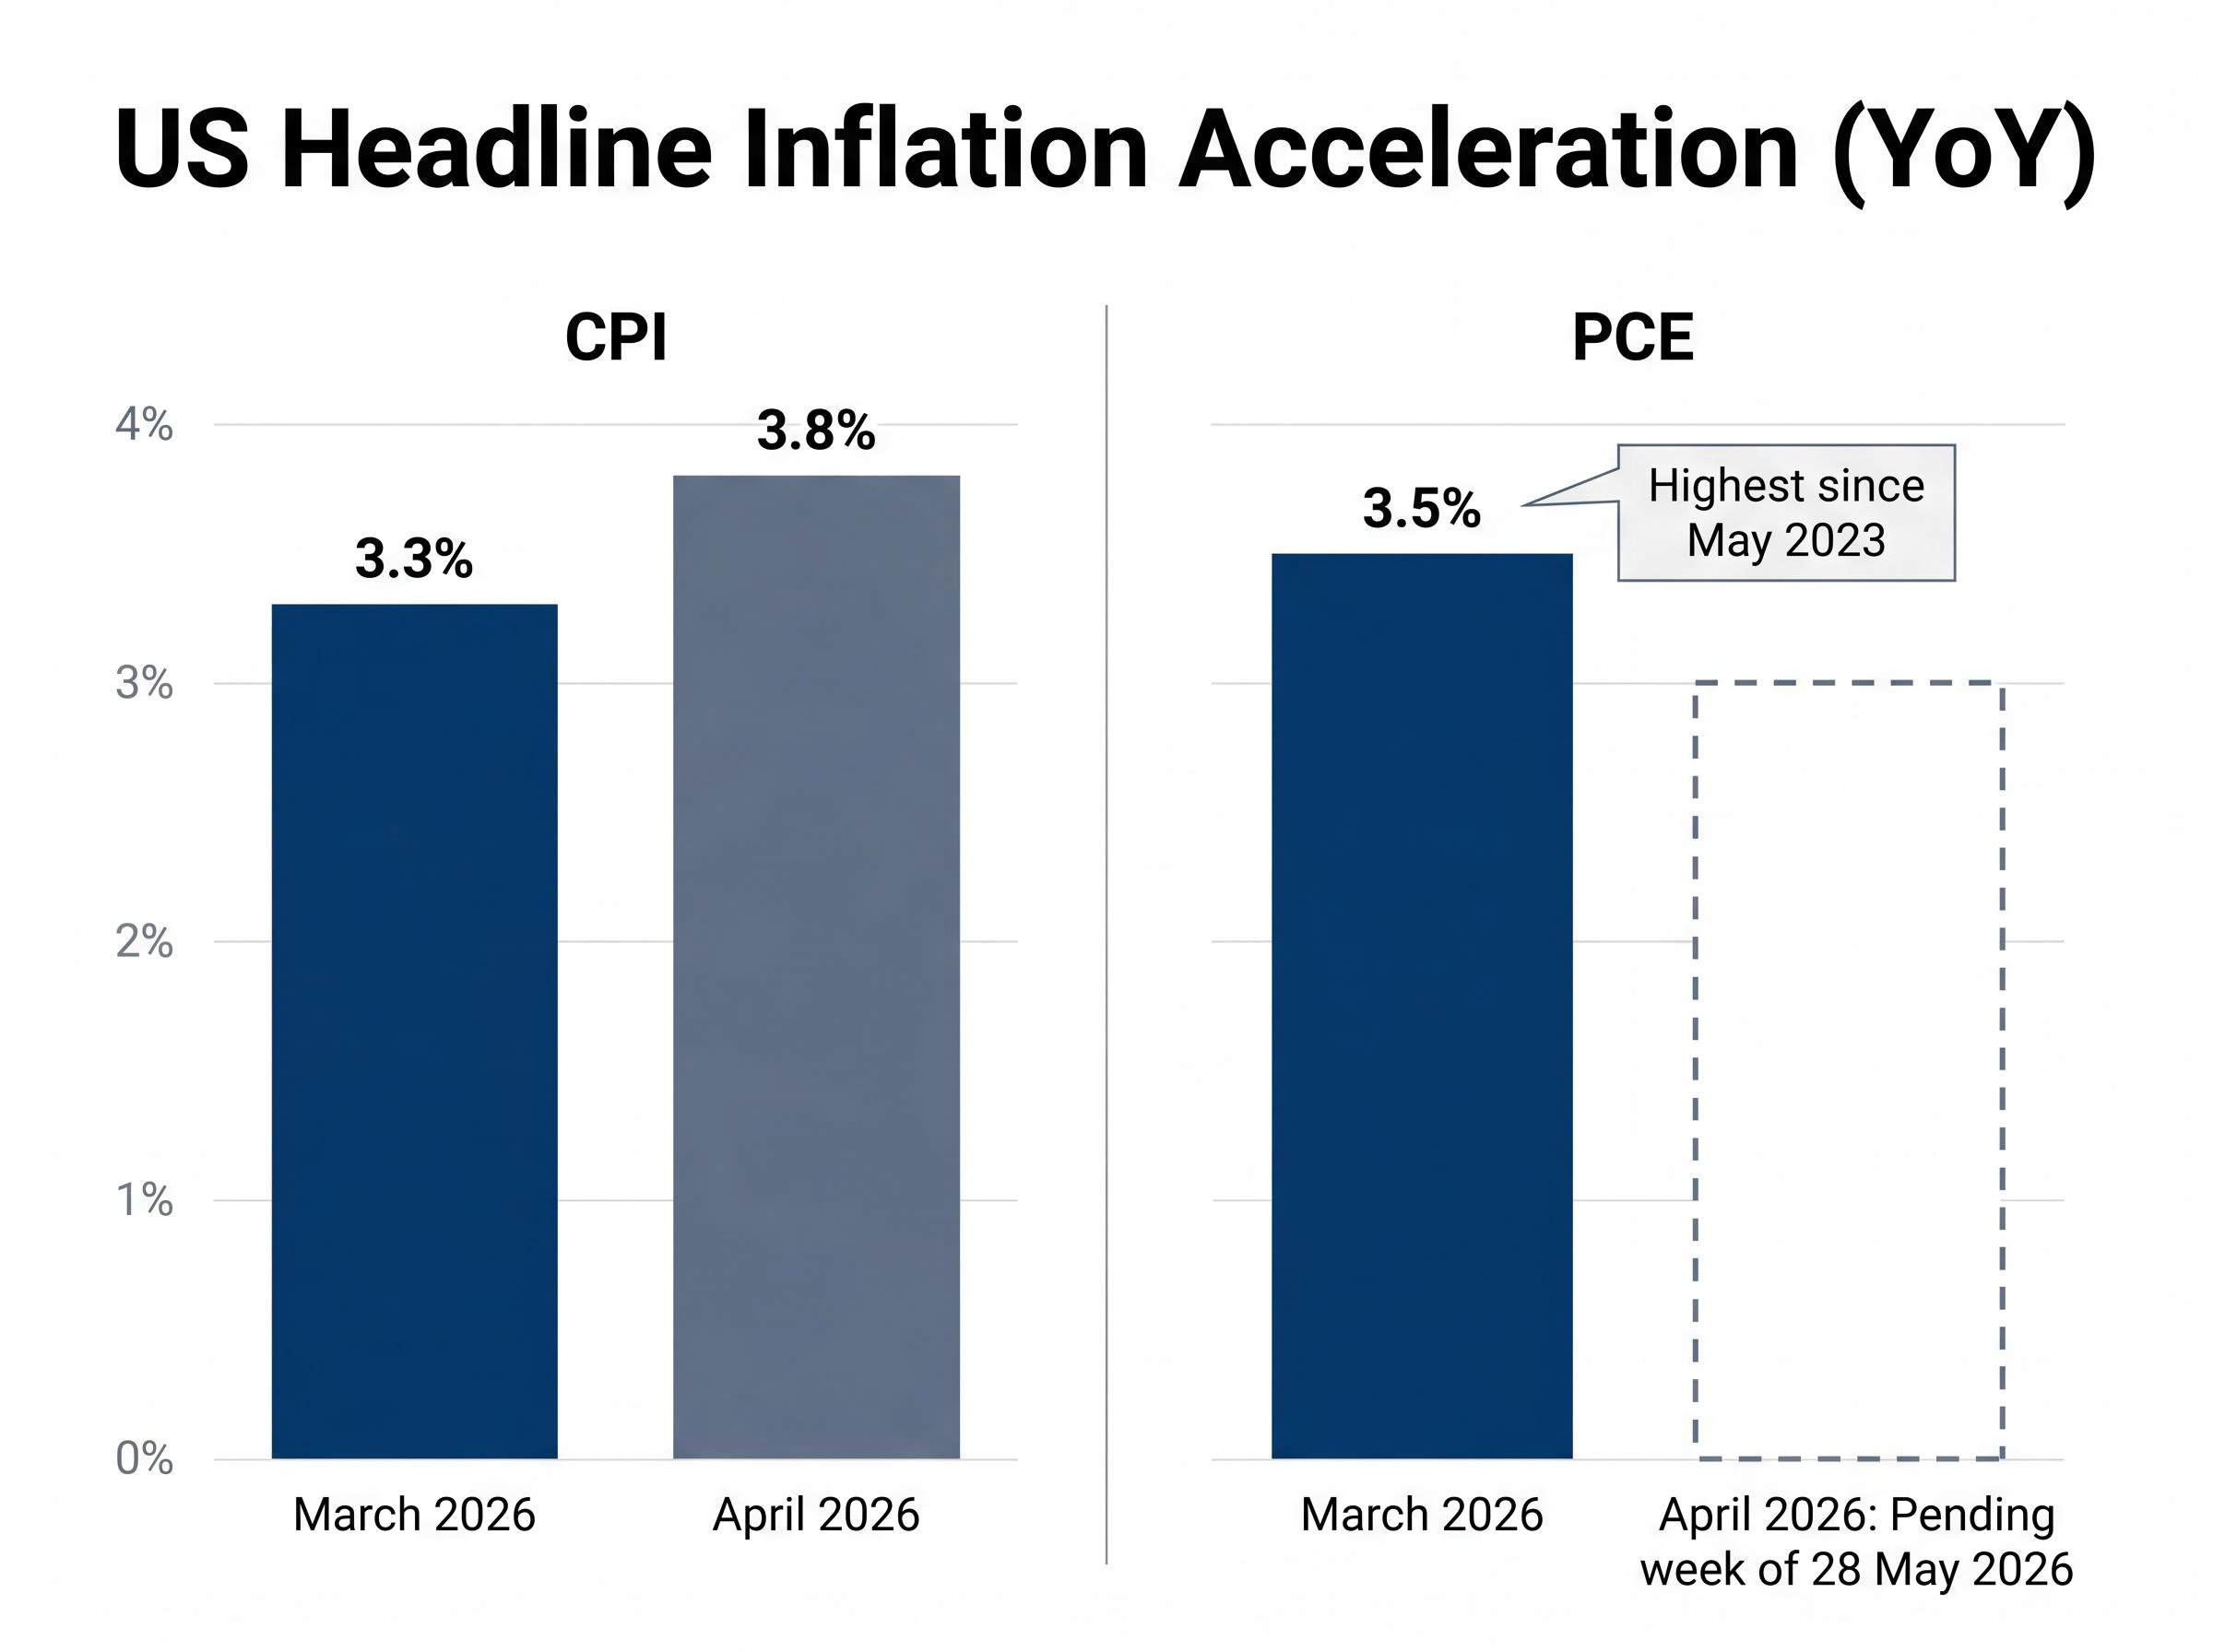
| Measure | March 2026 (YoY) | April 2026 (YoY) |
|---|---|---|
| CPI (Headline) | 3.3% | 3.8% |
| PCE (Headline) | 3.5% | Pending (week of 28 May 2026) |
The acceleration pattern is what unnerves markets. A single elevated print can be dismissed as noise. Two consecutive months of acceleration, across both gauges, raises the question of whether the disinflationary trend that defined late 2024 and much of 2025 has reversed.
Why PCE carries more weight than CPI for policy decisions
The Federal Reserve has long favoured the PCE index over CPI when calibrating monetary policy. PCE captures a broader basket of consumer spending and, unlike CPI, adjusts for substitution behaviour, meaning it accounts for consumers shifting to cheaper alternatives when prices rise in specific categories. This makes PCE a more accurate reflection of the actual cost pressures households face.
The Federal Reserve’s PCE inflation guidance confirms that the PCE index is preferred precisely because it reflects a broader scope of household spending and adjusts for substitution behaviour, properties that make it a more accurate measure of the cost pressures the Fed is trying to bring toward its 2% target.
The practical implication is straightforward: when the Fed signals its inflation outlook, it is referencing PCE. A 3.5% PCE reading therefore carries more institutional consequence for the rate path than a CPI print of equivalent magnitude.
When big ASX news breaks, our subscribers know first
What is driving the spike, and where it has (and has not) spread
Energy costs have been the dominant force pushing headline numbers higher. Middle East tensions have sustained elevated oil prices over recent months, and that pressure has flowed predictably into transport, logistics, and energy-intensive manufacturing categories.
The transmission mechanism from the Strait of Hormuz closure on energy costs to broader consumer prices is more direct in some categories than others; gasoline, airfares, and utility bills absorbed the shock quickly, while petrochemical-intensive goods categories showed far more muted responses in the same period.
The more telling question is where the pressure has not appeared. If elevated energy costs were translating into a broad-based price resurgence, that pass-through would be visible across goods categories with significant energy or petrochemical input costs.
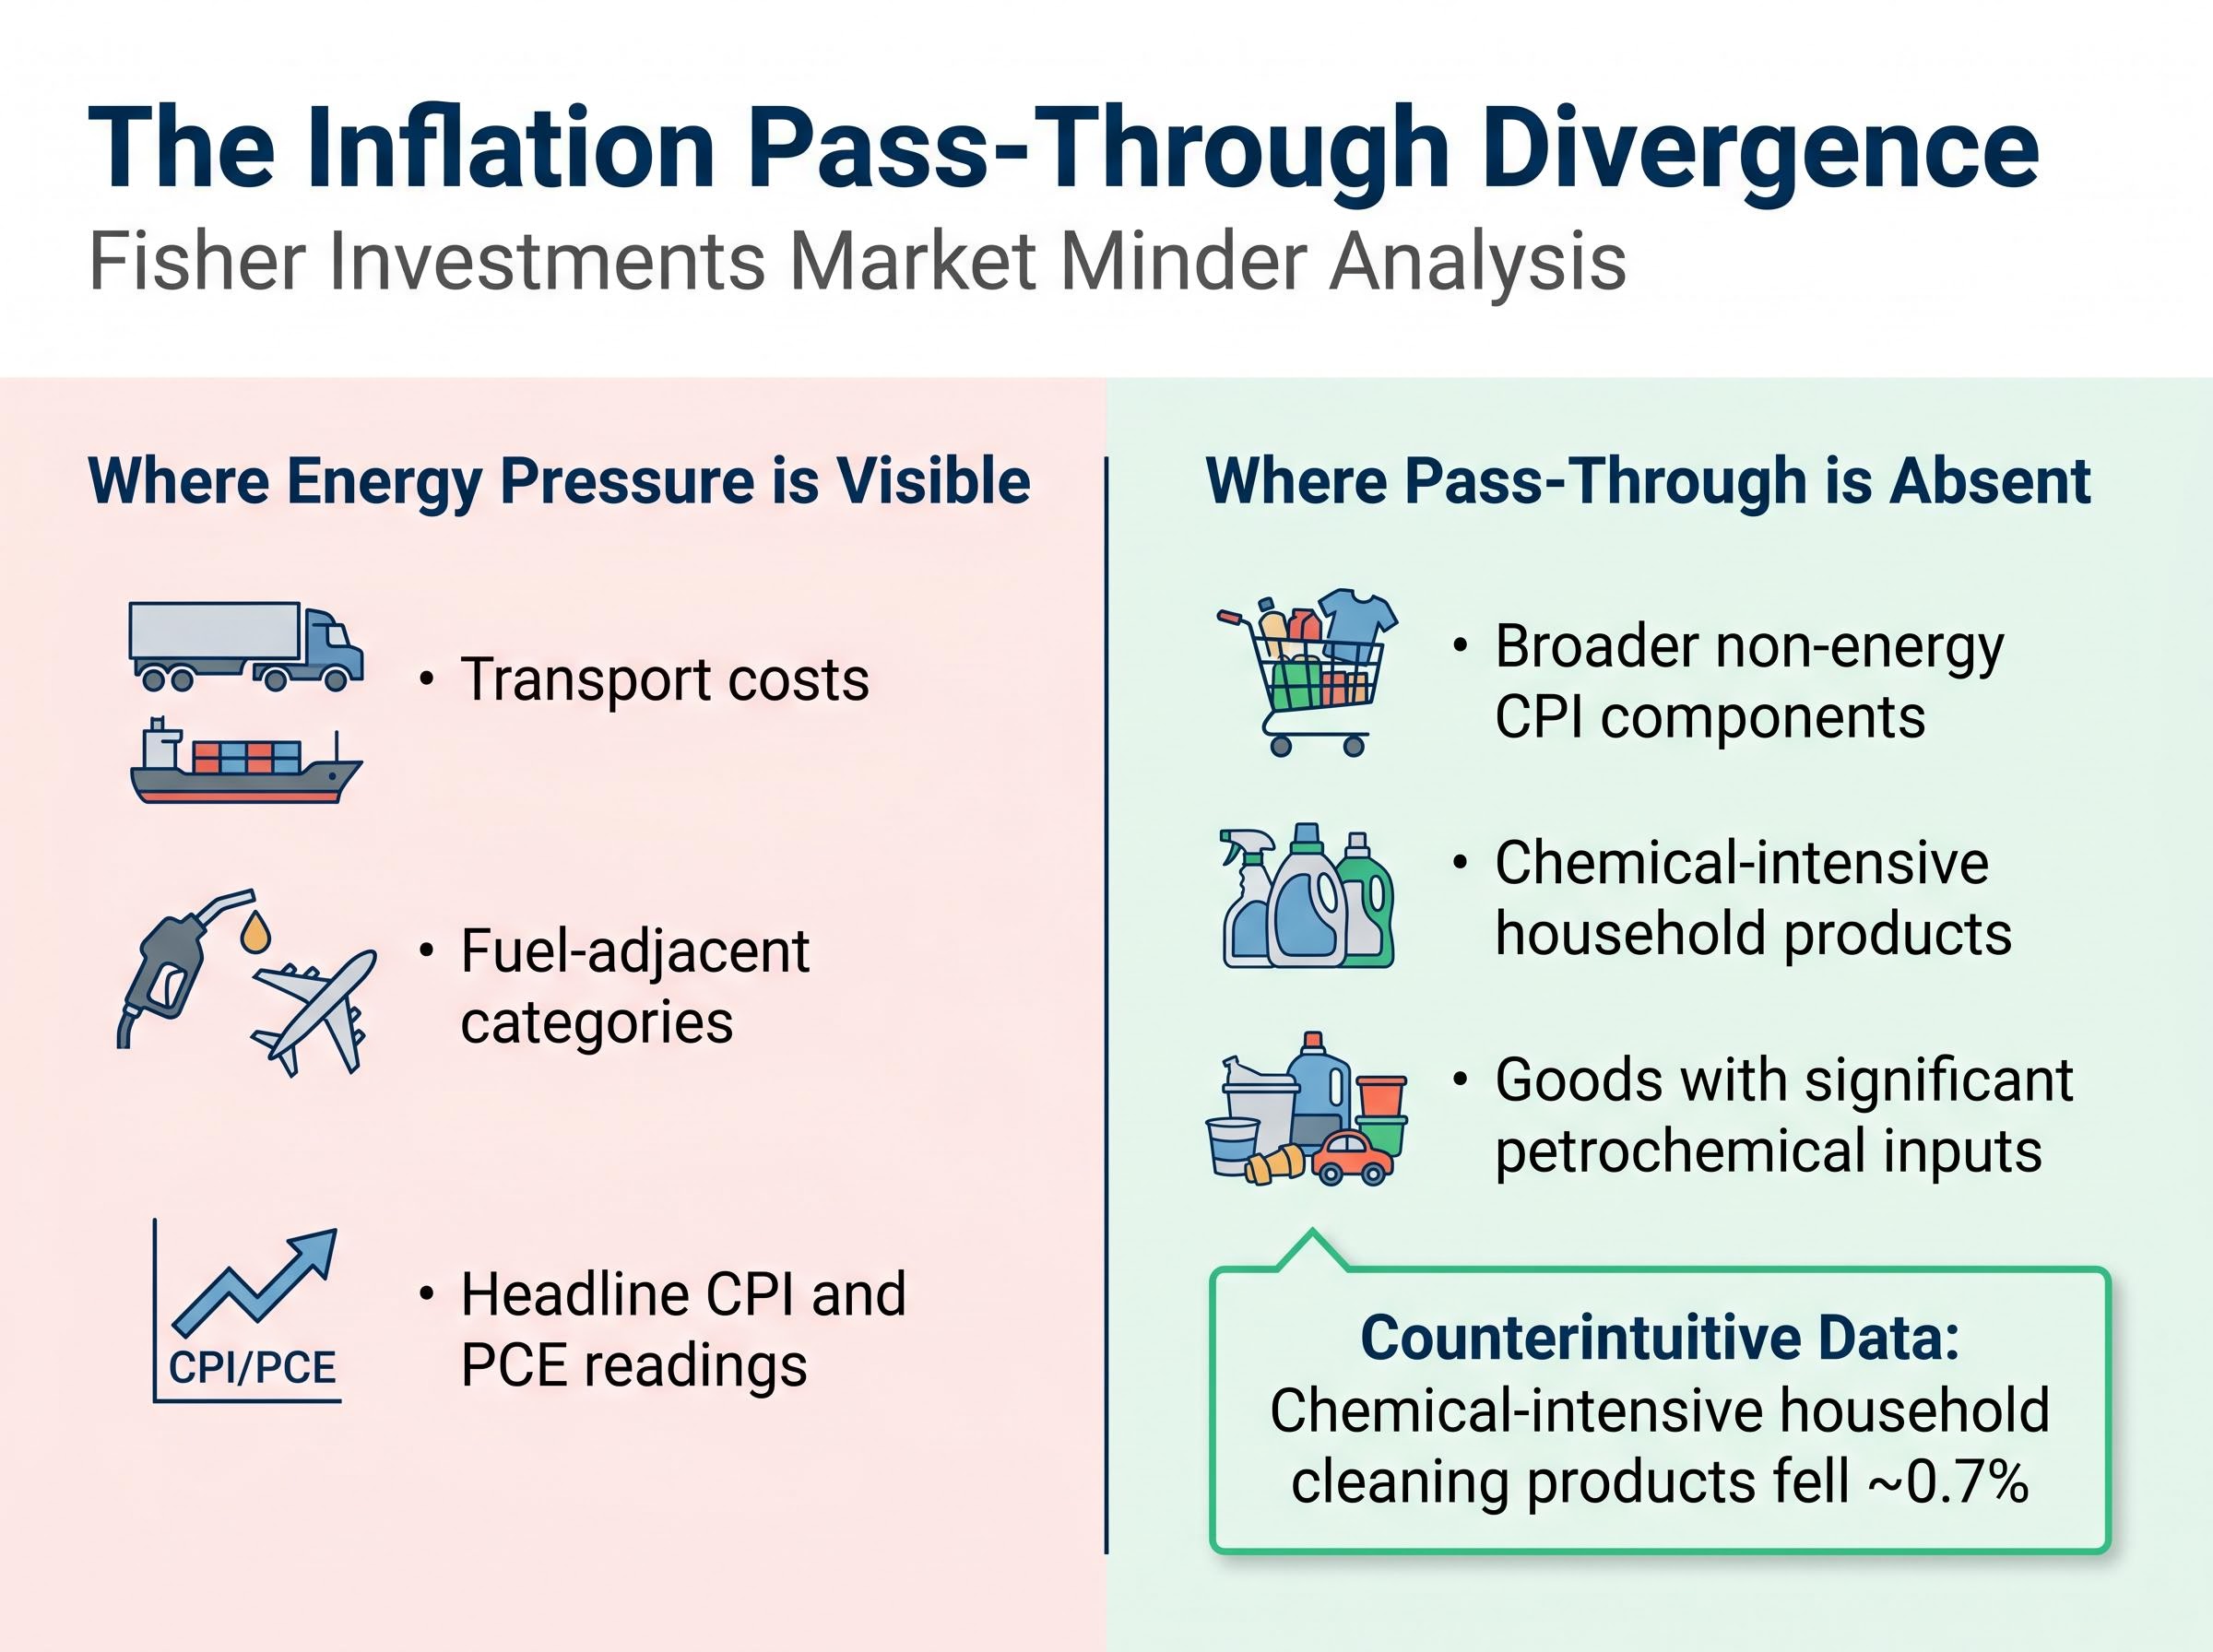
According to Fisher Investments’ Market Minder analysis, that pass-through has been conspicuously absent in several categories:
- Where energy pressure is visible: transport costs, fuel-adjacent categories, and headline CPI and PCE readings
- Where it has not appeared: chemical-intensive household products, broader non-energy CPI components, and goods categories where petrochemical inputs represent a significant share of production costs
Prices for chemical-intensive household cleaning products fell approximately 0.7% in the most recently reported month, according to Fisher Investments, a counterintuitive data point for anyone assuming elevated oil prices automatically translate into higher shelf prices.
That distinction matters. A headline inflation reading driven primarily by energy, without confirmed pass-through into the broader consumption basket, describes an energy shock rather than a systemic price resurgence. These two scenarios imply very different trajectories for equity valuations and Federal Reserve policy.
What investors have historically gotten wrong about inflation spikes
Equity markets are forward-looking instruments. By the time the BEA publishes a PCE reading or the Bureau of Labor Statistics releases CPI, the data reflects economic conditions that prevailed weeks or months earlier. Market prices, by contrast, have already absorbed expectations about that data and moved on to pricing the next development.
This creates a recurring pattern of misallocation. Investors see an alarming inflation headline, assume the trend will continue, and reposition defensively, often after the market has already priced in the concern.
Fisher Investments has noted that forward-looking indicators, including a steepening US yield curve and positive purchasing manager index (PMI) readings, continue to point toward economic expansion, even as backward-looking inflation prints run hot. Their argument is that the signals most relevant to future market direction are telling a different story from the signals that measure what already happened.
Leading indicators versus lagging indicators in an inflation debate
CPI and PCE are lagging indicators. They measure price changes that have already occurred in the real economy. Leading indicators, such as the yield curve (the spread between short-term and long-term Treasury rates), PMI surveys, and M2 money supply growth, offer a read on the direction of economic activity and pricing conditions before those conditions appear in published data.
Fisher Investments places greater analytical weight on leading indicators when assessing market direction. Their reasoning is that equity prices discount future conditions, not past ones, and lagging data is therefore less informative about forward returns than many investors assume.
The yield curve as a policy pressure lever has taken on a different character in 2026 than in prior cycles: with the 30-year Treasury at 5.18%, bond market stress is functioning as an independent tightening mechanism that operates alongside, rather than in response to, Fed rate decisions, complicating the standard framework for reading rate-sensitive equity sectors.
The broader economic context reinforces this framing. Q1 2026 initial GDP came in at an annualised growth rate of 2.0%, a meaningful recovery from 0.5% in Q4 2025. The economy into which these inflation readings are landing is expanding, not contracting, a backdrop that complicates the narrative of a purely negative inflation shock.
The monetary mechanism behind Fisher Investments’ contrarian view
Fisher Investments’ argument rests on a specific causal chain. It is not simply a prediction that inflation will fall; it is a structural claim about how sustained inflation operates and why the current conditions may not support it.
The logic proceeds in three steps:
- Input costs rise. Elevated energy prices increase production costs for firms across the economy.
- Firms attempt to pass those costs through to consumers. This is the natural business response to margin compression.
- Pass-through succeeds only if money supply growth has expanded consumer spending capacity. Without sufficient growth in M2 (the broad measure of cash, deposits, and near-cash assets in the economy), consumers lack the spending power to absorb higher prices. Firms that attempt to raise prices into weak demand find that volumes fall instead, compressing margins rather than sustaining inflation.
Corporate margin absorption rather than consumer price pass-through is the mechanism Fisher Investments identifies as the likely outcome when M2 growth is insufficient to support higher shelf prices, a dynamic that earnings season data can quantify in near-real time, often weeks before the BEA or BLS publish the official inflation and GDP readings that confirm what corporate results already revealed.
Fisher Investments has characterised M2 money supply growth as subdued at the time of their analysis. The specific growth figure was not independently confirmed, but the direction of their argument is clear: without M2 acceleration, the monetary fuel for sustained consumer price increases is absent.
The Federal Reserve H.6 Money Stock Measures release, updated through April 2026, provides the official M2 figures that underpin the monetary constraint argument; investors tracking the contrarian thesis can use this data to monitor whether broad money growth has accelerated beyond the subdued levels Fisher Investments identifies as the binding condition.
This framing does not deny that inflation readings are elevated. It argues that the mechanism required to sustain them, broad money supply growth sufficient to underwrite higher consumer spending, is not present. The implication is that firms facing elevated input costs are more likely to absorb those costs through lower margins than to pass them on successfully.
The conditions under which this view would break down are equally specific. If M2 growth were to accelerate meaningfully, or if energy cost pass-through into non-energy goods categories were to materialise in subsequent data releases, the binding constraint Fisher Investments identifies would loosen, and the argument for transitory inflation would weaken.
What this means if inflation does come in better than expected
Fisher Investments has explicitly framed a below-consensus PCE reading as a “positive surprise opportunity” for investors. The reasoning is that market consensus has positioned for continued inflation acceleration; a softer print would force a reassessment.
The two scenarios facing investors ahead of the 28 May 2026 PCE release can be mapped simply:
The FOMC’s dual-mandate conflict between 3.5% PCE inflation and rising unemployment to 4.3% is precisely the policy environment that makes the upcoming PCE print consequential: a softer reading gives the committee cover to hold without signalling further tightening, while a hotter print narrows the already constrained space between the three hawkish dissenters and the lone dovish voice at the April meeting.
- PCE comes in softer than expected: Relief in rate-sensitive sectors, a repricing of Fed rate path expectations toward earlier easing, and potential upward pressure on equity valuations as the inflation overshoot narrative loses conviction.
- PCE comes in hotter than expected: Reinforcement of the inflation persistence narrative, further repricing of rate expectations toward “higher for longer,” and continued pressure on duration-sensitive assets.
The conditions that would invalidate the contrarian thesis are measurable: sustained M2 acceleration beyond current levels, or confirmed energy cost pass-through into non-energy goods categories in subsequent CPI and PCE component data. Neither condition has been confirmed in the data available at the time of writing.
The analytical value of this framework is in its asymmetry. If consensus has already priced in elevated inflation, a negative surprise carries limited additional downside. A positive surprise, by contrast, would catch positioning off guard, creating a more pronounced market response in the other direction.
The case for staying analytically grounded as the next data print approaches
The headline data looks alarming. A 3.8% CPI and a 3.5% PCE reading are not numbers any central banker would welcome, and the acceleration pattern across consecutive months is real. The anxiety those figures have produced is proportionate to the readings themselves.
But the monetary and microeconomic evidence Fisher Investments cites argues for restraint before concluding that a sustained inflation resurgence is underway. Subdued M2 growth, absent pass-through into non-energy goods, and leading indicators still pointing toward expansion all complicate the straightforward “inflation is back” reading.
The week of 28 May 2026 will provide the next empirical test. Investors monitoring the situation have two specific variables to watch:
- M2 money supply growth trajectory: Any acceleration would strengthen the case for sustained inflation; continued subdued growth would reinforce the contrarian view.
- Energy-to-non-energy price pass-through: Component-level data showing elevated energy costs flowing into broader goods categories would challenge the “contained shock” thesis.
- PCE headline and core readings: The gap between headline and core PCE will indicate how much of the inflation story remains energy-driven versus broad-based.
Fisher Investments’ broader observation is that inflation coming in better than feared would constitute a market-positive development that consensus has not fully priced. Whether that reading materialises is uncertain. The analytical posture worth carrying into the release is one that watches the mechanism, not just the headline.
This article is for informational purposes only and should not be considered financial advice. Investors should conduct their own research and consult with financial professionals before making investment decisions. Past performance does not guarantee future results. Financial projections are subject to market conditions and various risk factors.