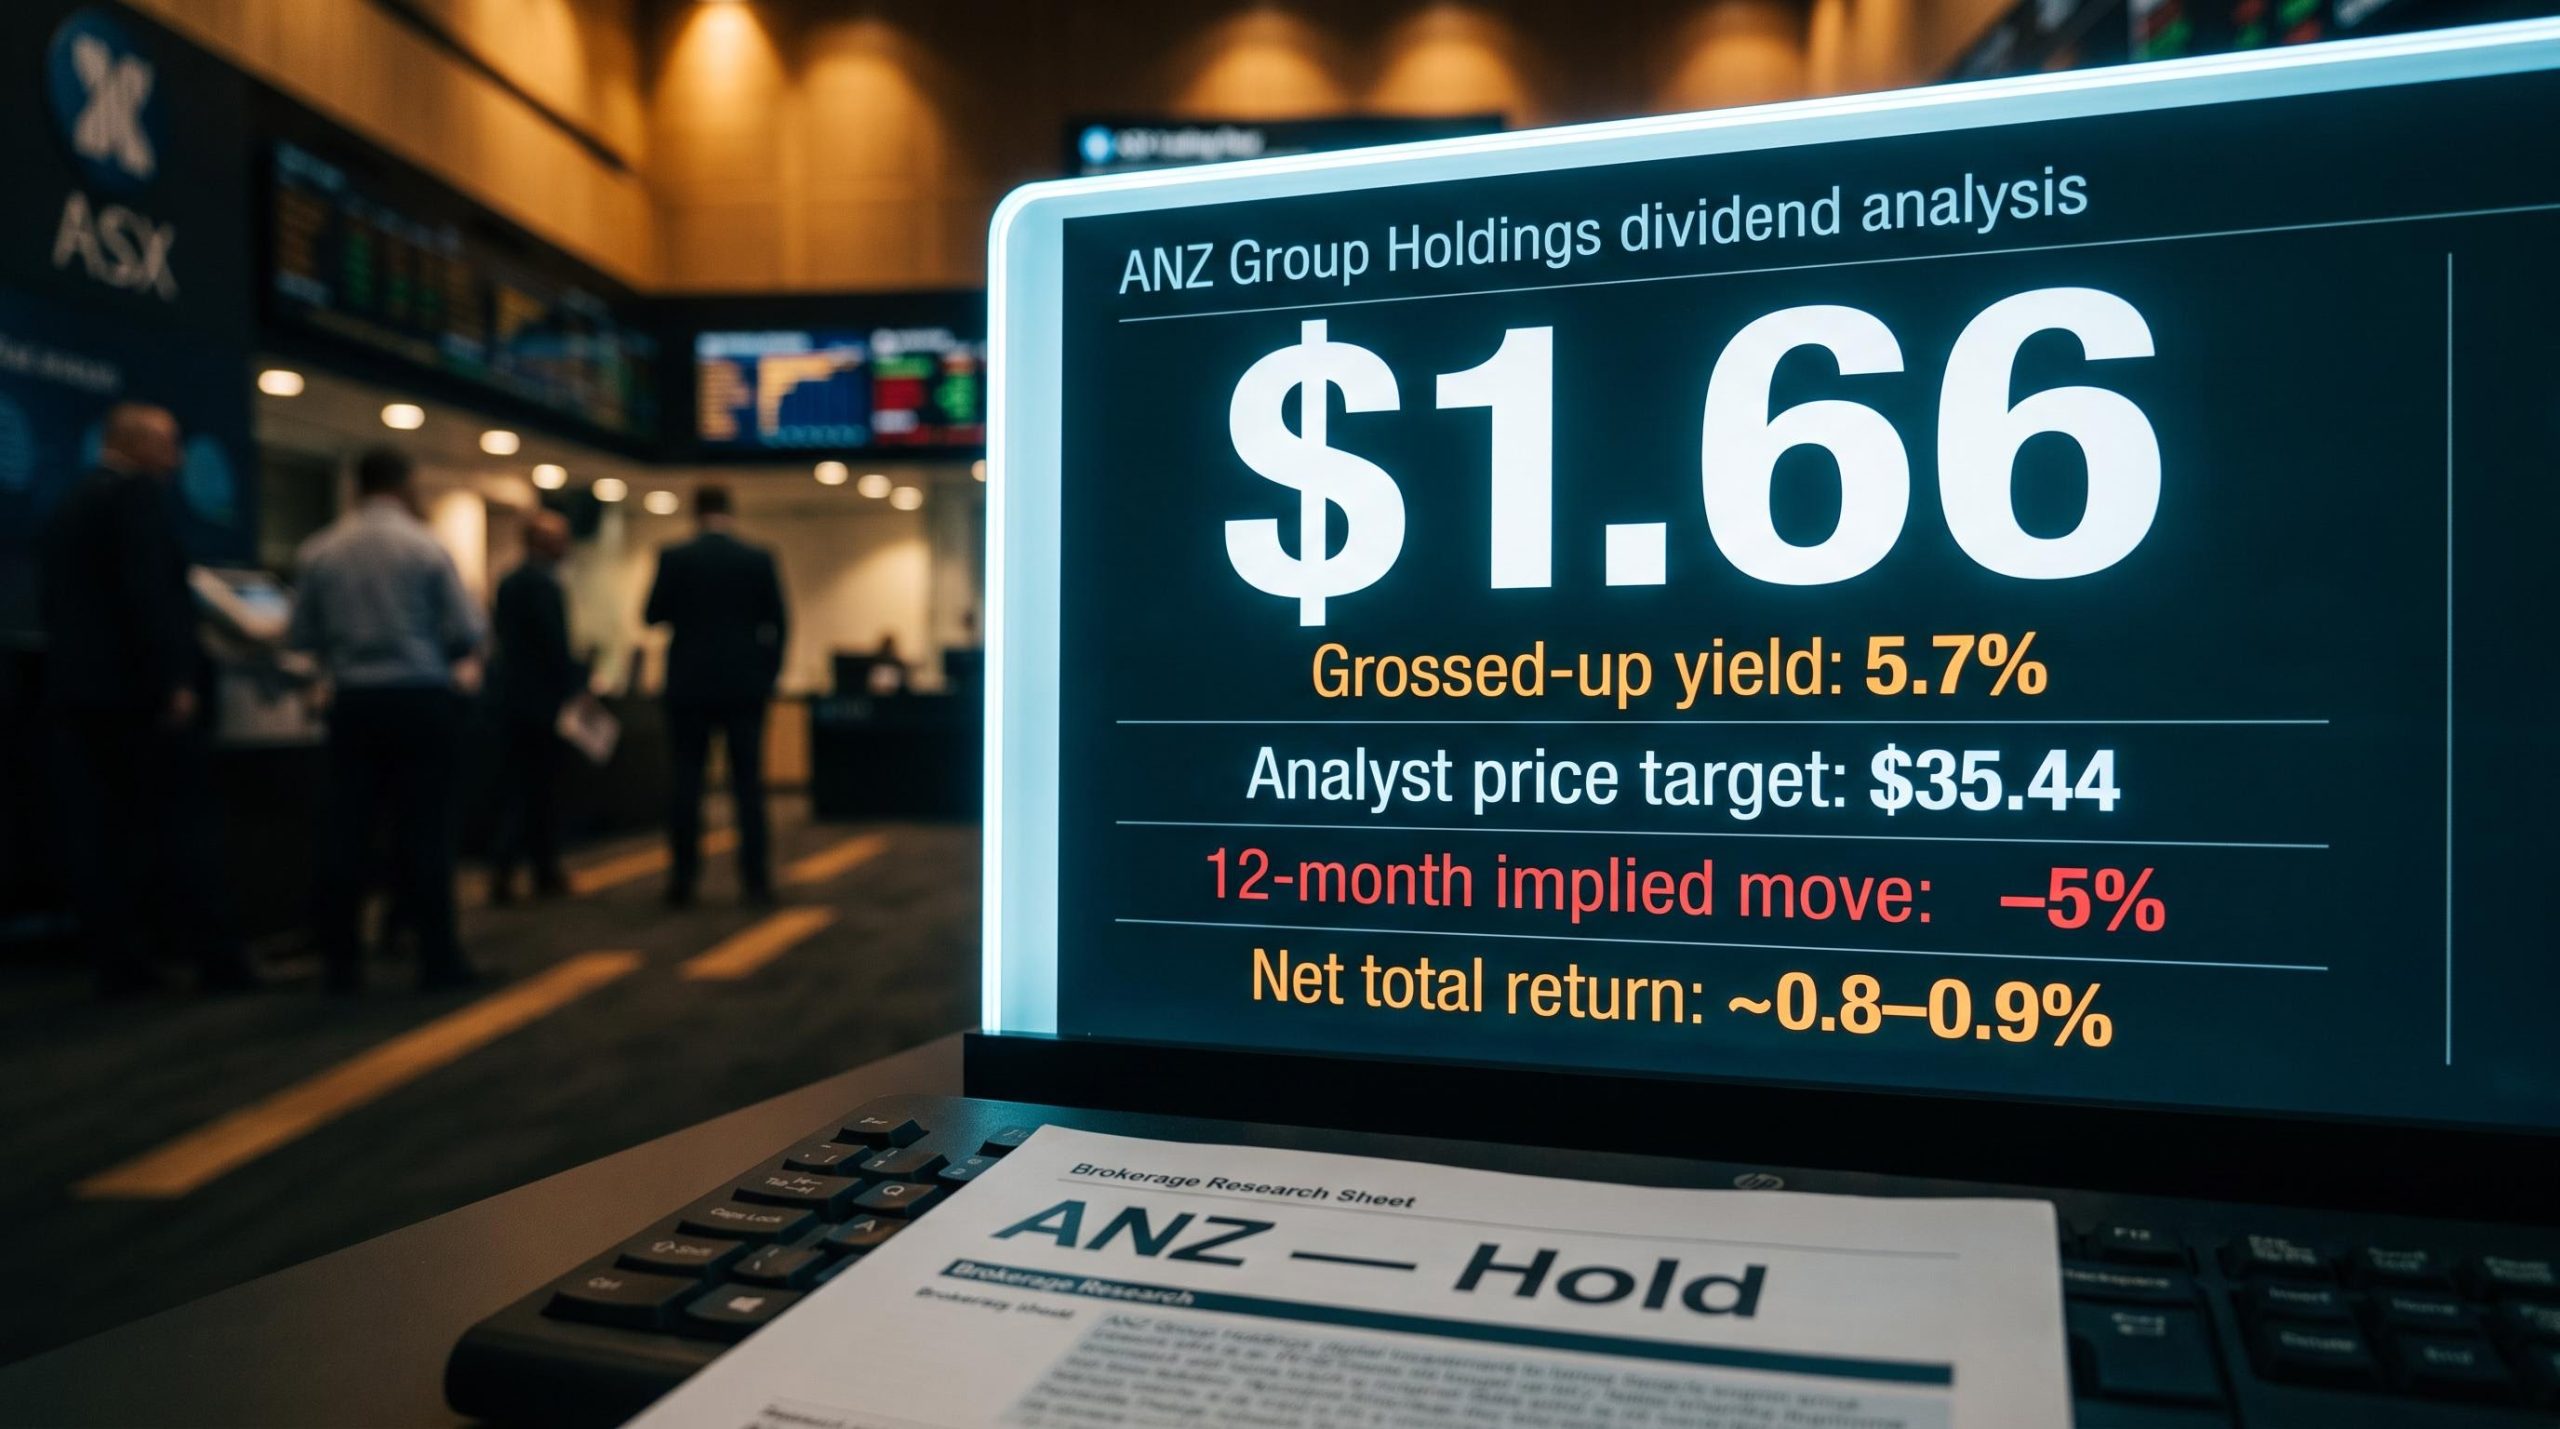
ANZ Group Holdings pays $1.66 per share in annual dividends right now, and on paper that translates to a grossed-up yield north of 5.7%. For an income investor scanning the ASX, that number looks like a reason to buy.
It is not that simple. Analyst consensus points to a roughly 5% share price decline over the next twelve months, which means the capital loss on a typical position would quietly consume most of that dividend income. The gap between the headline yield and the probable total return is where the real decision lives, and it hinges on two variables most investors do not think about carefully enough: their tax position and their time horizon.
Here is what the numbers actually tell you about whether ANZ‘s dividend is worth holding through FY2027, which investor profiles genuinely benefit from it, and which are better served putting their capital elsewhere.
What ANZ’s dividend history actually tells you about FY2027
ANZ has maintained an unbroken dividend record across more than a decade, with 2020 standing as the only year that record was disrupted by the economic effects of the pandemic. That track record is real, and it matters. Because borrowers treat loan repayments as a priority obligation, the regular monthly inflows they generate give bank earnings, and therefore bank dividends, a resilience that few other sectors can claim.
APRA’s capital adequacy prudential standard sets the capital conservation buffer requirements that authorised deposit-taking institutions must maintain, which directly constrains how much of their earnings Australian banks can distribute as dividends in any given period.
But continuity is not growth. The trajectory over the past ten years tells a different story:
- 2015 full-year dividend: $1.78 per share
- 2023 full-year dividend: $1.75 per share
- 2024 full-year dividend: $1.66 per share, a reduction of approximately 5% from the prior year
- FY2026 and FY2027 projections: $1.66 per share (flat, per analyst consensus)
The semi-annual payment has held at $0.83 since mid-2024. That stability is worth acknowledging. It is also worth naming precisely: a nominal decline of roughly 7% over a decade, with analyst forecasts projecting no recovery through FY2027.
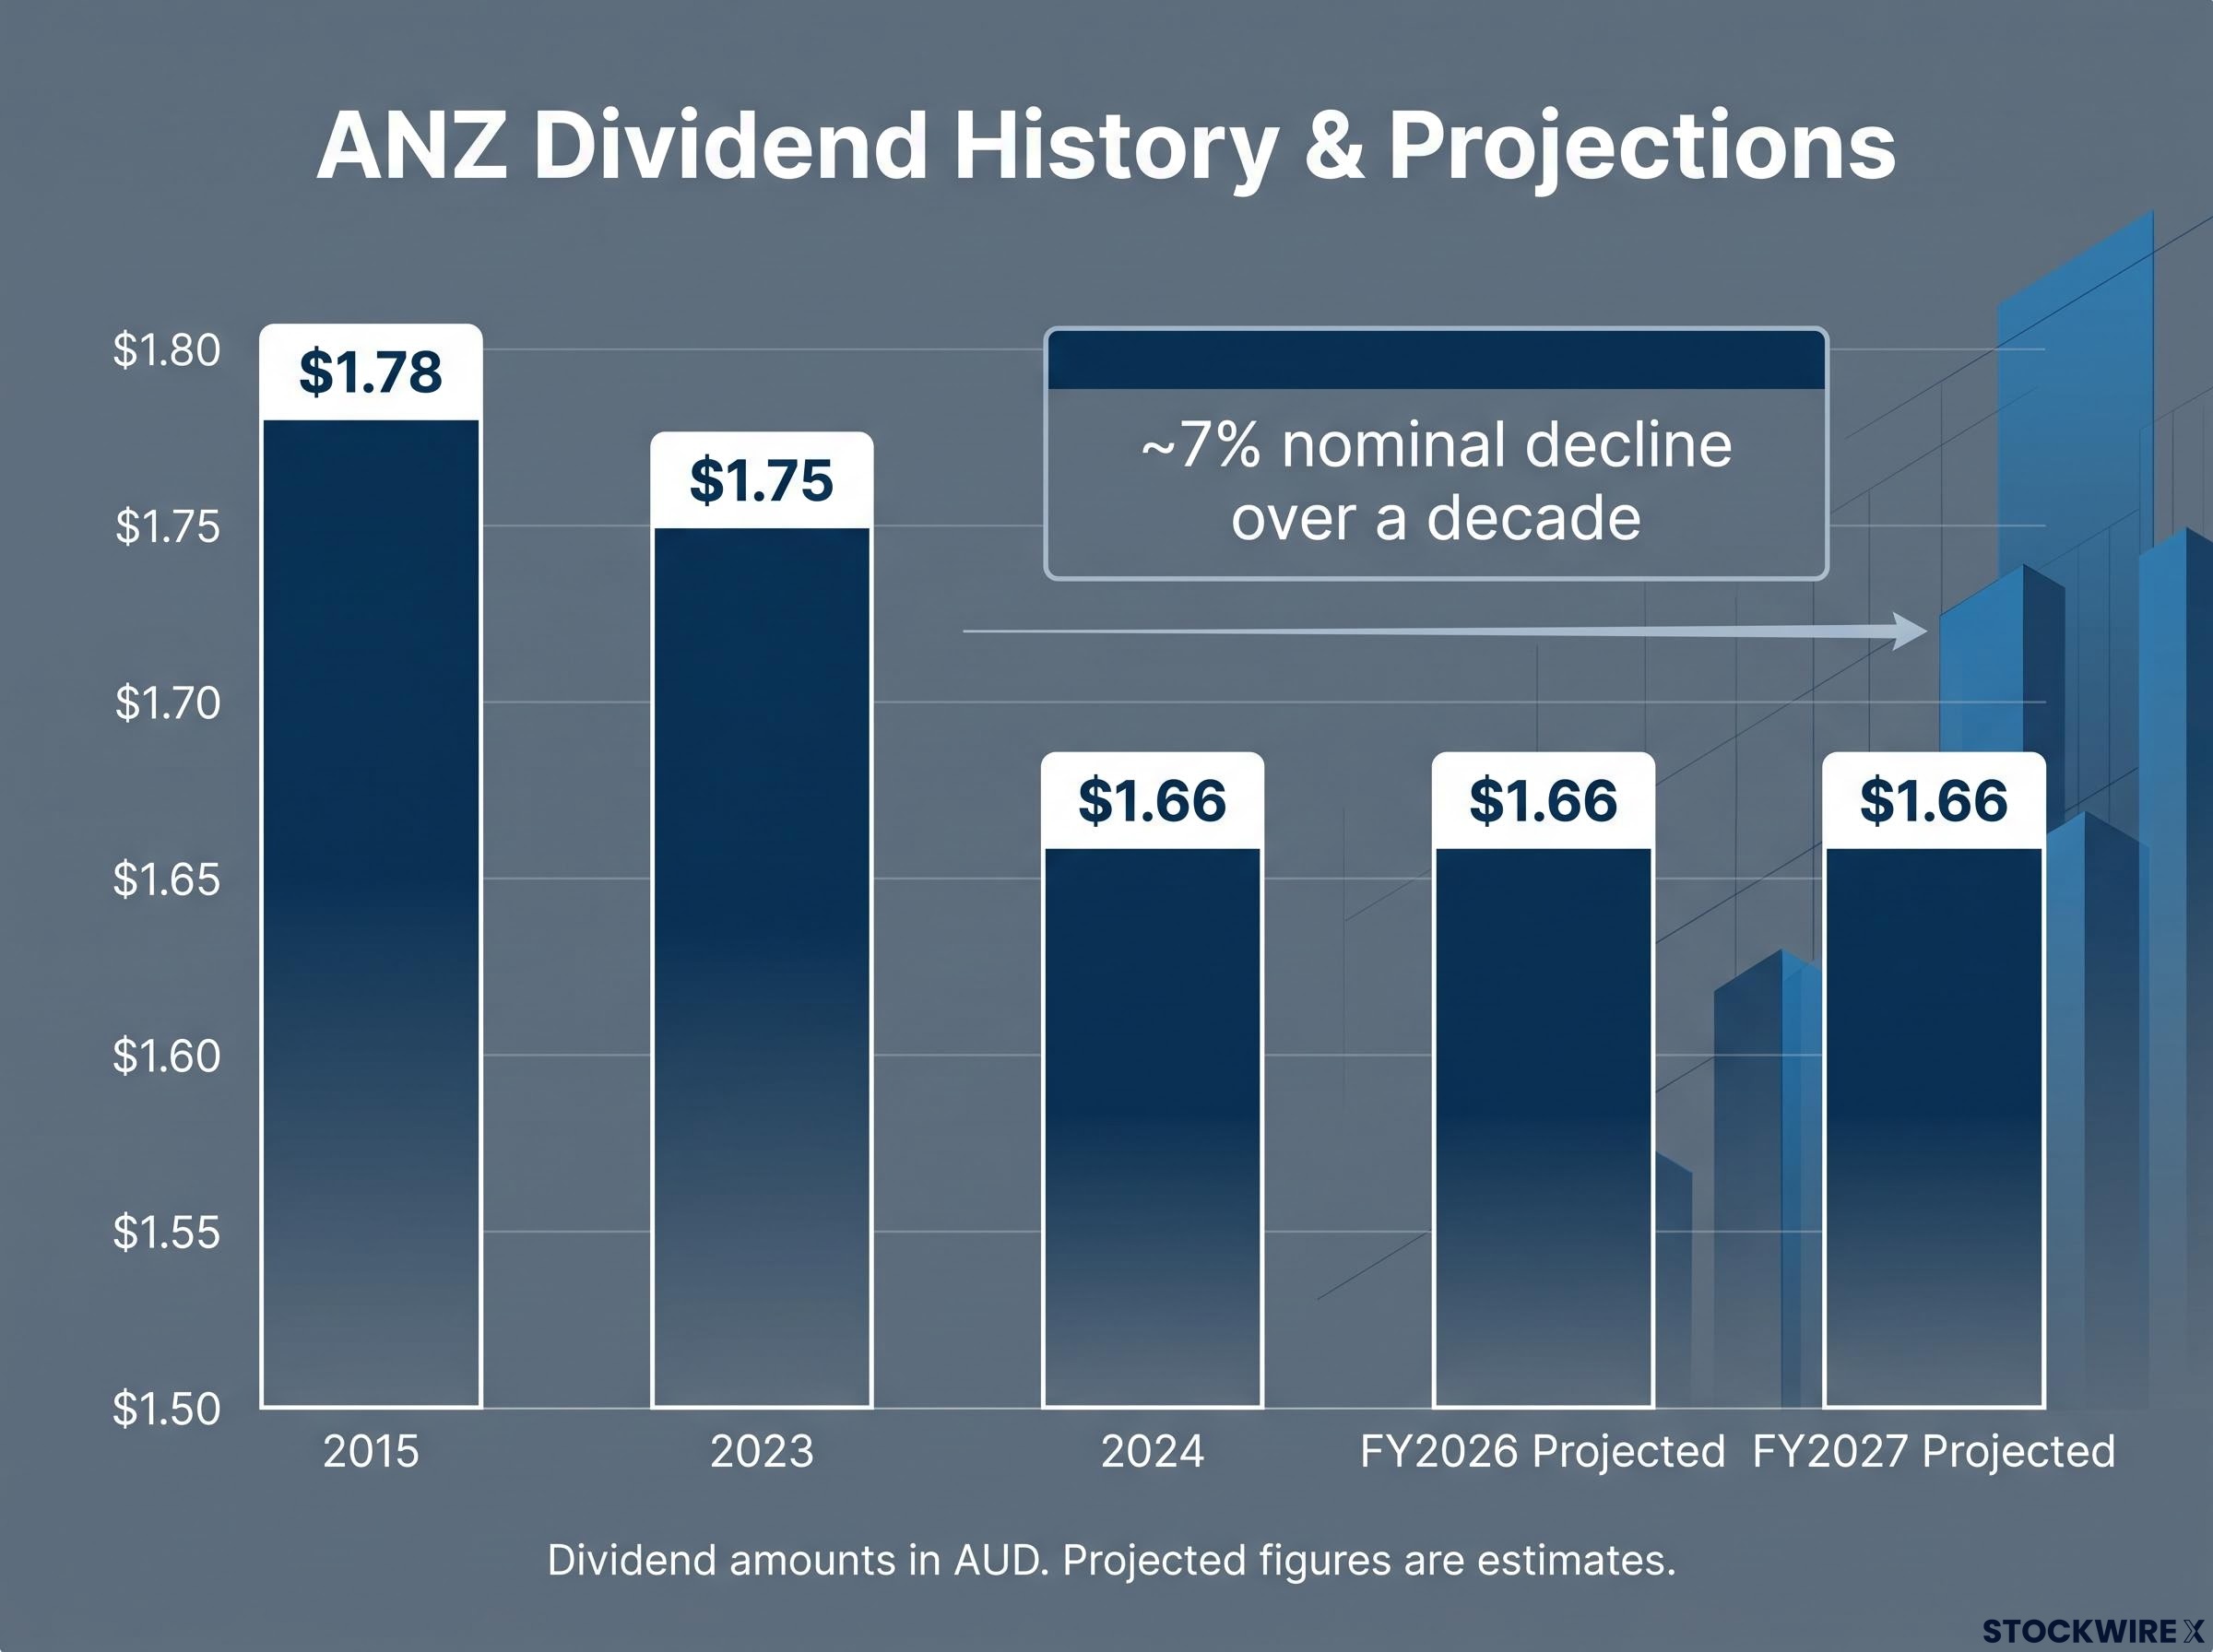
$1.66 projected for both FY2026 and FY2027. The forward estimate is flat.
This is a yield-maintenance story, not a compounding income story. If you are pricing in dividend growth from ANZ, you are working from the wrong assumption.
ASX bank dividend growth is running below the current inflation rate on Morningstar projections through FY28, which means ANZ’s flat nominal payout is not an isolated story but part of a sector-wide pattern of real income erosion that affects every big-four holding in a yield-focused portfolio.
When big ASX news breaks, our subscribers know first
How franking credits change the yield maths (and who actually benefits)
The headline 5.7% gross yield assumes you can use franking credits. Not every investor can.
ANZ pays partially franked dividends. Franking levels in recent periods:
- 2026 interim dividend: franked at 75%
- 2025 interim and final dividends: franked at 70%
Those levels have stabilised in a 70-75% band. The standard formula for calculating the credit is: franking credit equals F multiplied by (Tc divided by (1 minus Tc)) multiplied by the cash dividend, where F is the franking percentage and Tc is the corporate tax rate of 30%.
Those franking credit calculations follow a fixed formula tied to the 30% corporate tax rate, and the grossed-up value they generate differs materially depending on whether the investor is an individual resident, an SMSF in accumulation phase, or an SMSF in pension phase receiving the credit as a direct ATO cash refund.
In practice, at 70% franking the credits add approximately 30% on top of the cash dividend. At 75%, approximately 32%. Applied to a cash yield of 4.4-4.7%, that produces a grossed-up yield in the range of 5.7-6.2% for investors who can fully utilise the credits.
A position of $10,000 (equivalent to 268 shares) would generate roughly $444.88 in cash dividends, with the associated franking credits adding a further $135-$145 on top of that cash income.
If you cannot use those credits, the 5.7% number disappears. You are left with 4.4-4.7% cash yield carrying full equity risk.
Who captures the full 5.7% and who does not
| Investor Type | Effective Yield |
|---|---|
| Australian resident, low-to-moderate tax bracket | ~5.7-6.2% (full franking credit offset) |
| SMSF in pension phase | ~5.7-6.2% (franking credits refunded as cash) |
| Non-resident or franking-inefficient investor | ~4.4-4.7% (cash yield only, no credit uplift) |
Self-managed super funds (SMSFs) in pension phase, where the fund is paying retirement income to members and pays no tax on earnings, capture the full uplift because they receive franking credits as direct cash refunds from the Australian Taxation Office. Australian residents in lower tax brackets offset the credits against their tax liability. Non-residents and investors in structures where credits provide no benefit are looking at a very different proposition.
Modelling the $10,000 investment: income versus capital risk
The yield number only tells half the story. Here is what happens when you layer in the capital risk that analyst consensus is pricing in.
Total return is the only metric that captures both the income received and the capital movement that erodes or amplifies it, and the ANZ scenario illustrates precisely why a headline yield that ignores price direction can produce a deeply misleading picture of the investment’s actual performance.
Assumptions: $10,000 invested at approximately $37.29 per share gives you 268 shares. The projected annual dividend is $1.66 per share. Franking sits in the 70-75% band. The analyst consensus price target of $35.44 implies a roughly 5% decline over twelve months.
| Investor Type | Cash Dividends | Franking Credits | Capital Impact | Net 12-Month Return |
|---|---|---|---|---|
| Fully franking-eligible | +$445 | +$135-$145 | -$500 | ~+$80-$90 (+0.8-0.9%) |
| No franking access | +$445 | Nil | -$500 | ~-$55 (-0.6%) |
The numbers speak plainly. A $500 capital loss on a $10,000 position consumes the vast majority of the dividend income, even for tax-advantaged investors.
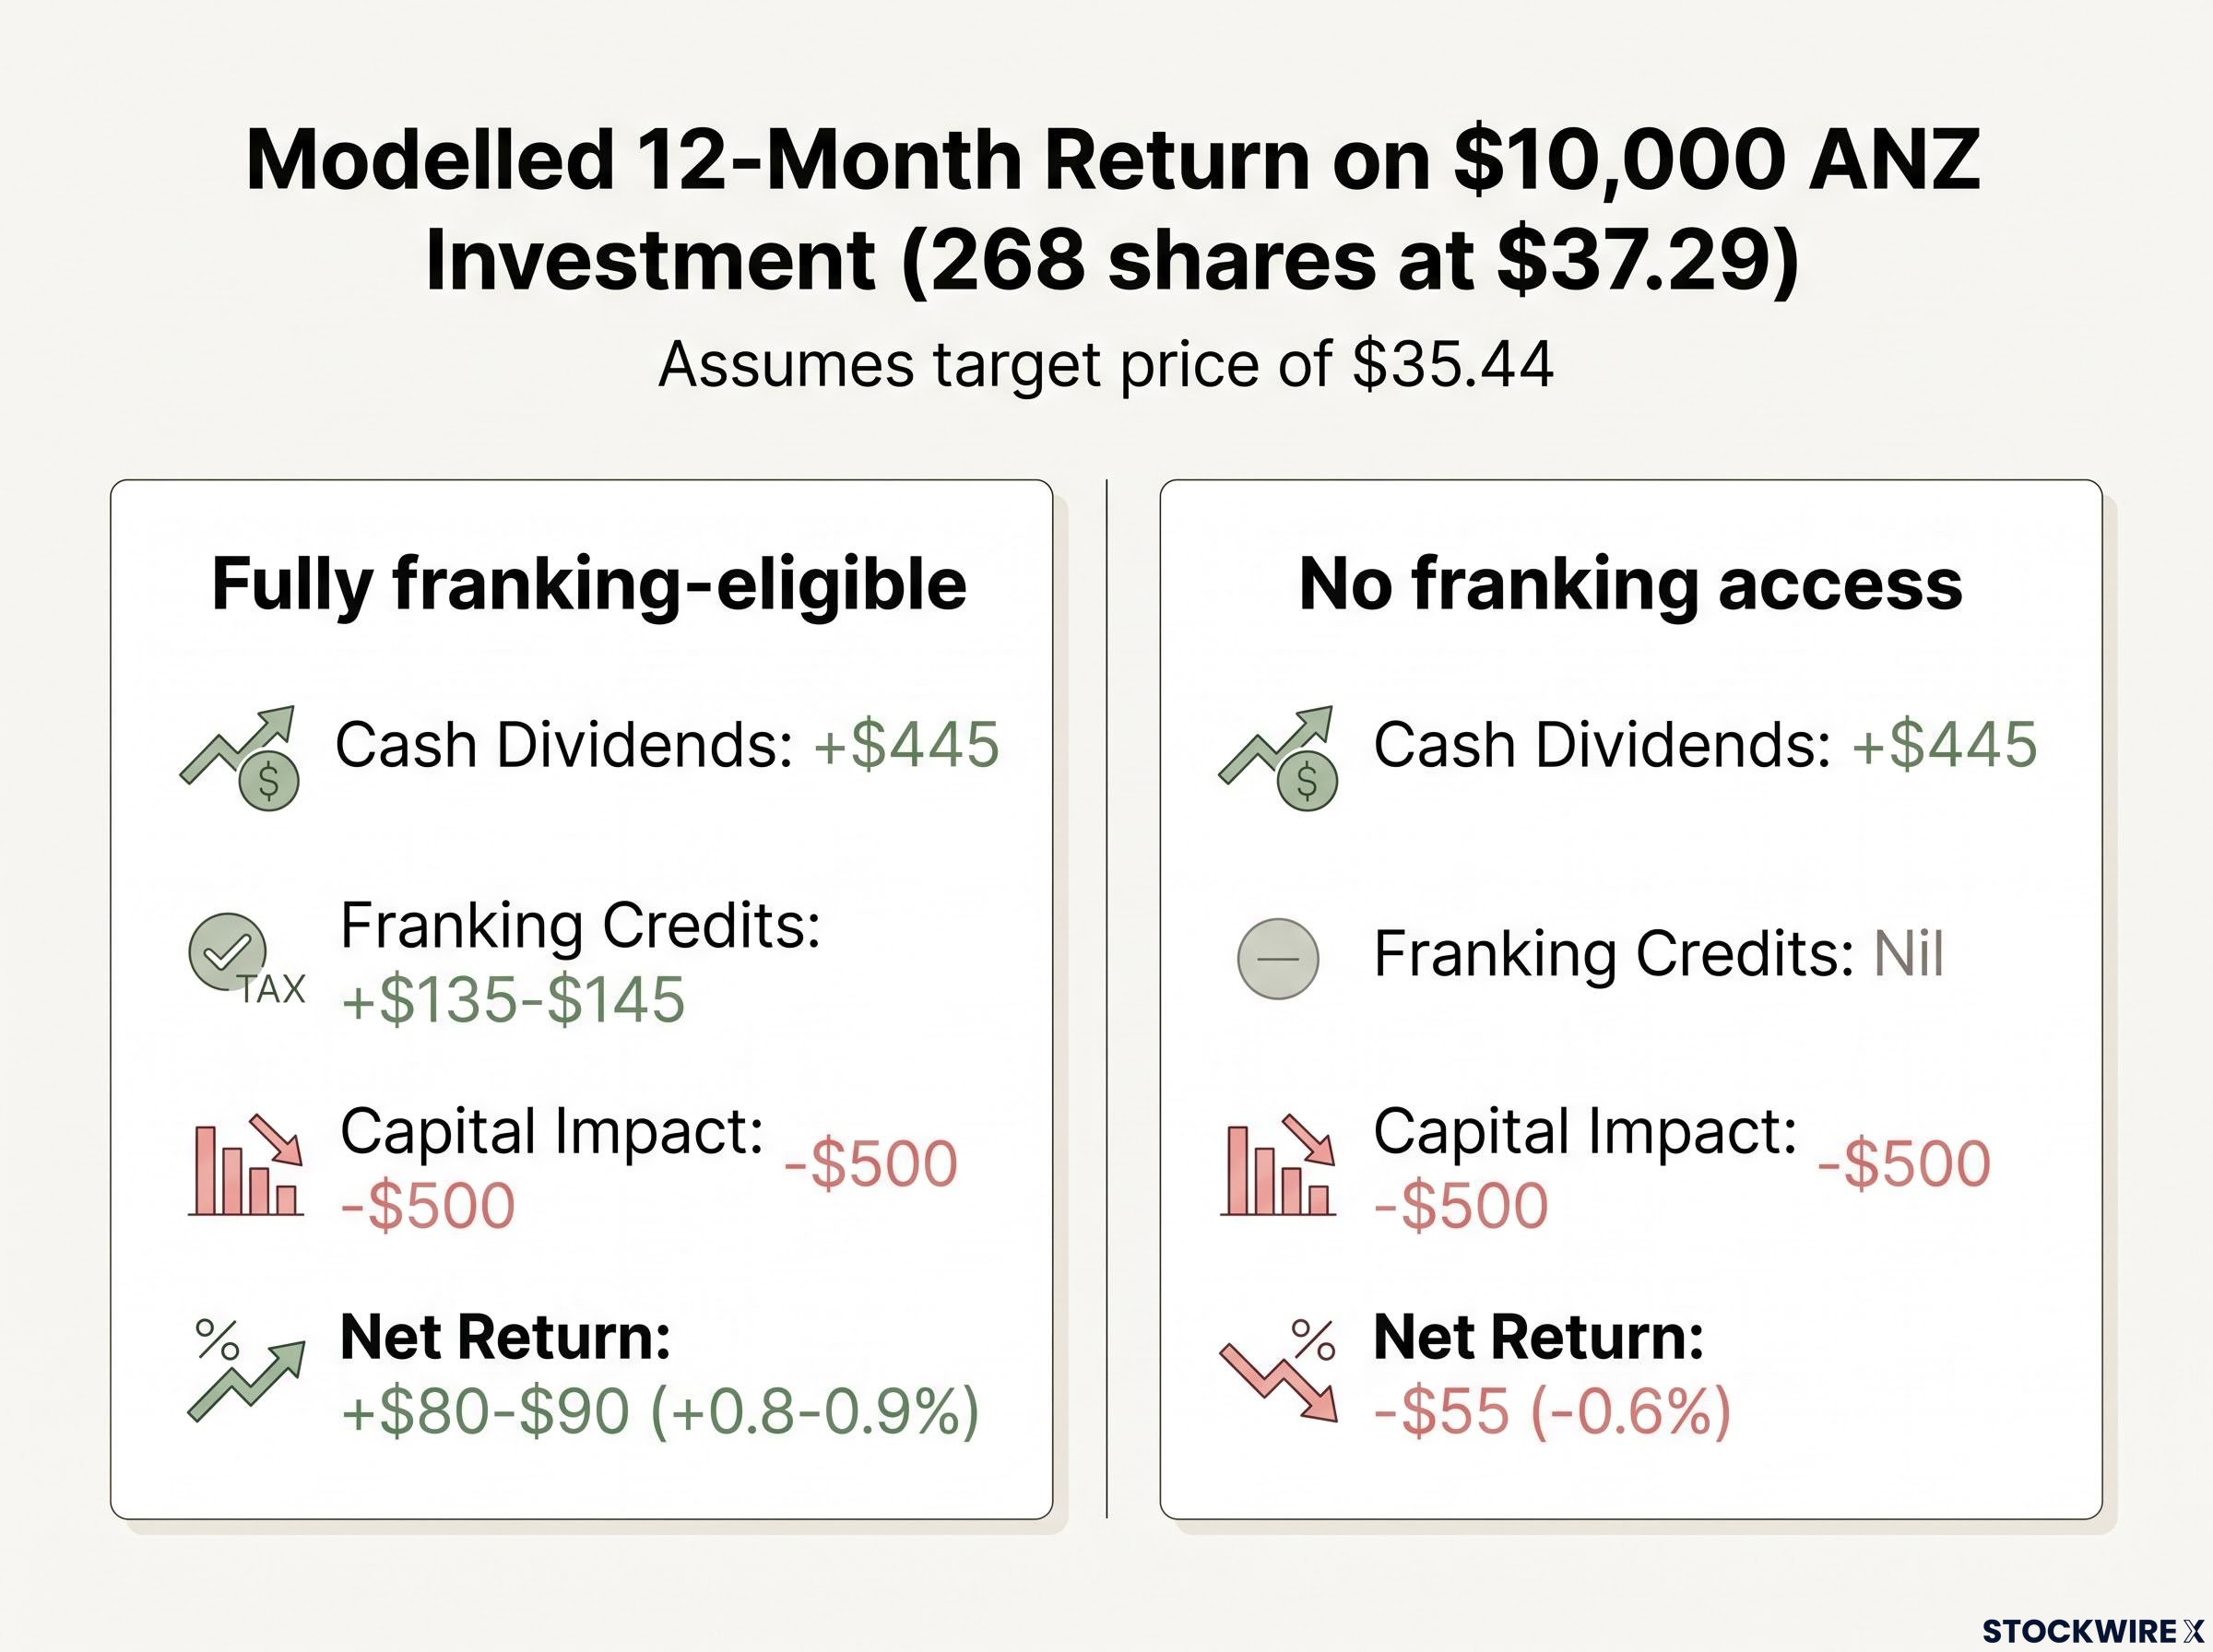
Under the analyst consensus price target, the 5.7% headline franked yield compresses to approximately 0.8-0.9% total return for fully franking-eligible investors, and turns negative for those without franking access.
That is the number that matters for a twelve-month investment decision. If you are comparing ANZ‘s income against a term deposit offering 4-5% with no capital risk, the total-return picture changes the calculus entirely.
This article is for informational purposes only and should not be considered financial advice. Investors should conduct their own research and consult with financial professionals before making investment decisions.
What analyst consensus is actually saying about ANZ right now
Analyst ratings are not gospel, but the distribution and the price target together form a useful calibration point for income investors weighing entry timing.
Drawing on CMC Invest data for the three-month window to early August 2026, the six analyst ratings on ANZ broke down as follows:
- Buy: 2
- Hold: 4
- Sell: 0
- Average price target: $35.44
- Current share price: approximately $37.29
- Implied 12-month move: approximately -5%
No analyst issued a sell rating, which matters. But a four-to-two hold-to-buy split, paired with an average price target sitting below the current share price, is not a neutral signal.
What this tells you is that professional consensus is not endorsing the current price as an entry point for investors seeking positive total returns. Two analysts see enough value to warrant a buy; four see a stock priced at or above fair value. The implied 5% decline is not a dramatic call, but when set against a 4.4% cash yield, it compresses the income advantage to nearly nothing.
Analyst price targets and ratings are forward-looking estimates subject to change based on market developments and company performance.
Which investor profiles ANZ suits in FY2027 and which it does not
The answer to whether ANZ‘s dividend is worth it depends less on the stock and more on the person holding it. Here is where the lines fall.
Investor profiles where ANZ’s partially franked yield works
- Australian tax residents in low-to-moderate brackets who can fully offset franking credits against their tax liability, turning the 5.7% gross yield into real cash savings.
- SMSFs in pension phase receiving franking credit refunds as direct cash from the ATO, which materially improves the income return on a partially franked dividend.
- Long-term income holders not relying on capital appreciation or dividend growth, who view ANZ as one component of a diversified income portfolio and can absorb moderate capital volatility.
Investor profiles better served by alternatives
- Investors seeking dividend growth: the decade-long trend and forward consensus both show none. ANZ‘s payout has drifted lower in nominal terms since 2015.
- Total-return investors on a 12-month view: analyst consensus does not support the current price as an entry point. The modelled outcome under the $35.44 target is approximately flat at best.
- Non-residents and franking-inefficient investors: a 4.4-4.7% cash yield carrying full equity risk sits in the same range as term deposits offering similar rates with no capital downside. The risk-adjusted comparison is unfavourable.
ANZ‘s cash yield of approximately 4.45% sits above the broader ASX bank sector average, which industry estimates place at approximately 3.9% (directional context only; this comparison is approximate). That relative positioning is worth noting, but it does not resolve the total-return question for investors who also need capital preservation.
What the total-return picture means for income investors making a decision now
The core finding across this analysis is straightforward. ANZ‘s 5.7% grossed-up franked yield is a real number for the right investor, but under analyst consensus assumptions it compresses to roughly 0-1% total return on a twelve-month view. For investors without franking access, the modelled outcome is a small negative return of approximately -0.6%.
That does not make ANZ a bad stock. It makes it a conditional one. For investors with the right tax profile and no capital growth expectations, it remains a defensible part of a diversified income portfolio. The $0.83 semi-annual payment is reliable. The franking credit band of 70-75% is stable. The $1.66 annual payout is projected flat through FY2027.
Positioning ANZ as one component of a broader ASX dividend income portfolio, rather than a stand-alone yield play, is the approach that best suits the investor profiles identified above; spreading exposure across sectors with different payout ratio profiles and earnings coverage reduces the concentration risk that comes with a bank-heavy income allocation.
But it is not a stand-alone income solution, and it is not a compelling twelve-month total-return trade at the current price.
The decision comes down to two personal variables:
- Your ability to use franking credits. This is the single largest determinant of whether the gross yield is real or illusory for your specific situation.
- Your comfort with low single-digit total returns and modest capital downside risk. If the answer is yes on both, ANZ earns a place in your income allocation. If the answer is no on either, your capital is likely better deployed elsewhere.
Past performance does not guarantee future results. Financial projections are subject to market conditions and various risk factors.