Goodman Group’s work-in-progress balance hit $14.5 billion on 31 March 2026, with 73% of that capital committed to data centres. By June 2026, management is targeting $18 billion. On the day that update landed, the stock fell roughly 3%.
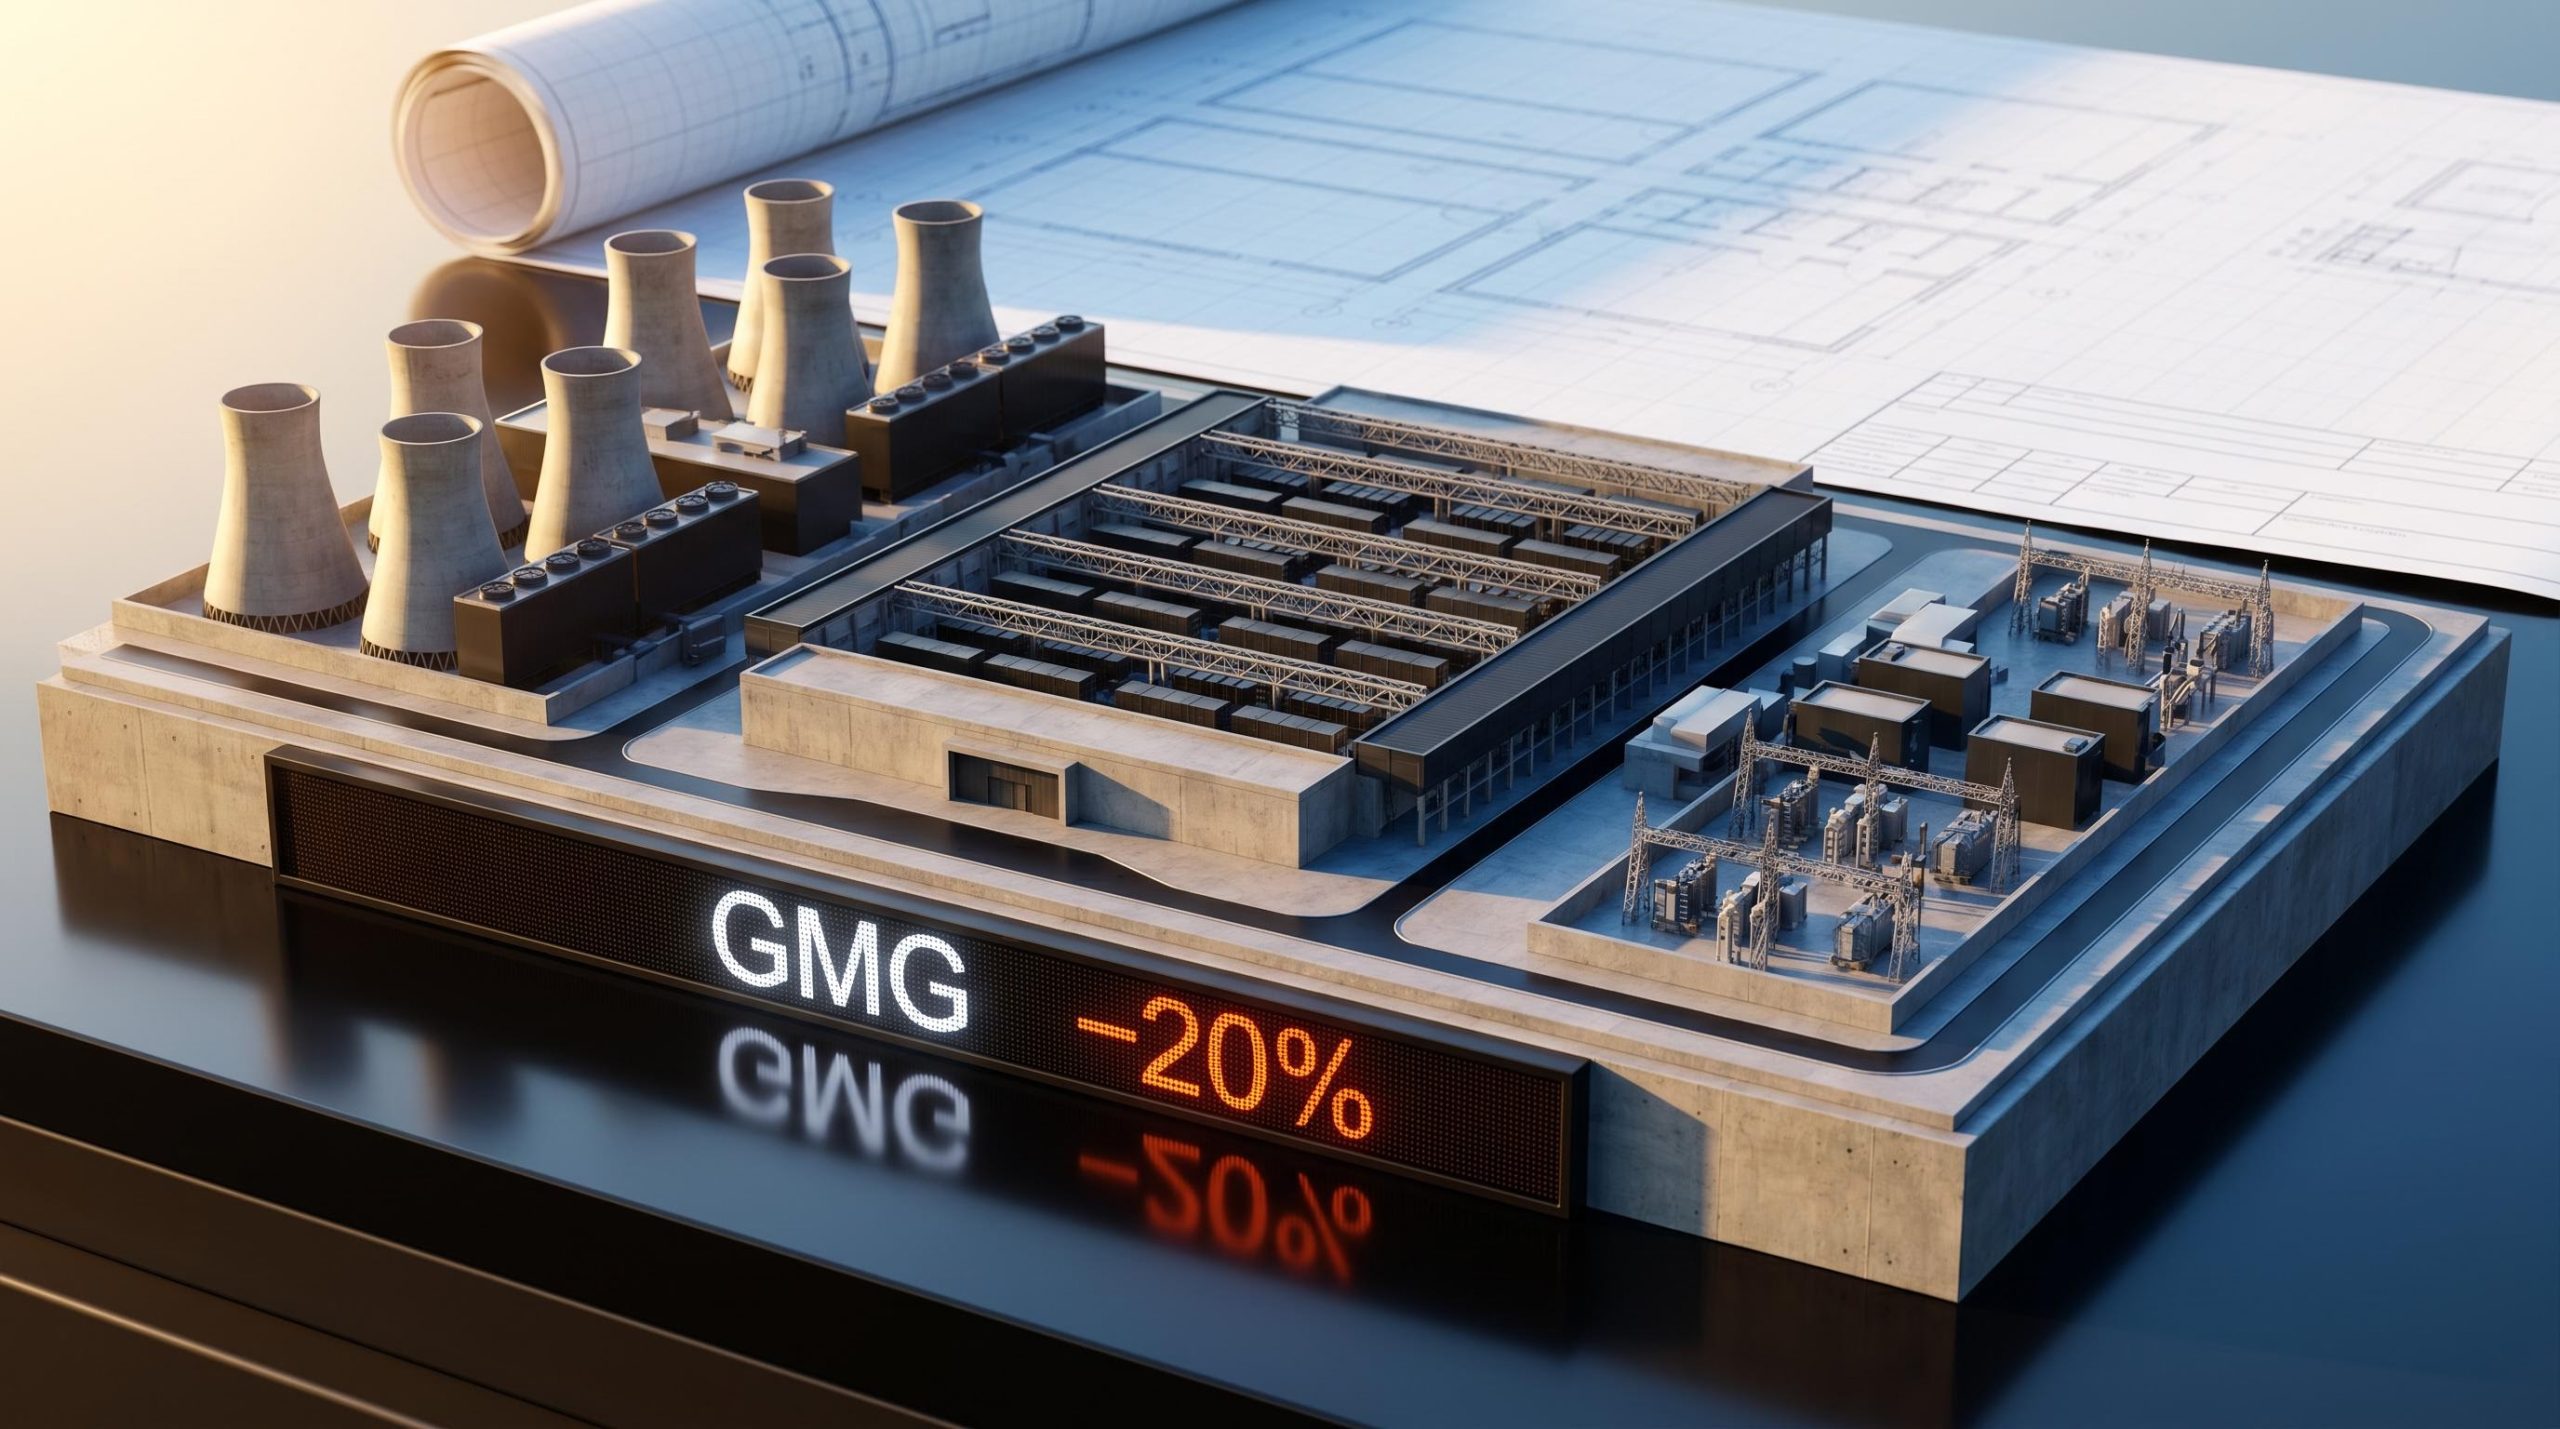
The reaction sits within a broader pullback. GMG has shed approximately 20% from its August 2025 peak of $37.31, trading around $30.05 to $30.37 in late May 2026. For investors assessing one of the most data-centre-heavy development pipelines on the ASX, the question is direct: is this a valuation de-rating of a structurally strong business, or is the market correctly pricing execution risk into a company running an unusually large and capital-intensive growth programme?
What follows unpacks the pipeline metrics, powerbank position, yield on cost, and pre-sold construction weighting to examine where Goodman’s value is being created, and what the current share price implies about the risk-reward at this entry point.
The $14.5 billion WIP balance is a development machine, not a property portfolio
A $14.5 billion work-in-progress balance, growing to a targeted $18 billion by 30 June 2026, is not passive property ownership. It is active capital deployment at industrial scale, and the distinction matters for how investors should value this business.
The operational throughput metric that gives WIP its meaning is the annualised production rate: approximately $6 billion per year flowing through Goodman’s development pipeline. That figure captures the velocity at which capital is being converted into completed assets, a number that belongs in the vocabulary of manufacturing capacity rather than rental income.
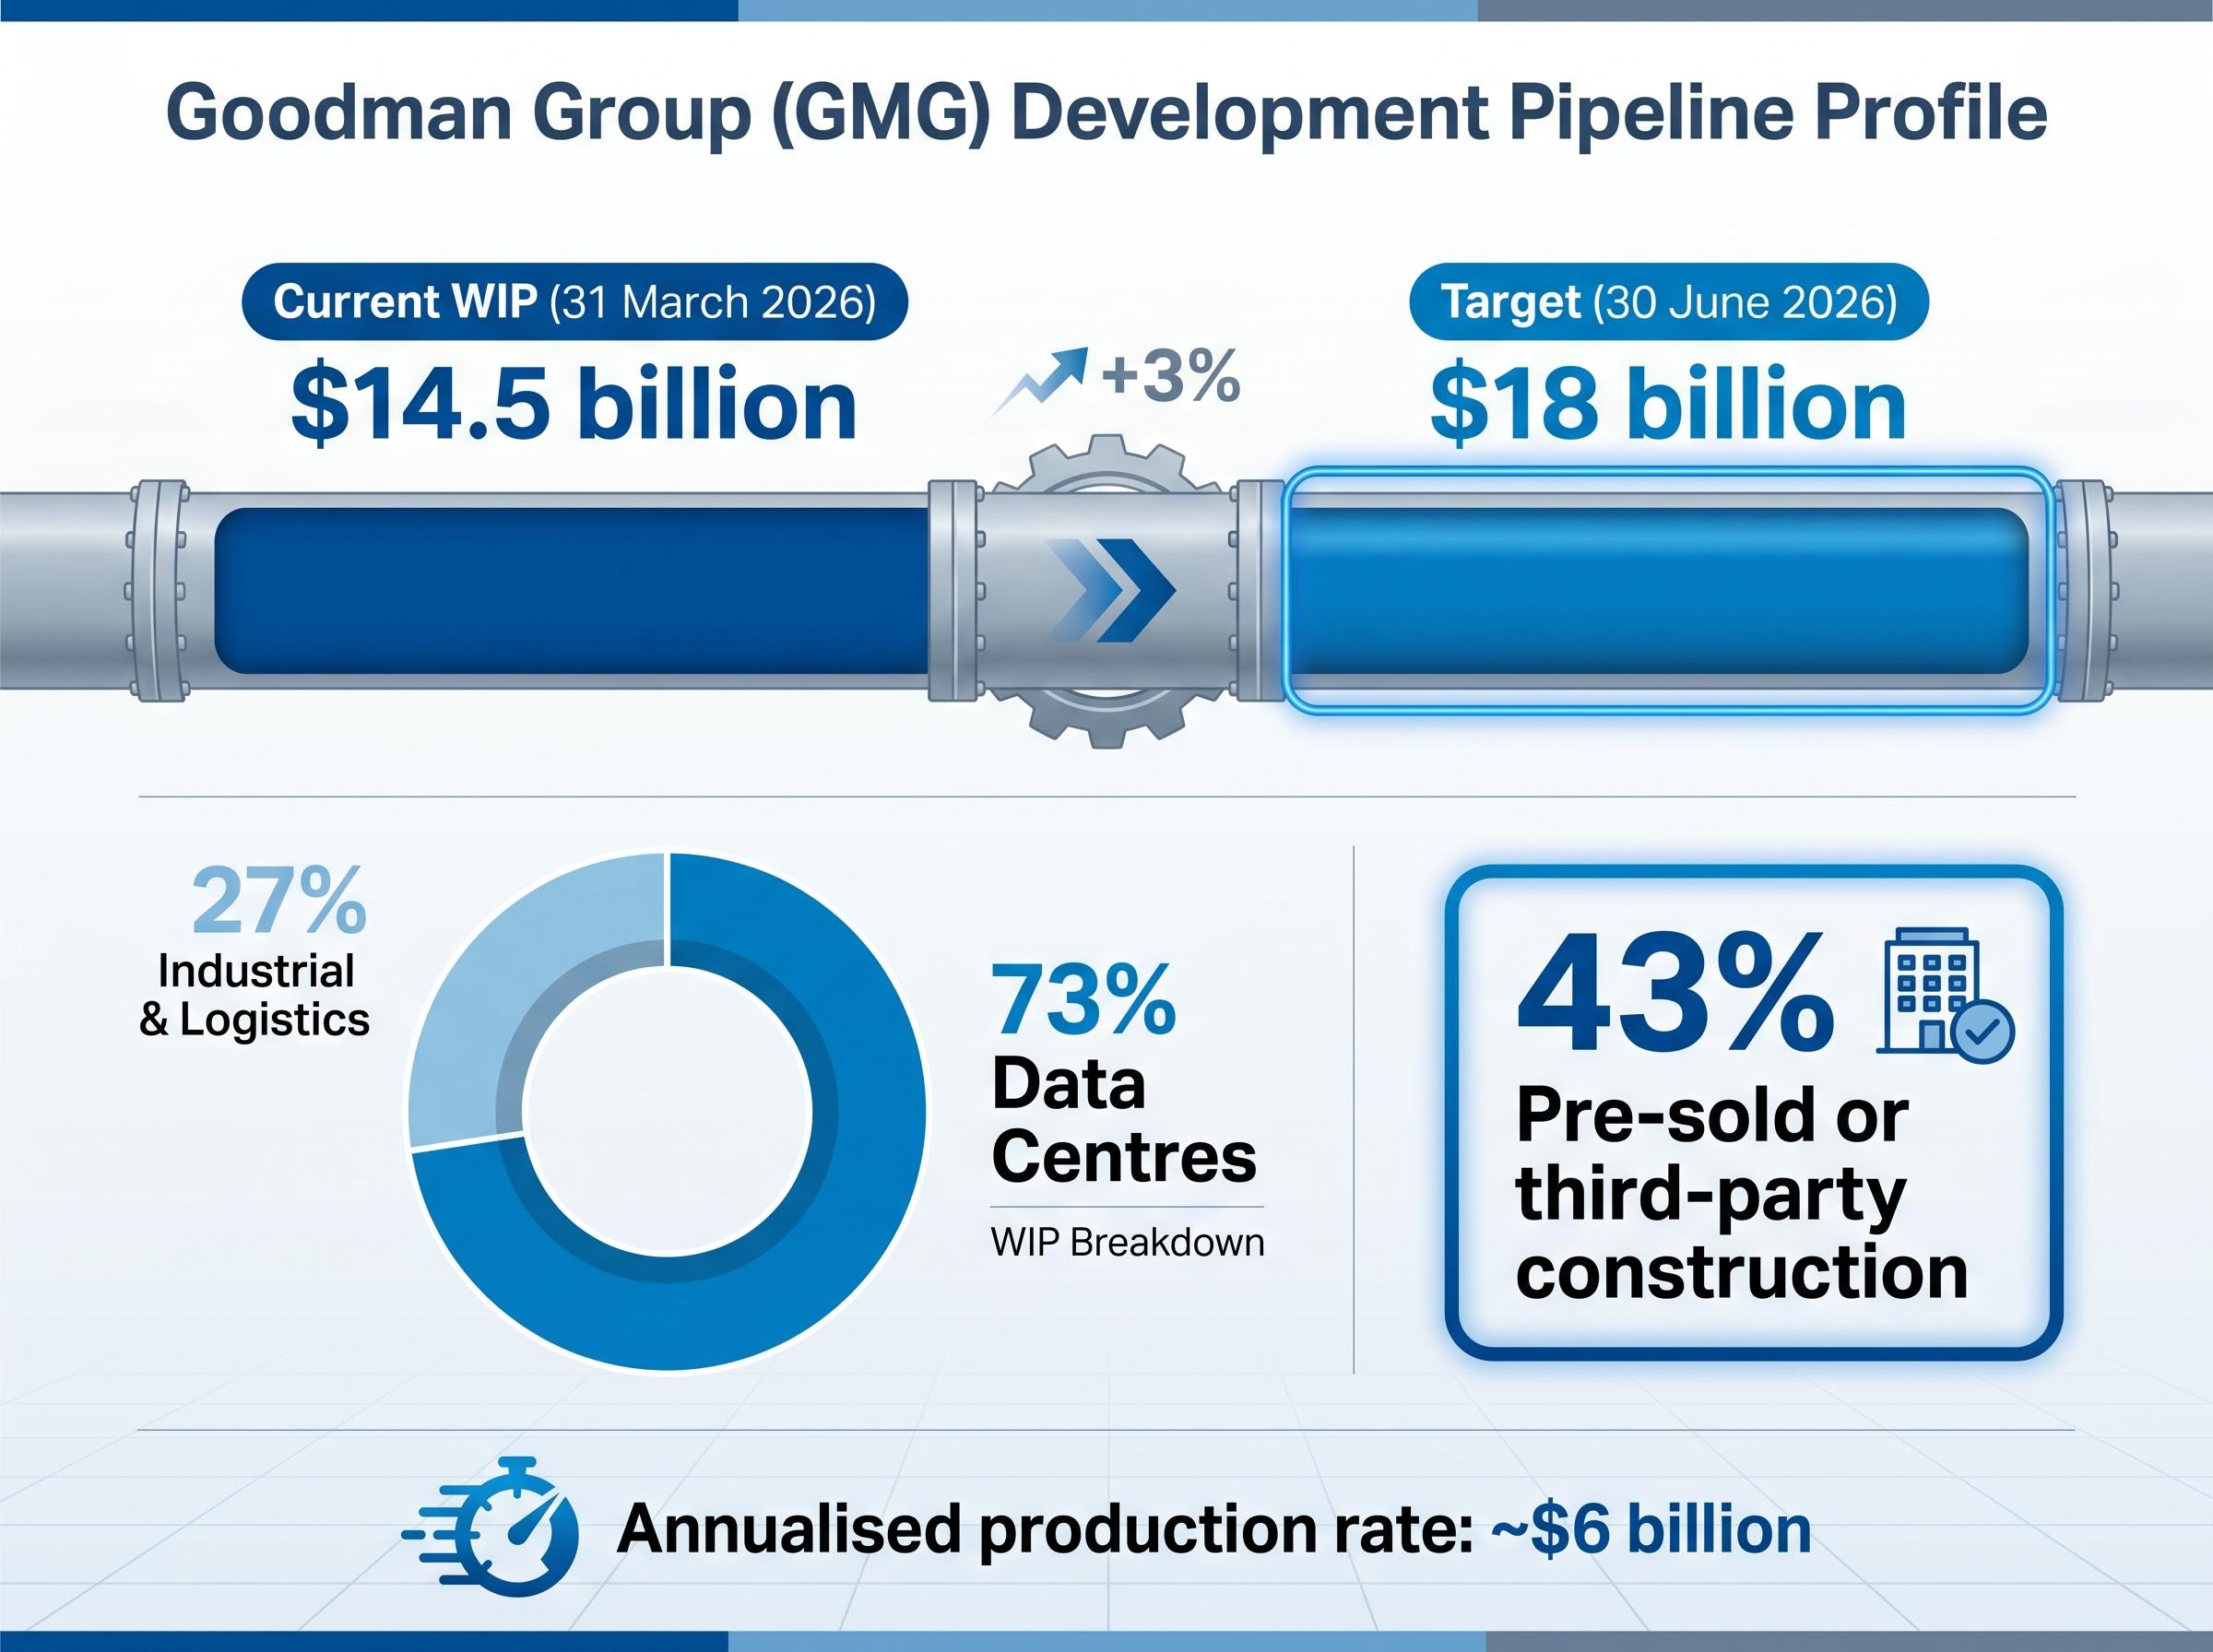
- WIP balance: $14.5 billion as at 31 March 2026
- WIP target: approximately $18 billion by 30 June 2026
- Annualised production rate: approximately $6 billion
- Pre-sold or third-party construction: 43% of WIP
Pre-sold weighting de-risks the headline number
The 43% figure is where the risk profile shifts. Nearly half of the WIP balance carries contracted counterparty demand before a building is completed, meaning Goodman is not building speculatively into an uncertain leasing environment at this scale.
This pre-sold position is enabled by the company’s integrated development capability, spanning land acquisition, planning, power procurement, design, construction, and leasing. That vertical integration allows Goodman to offer tenants a finished product on compressed timelines, which in turn pulls forward contractual commitments. Investors who price GMG as a stabilised real estate trust will systematically misprice it; the WIP balance, and its contracted weighting, is the correct unit of analysis for understanding forward earnings.
GMG’s stapled security structure and off-balance-sheet co-investment vehicles mean that standard ratios such as return on equity and debt-to-equity systematically misrepresent the company’s financial position, a dynamic that explains why investors relying on conventional screen metrics will consistently arrive at distorted conclusions about both leverage and profitability.
When big ASX news breaks, our subscribers know first
Data centres at 73% of WIP signals a deliberate portfolio transformation
73% of Goodman’s total WIP as at 31 March 2026 is allocated to data-centre development.
That weighting is not an opportunistic pivot. It reflects a multi-year repositioning built on management’s stated thesis that three structural forces are creating durable infrastructure needs:
JLL’s 2026 global data centre market outlook projects a doubling of global capacity by 2030 driven by AI and cloud expansion, providing independent industry validation for the structural demand thesis underpinning Goodman’s deliberate 73% concentration of WIP in data-centre development.
- AI-driven compute demand requiring purpose-built facilities at scale
- Robotics and automation adoption across logistics and industrial supply chains
- Supply-chain restructuring driving demand for digitally integrated infrastructure in major urban centres
The remaining approximately 27% of WIP sits in industrial and logistics assets, a reminder that Goodman has not fully exited its original asset class. The total portfolio value of $87.1 billion provides the stabilised-asset anchor beneath the development story.
What distinguishes the data-centre weighting from a simple sector bet is the asset location. Goodman’s development activity concentrates in major global urban centres where land, power, and planning constraints make replication difficult. These are not commoditised facilities on cheap land; they are infrastructure assets whose value is partly a function of how hard they are to build.
For investors, the 73% figure is the clearest signal of management’s conviction about where the next decade of real estate returns will originate. The current share price either adequately reflects or undervalues that conviction.
Investors exploring the demand side of the equation will find our deep-dive into Australia’s record data centre contracts, which examines the 555MW CDC hyperscaler deal that pushed contracted capacity past 1GW, the DigiCo asset divestment that redeployed capital toward a Sydney build, and what both transactions reveal about where AI-driven hyperscaler demand is concentrating in the Australasian market.
Understanding yield on cost and why 8% matters in a high-rate environment
Yield on cost measures the stabilised net operating income a completed development is expected to generate, divided by the total cost to develop it. It answers a specific question: how much recurring income does each dollar of development capital produce?
| Metric | Goodman’s Position |
|---|---|
| Yield on cost (definition) | Stabilised net operating income ÷ total development cost |
| Forecast yield on cost for WIP | 8% (referenced as 8.1% in some disclosures) |
An 8% yield on cost for data-centre assets, in a market where stabilised capitalisation rates for comparable assets trade at or below that level, indicates that development margin is being created at the time of construction. The gap between the cost to build and the value of the completed asset is where Goodman’s development earnings originate, and the wider that gap, the more value is being embedded with each project delivered.
Supply-side constraints as a structural moat
That 8% figure does not exist in isolation. It persists because the number of developers capable of delivering data centres at scale is being compressed by supply-side constraints: grid-capacity limitations, water availability lead times, site complexity in major urban centres, and the sheer capital intensity of the asset class.
These barriers function as a structural moat. Grid access alone can require years of procurement in constrained markets, a timeline that Goodman’s 6.4 GW powerbank (covered in the following section) is specifically designed to compress. For investors evaluating whether GMG’s development earnings are sustainable, yield on cost is the metric that reveals whether the pipeline is generating value above replacement cost, the test of whether competitive advantage is real.
The physical bottlenecks in AI infrastructure extend beyond Goodman’s pipeline: AEMO’s Draft 2026 Integrated System Plan formally identifies data centres as a structural demand driver projecting nearly 10 TWh of additional electricity load in Australia by 2033-34, a figure that contextualises why grid-capacity constraints in major urban centres are compressing the number of developers capable of delivering at scale.
The 6.4 GW powerbank is the strategic asset the balance sheet cannot fully capture
Without secured power, data-centre development cannot proceed. The powerbank is the feedstock for future development, and Goodman’s position at 6.4 GW across 16 major cities globally represents a strategic option that is difficult to replicate through capital expenditure alone.
6.4 GW: Goodman’s total powerbank as at the Q3 FY26 operational update, May 2026.
The trajectory matters as much as the total. At the 1H26 results in February 2026, the powerbank stood at 6.0 GW. Three months later, it had grown to 6.4 GW, evidence that Goodman is actively expanding its power position rather than simply maintaining existing capacity.
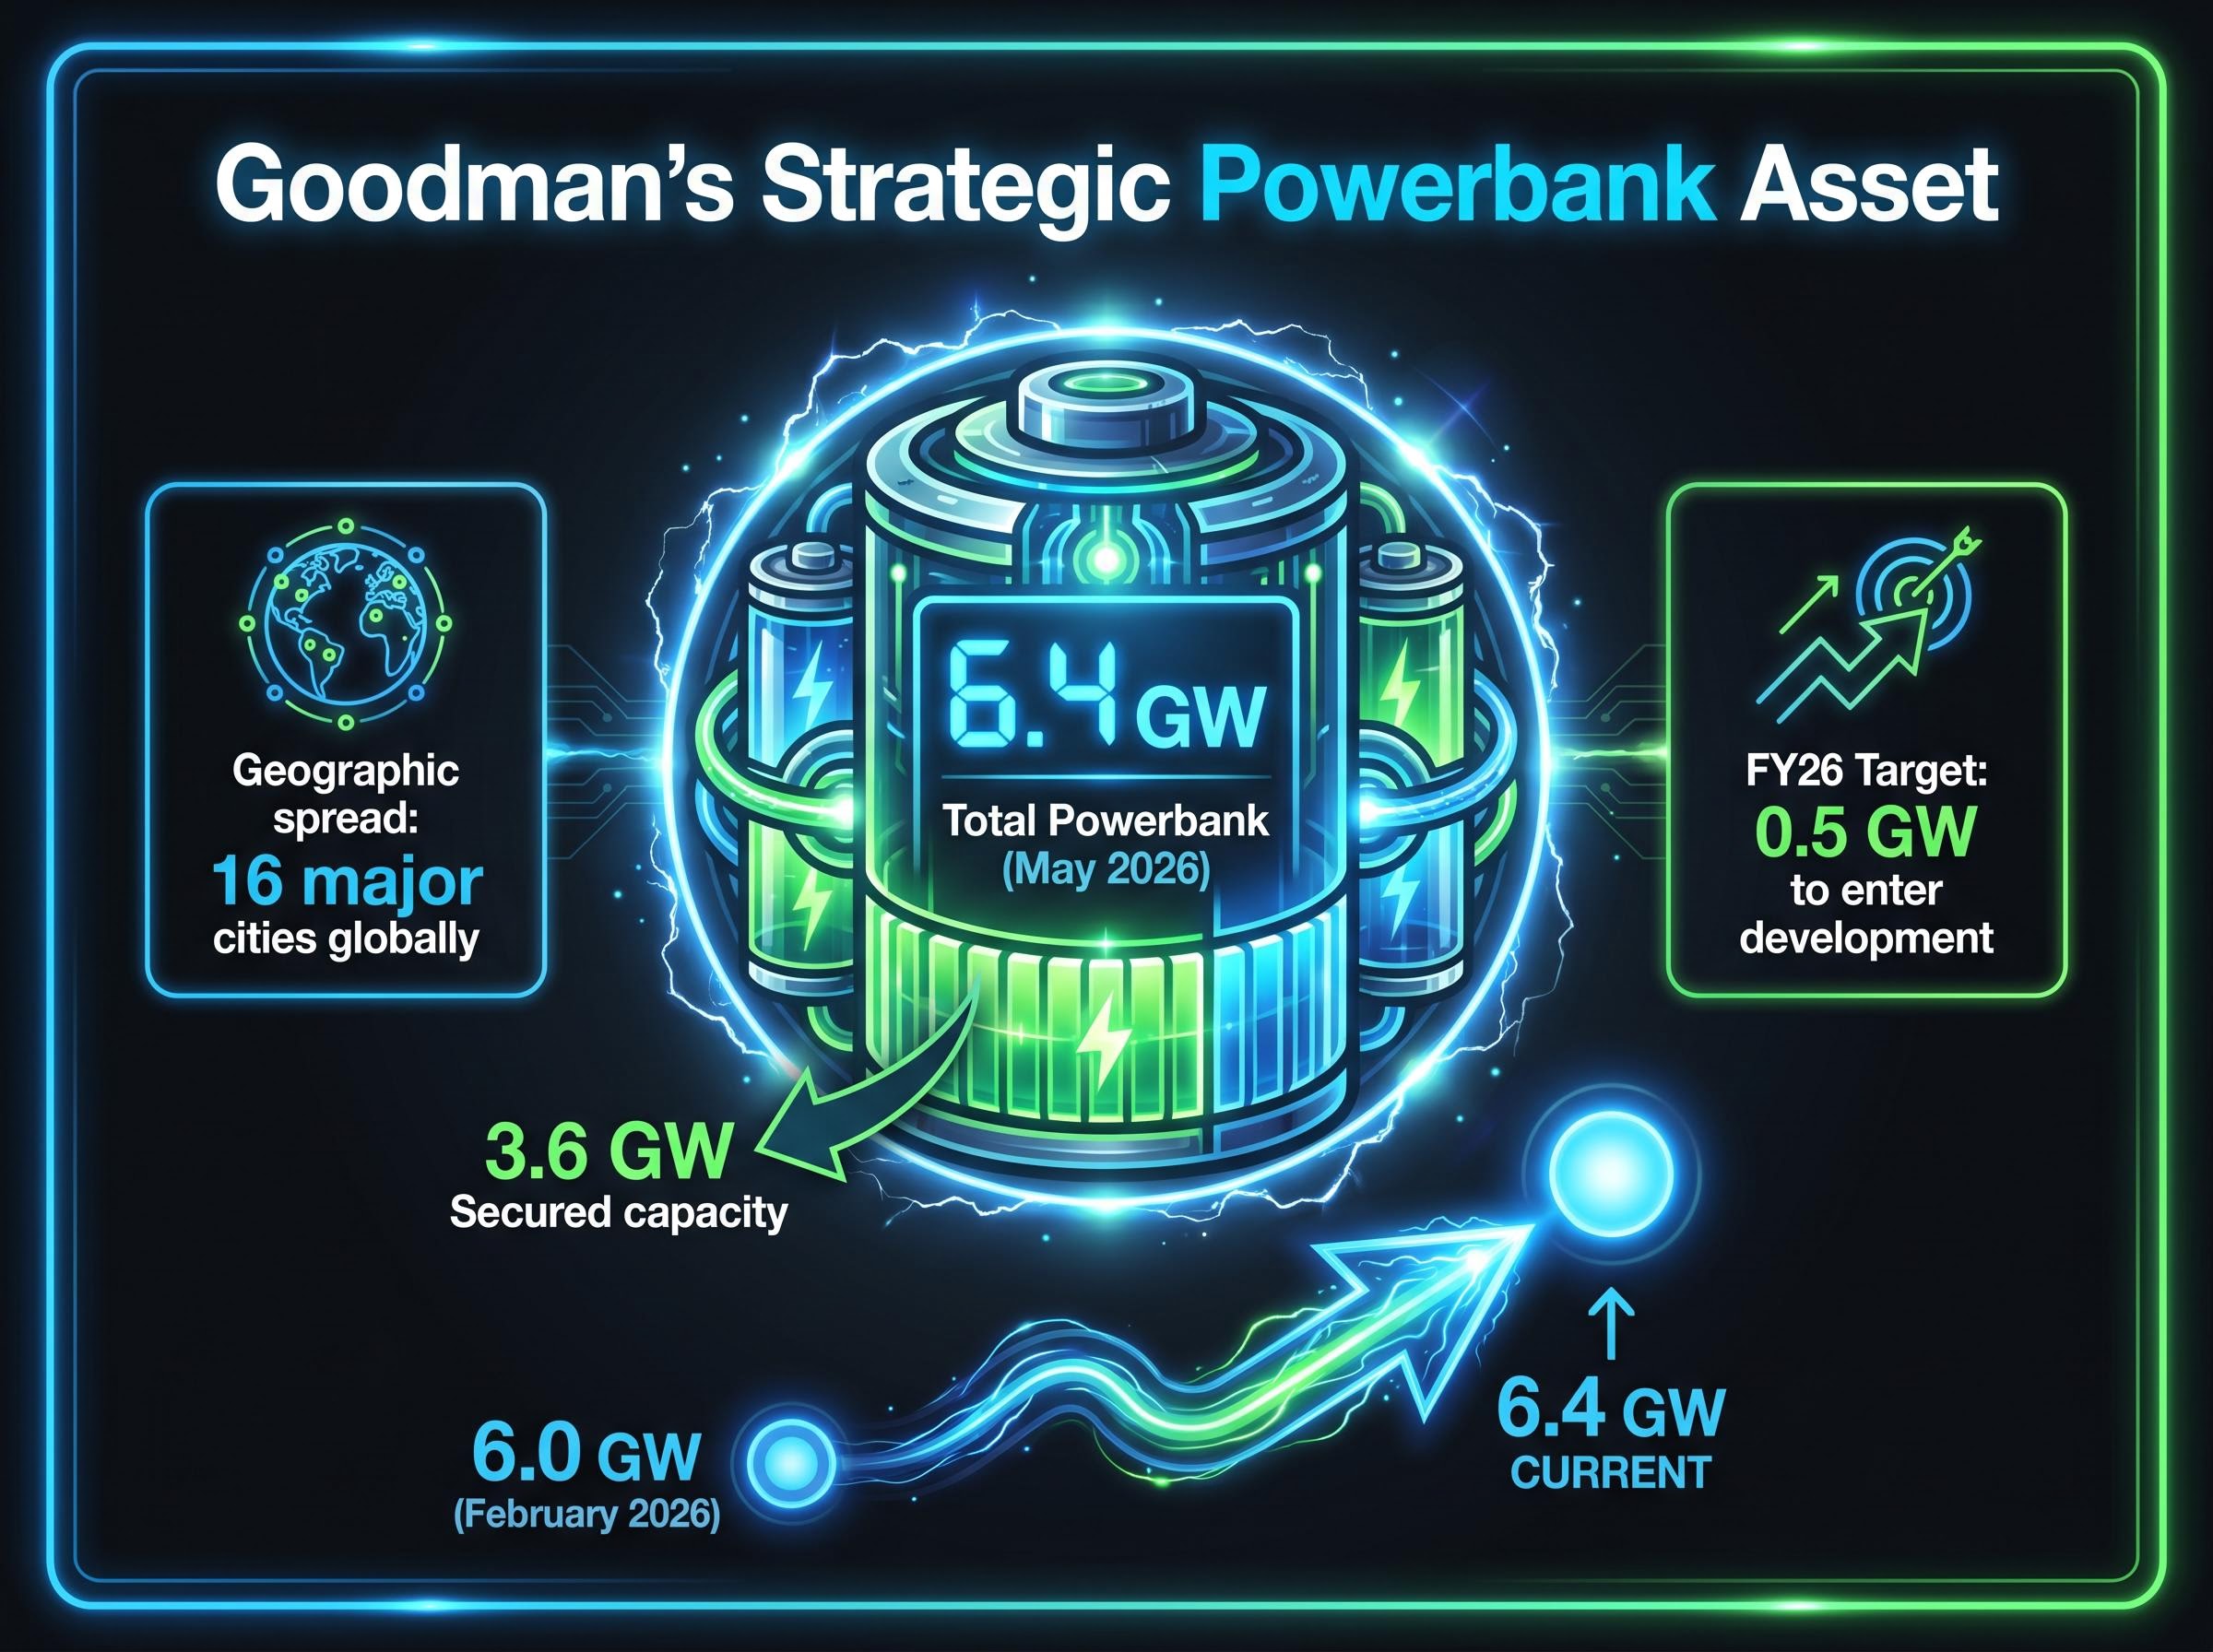
- Total powerbank: 6.4 GW (Q3 FY26, May 2026)
- Secured capacity: 3.6 GW
- Prior disclosure: 6.0 GW (1H26 results, February 2026)
- Geographic spread: 16 major cities globally
- FY26 target: 0.5 GW of data-centre projects to enter development by end FY26
The distinction between the 3.6 GW secured and the remainder in advanced procurement is relevant. Secured capacity is contracted and available; advanced procurement carries counterparty and regulatory risk. Investors who focus only on current WIP miss the optionality value embedded in the secured portion of the powerbank, which represents the most difficult-to-replicate asset in Goodman’s business and a leading indicator of future WIP growth.
Portfolio fundamentals provide the stabilised-asset floor beneath the development story
The development engine operates on top of a stabilised portfolio that continues to deliver consistent operating metrics, though the headline numbers require one adjustment for a clean reading.
| Metric | Reported | Excluding Greater China |
|---|---|---|
| Occupancy | 95.7% | 97.0% |
| Like-for-like NPI growth | 4.1% | 6.1% |
Greater China is dragging headline occupancy and rental growth figures below the levels achieved across the rest of the global portfolio. The 97.0% occupancy and 6.1% like-for-like net property income growth that emerge when Greater China is excluded give investors a cleaner picture of the portfolio’s underlying health.
- Weighted average lease expiry (WALE): 4.9 years, limiting near-term re-leasing risk
- FY26 operating earnings growth guidance: at least 9%, reaffirmed at the Q3 update
A development company with weak underlying assets is leveraged purely to construction execution. Goodman’s stabilised portfolio, valued at $87.1 billion, confirms the business has a durable income base that anchors the 9% earnings growth guidance in something more than pipeline optimism.
What the share price pullback implies for investors assessing GMG today
The pipeline metrics are strong. The powerbank is growing. The stabilised portfolio is healthy outside Greater China. And the stock is down approximately 20% from its August 2025 peak.
GMG traded at approximately $30.05 to $30.37 in late May 2026, placing the market capitalisation between approximately $61.4 billion and $63.1 billion. The 52-week range of $24.56 to $37.31 captures the volatility of investor sentiment around the growth thesis over the past year.
Trailing P/E ratio: approximately 36, reflecting the premium the market continues to assign to Goodman’s development-led earnings growth profile.
Sub-sector selection within real estate has produced return dispersions exceeding 34 percentage points in a single calendar year, with data centre and industrial assets diverging sharply from office and retail, which means investors evaluating GMG’s premium valuation cannot anchor to REIT sector averages without accounting for where within the sector the earnings are actually being generated.
The Q3 update’s approximately 3% single-day decline was the market’s immediate reaction to the operational data. The reaffirmed 9% EPS growth guidance for FY26 sits as the counterweight to that selling pressure.
For investors forming their own view on whether current levels represent an attractive entry point, the variables that require assessment are specific:
- WIP execution risk: Can the $18 billion target be achieved by June 2026, and can production rates absorb the expansion?
- Power activation: Will the 0.5 GW of data-centre projects targeted for FY26 development entry proceed on schedule?
- Capital environment: Goodman has noted a selective equity capital environment; how this affects funding for future development phases matters
- Valuation multiple: Whether a trailing P/E of approximately 36 is appropriate for a company with this pipeline composition, yield on cost, and powerbank optionality
This analysis does not prescribe a view. It frames the variables that separate the bull case from the bear case at current levels.
This article is for informational purposes only and should not be considered financial advice. Investors should conduct their own research and consult with financial professionals before making investment decisions.
Goodman’s pipeline tells a compelling story, but execution is the question the market is asking
Five analytical threads converge on a single question. The $14.5 billion WIP balance, with 43% pre-sold, demonstrates the scale and contracted nature of the development machine. The 73% data-centre weighting reflects a deliberate portfolio transformation built on management’s structural demand thesis. The 8% yield on cost confirms that development margin is being created above replacement cost, protected by supply-side barriers that compress competition. The 6.4 GW powerbank provides the strategic optionality that future WIP growth depends on. And the stabilised portfolio, at 97.0% occupancy excluding Greater China, provides the income floor beneath the growth programme.
The market’s 20% de-rating from the August 2025 peak, and the 3% single-day post-update decline, do not reflect a rejection of the growth thesis. They reflect a recalibration of the price investors are willing to pay while waiting for execution to be confirmed.
What would need to be true for GMG to be compellingly priced at current levels is specific: the $18 billion WIP target is achieved by June 2026, development activations stay on schedule, and data-centre demand continues to absorb new supply at yields that protect the 8% cost return. Those are the conditions the share price is waiting for.
Forward-looking statements regarding earnings targets, WIP projections, and development timelines are based on management guidance and are subject to change based on market developments and company performance.