Westpac trades at approximately $36.74 per share, sits above the sector average on three of four financial metrics that matter most to bank investors, and still divides analyst opinion. The reason is that headline earnings tell only part of the story. With all four of Australia’s major banks having reported 1H26 results through May 2026, the window for peer comparison is open. Net interest margins, capital buffers, and return profiles across CBA, NAB, ANZ, and WBC are close enough that differentiation comes from how the numbers are read, and from what supplementary signals sit alongside them. What follows is a four-metric framework applied to Westpac against its peers, with a less conventional but increasingly watched signal layered on top: employee satisfaction data. The aim is a working analytical toolkit, not a snapshot.
What Westpac is and why it belongs in this analysis
Westpac Banking Corporation is Australia’s second-largest bank by asset base among the Big Four, headquartered in Sydney, with operations centred on residential lending and consumer credit. That business mix is not incidental to the analysis that follows. Lending activity accounted for 87% of Westpac’s total income in its most recent full financial year, a concentration that makes margin metrics more diagnostic for this institution than for peers with more diversified revenue streams.
At a share price of approximately $36.74 as at 25 May 2026, Westpac sits in a valuation range that invites scrutiny rather than conviction. The stock is neither cheap enough to attract deep-value positioning nor expensive enough to prompt immediate profit-taking. What determines whether that price represents fair value is the interaction of three quantitative metrics, net interest margin, return on equity, and capital adequacy, and one qualitative signal that institutional investors are paying increasing attention to.
Understanding Westpac’s lending-heavy composition before reading its metrics matters. Comparing NIM figures across banks with materially different revenue mixes produces misleading conclusions.
When big ASX news breaks, our subscribers know first
Net interest margin: where Westpac’s lending model shows up in the numbers
Net interest margin measures the spread between what a bank pays depositors and wholesale debt investors versus what it earns from borrowers. A wider margin signals greater lending profitability. For a bank deriving 87% of revenue from lending, NIM movement is effectively a proxy for earnings trajectory.
Westpac’s NIM of 1.93% (most recent full financial year, calculated by Rask) sits above the ASX major bank average of 1.78%. The peer context sharpens the picture.
One risk embedded in this three-metric approach is that each figure can flatter the bank in isolation; reading NIM alongside ROE guards against the scenario where a bank inflates returns by shrinking its capital base rather than improving lending profitability.
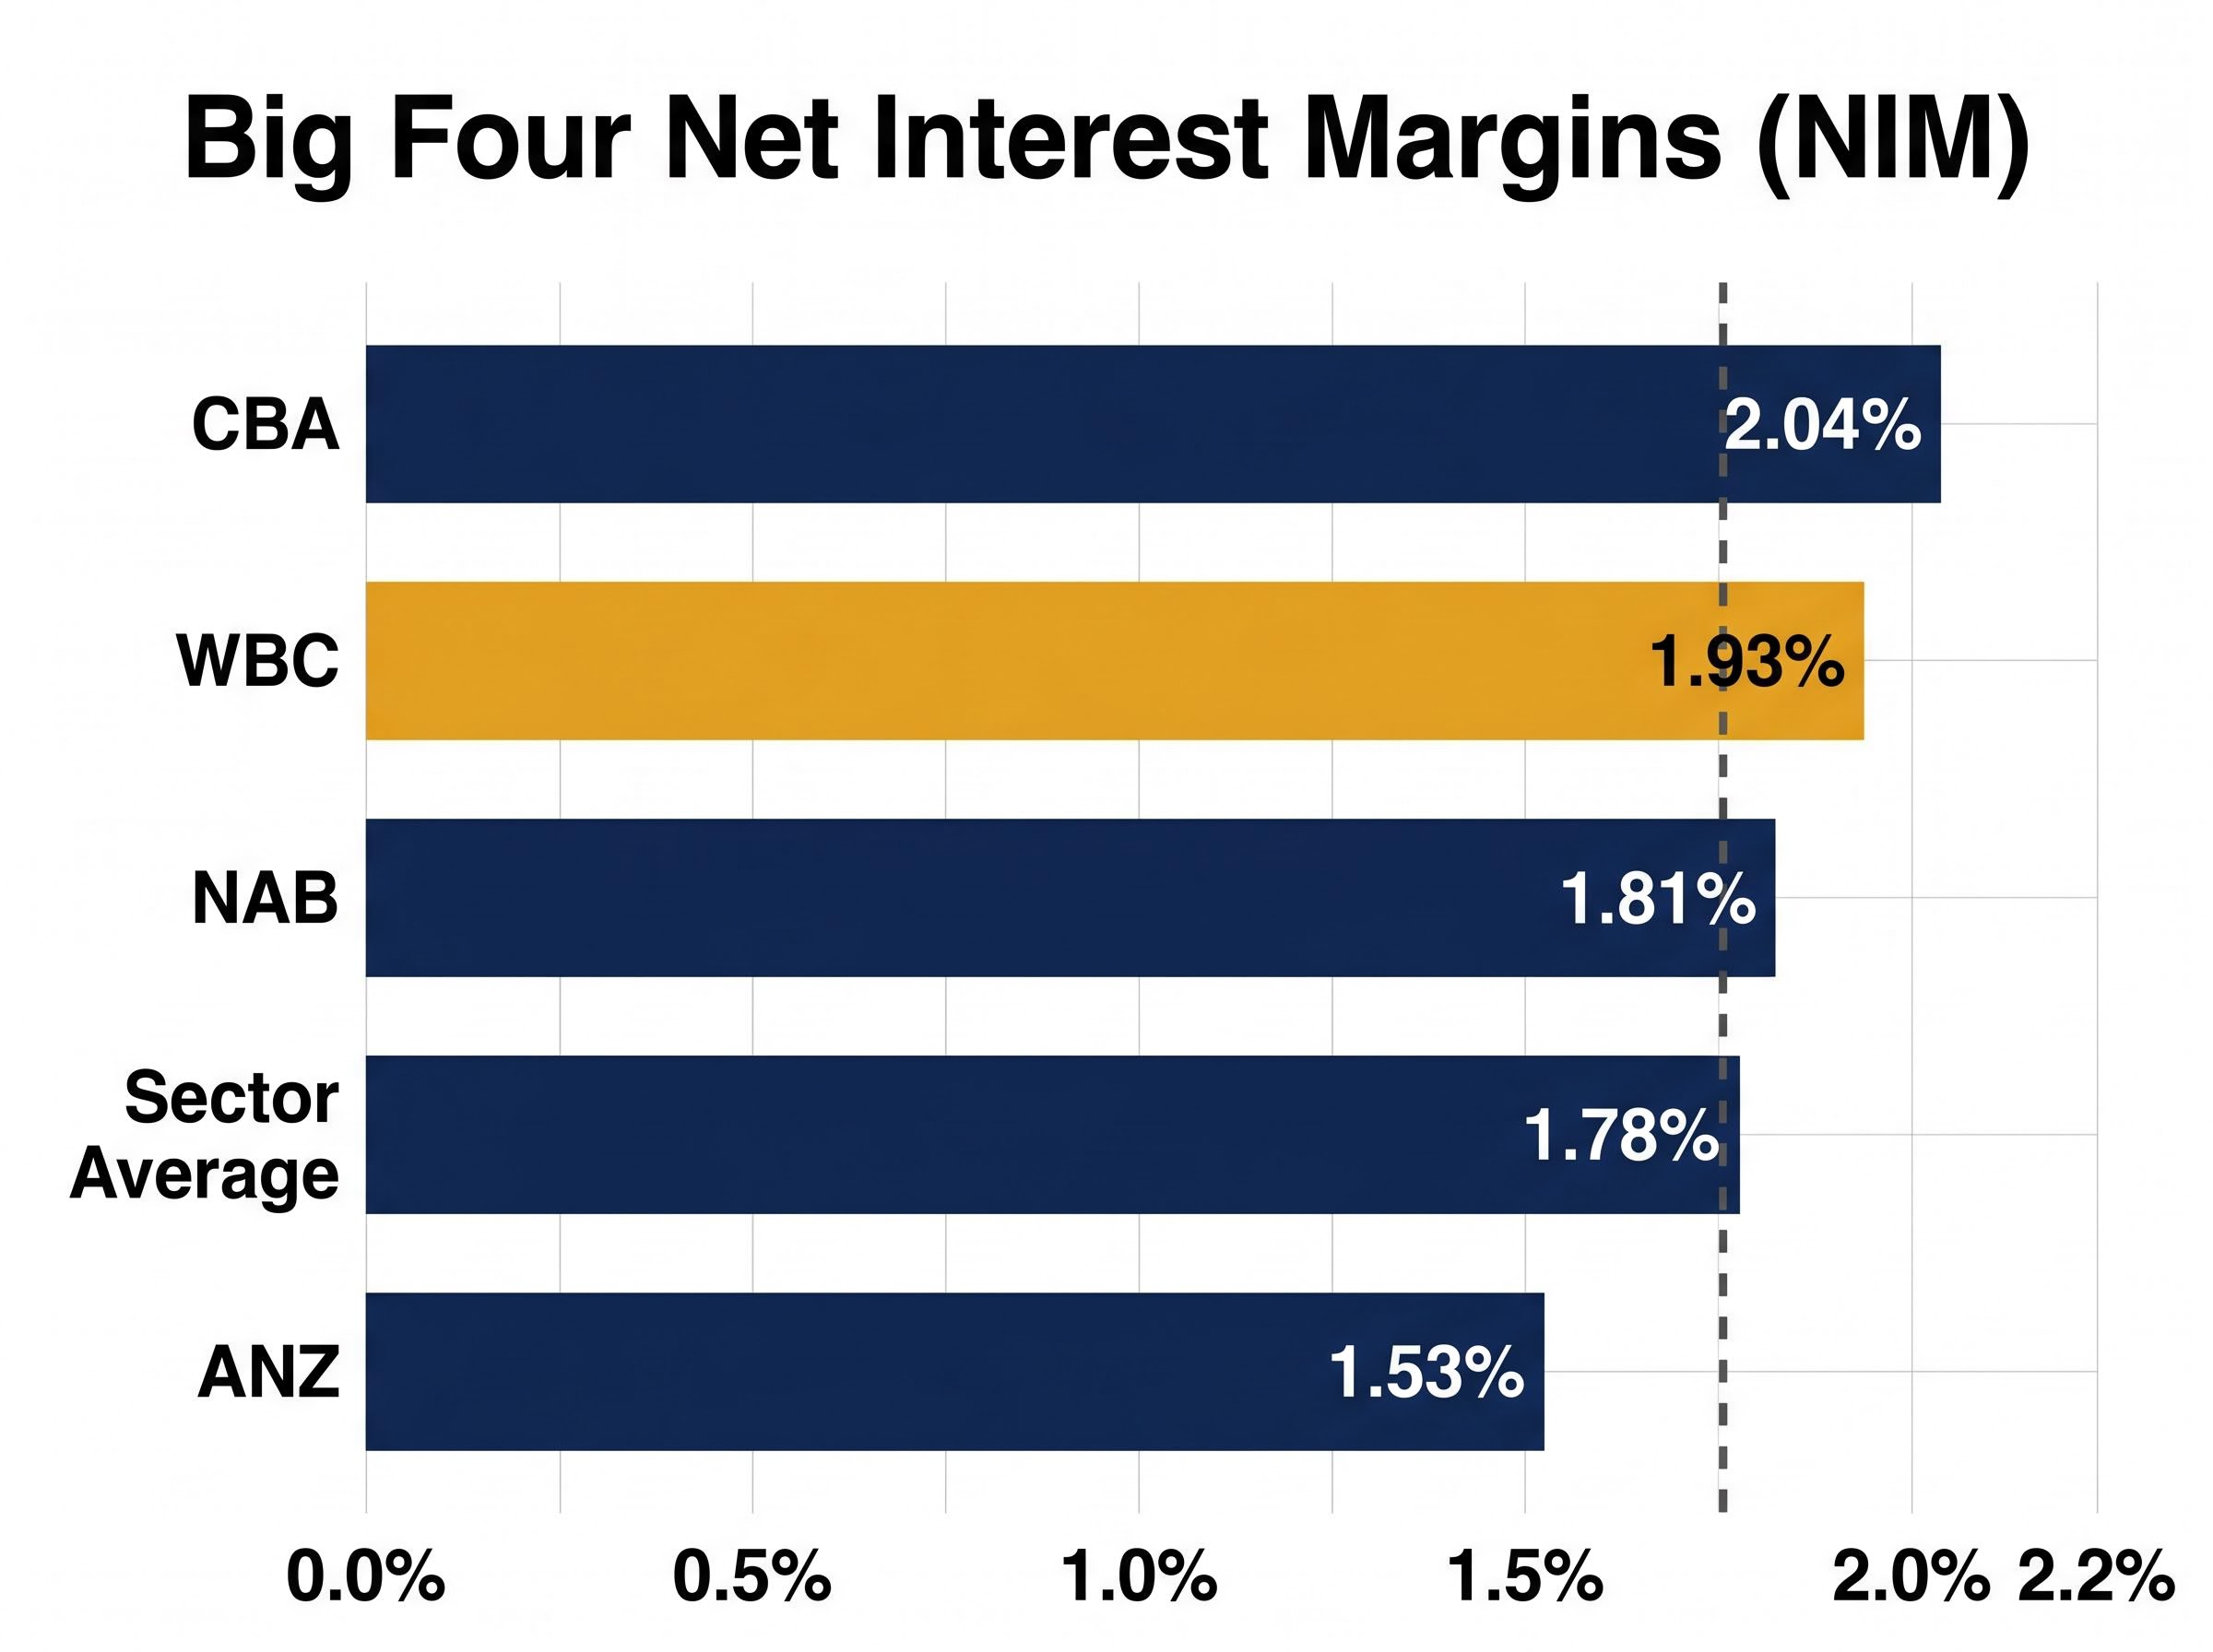
| Bank | NIM | Reporting period | Direction vs prior period |
|---|---|---|---|
| CBA | 2.04% | 1H26 (ended 31 December 2025) | Stable |
| WBC | 1.93% | Most recent full financial year | Above sector average |
| NAB | 1.81% | 1H26 (ended 31 March 2026) | Up 3 basis points |
| ANZ | 1.53% | 1H26 (ended 31 March 2026) | Down 3 basis points year-on-year |
ANZ’s 3 basis point decline is a live example of the macro headwind confronting the entire sector. Mortgage competition, deposit repricing, and the RBA’s rate-cut trajectory have all compressed bank margins since early 2025, a theme covered extensively by Reuters and the Australian Financial Review.
The AFR reported in May 2025 that faster-than-expected rate cuts could compress NIMs across the Big Four, with some offset from deposit repricing. That dynamic remains in play heading into the second half of 2026.
Westpac’s margin advantage is real in the current snapshot. Whether it persists depends on how aggressively the RBA continues cutting and how effectively management defends lending spreads against competitive pressure.
Return on equity and capital strength: the efficiency and resilience picture
NIM addresses the margin question. Return on equity and the Common Equity Tier 1 ratio address two related but distinct concerns: how efficiently a bank converts shareholder capital into profit, and how much high-quality capital it holds against potential losses. Westpac’s positions on both metrics reinforce rather than complicate each other.
ROE: what the peer spread reveals
Return on equity (ROE) measures the profit generated per dollar of shareholder equity. A higher figure reflects more productive capital deployment. Westpac’s ROE of 9.7% (most recent full financial year) sits above the Rask-calculated sector average of 9.35%.
NAB’s cash ROE of 15.2% (excluding notables, 1H26) appears materially higher, but the comparison requires caution. ROE measurement conventions differ across institutions. NAB’s figure excludes notable items and uses a cash basis, while underlying cash ROE was 11.6%. ANZ reported 10.6% on a cash basis for 1H26. Readers should confirm the measurement basis before drawing direct comparisons across the peer group.
Westpac’s above-average ROE on a full-year basis suggests competitive capital efficiency without the distortions that one-off items can introduce to half-year snapshots.
CET1: strong buffers across the board, with nuances
The Common Equity Tier 1 ratio represents the proportion of risk-weighted assets held as high-quality capital, the buffer that protects depositors, dividends, and institutional stability against financial distress. APRA requires major banks to maintain a minimum of 10.25%, inclusive of the 1% countercyclical buffer.
| Bank | ROE (most recent) | CET1 (most recent) | CET1 vs APRA minimum |
|---|---|---|---|
| WBC | 9.7% (full year) | 12.4% (Level 2, 1H26) | +215 bps |
| ANZ | 10.6% (cash, 1H26) | 12.4% (Level 2, 1H26) | +215 bps |
| CBA | 13.64% (1H26) | 12.3% (31 December 2025) | +205 bps |
| NAB | 15.2% (cash, ex-notables, 1H26) | 11.65% (Group, 31 March 2026) | +140 bps |
With all four banks sitting between 11.65% and 12.5%, CET1 ratios are close enough that differentiation on this metric alone is limited. All are comfortably above the regulatory floor. APRA’s AT1 phase-out consultations in 2025 adjusted the leverage ratio framework but did not alter the 10.25% core CET1 minimum.
For income-focused investors, Westpac’s combination of above-average ROE and top-of-peer-group CET1 suggests competitive returns without sacrificing the capital cushion that protects dividends and absorbs credit stress.
Employee satisfaction data: a supplementary signal that analysts are watching
Financial metrics across Australia’s Big Four tend to cluster closely. This is not a coincidence; it reflects the competitive dynamics of a mature, oligopolistic banking market where pricing, products, and regulation create natural convergence. That convergence is precisely the condition under which supplementary qualitative signals gain analytical relevance.
The convergence visible in this peer table is not an anomaly; when financial metrics cluster closely across a mature oligopoly, qualitative factors as differentiation signals carry more analytical weight, which explains the growing institutional interest in culture data and NIM trajectory as the primary drivers of relative returns.
Westpac’s workplace culture score stands at 3.4 out of 5 on the Seek platform (as at May 2026), compared with an ASX banking sector average of 3.1 out of 5 calculated by Rask from Seek data. A higher score is theorised to signal stronger staff retention and higher-quality operational execution, two factors that affect earnings well before they appear in NIM or ROE figures.
Investors and commentators have increasingly noted the role of culture data in bank stock assessment:
- Management quality signal: the AFR reported in July 2024 that investors were using employee sentiment as a proxy for management quality and operational resilience in bank stocks
- Staff retention proxy: Reuters noted in October 2024 that workforce culture was being incorporated into ESG-adjacent assessment frameworks for financials
- Reputational risk indicator: the AFR reported in February 2025 that workplace culture data helps differentiate banks on execution quality when financial metrics cluster closely
The AFR observed in February 2025 that culture data gains analytical relevance specifically when financial metrics across peers cluster closely, which is the exact condition present across the Big Four in 1H26.
Culture scores remain a supplementary, not primary, input. They carry the most weight as a differentiation signal when quantitative metrics are otherwise comparable, as they are across the Big Four today.
Valuation: what the DDM analysis suggests about WBC at current prices
The Dividend Discount Model (DDM) is a valuation method well-suited to ASX bank stocks given their consistent dividend histories. The formula is straightforward: share price equals annual dividend divided by the difference between the risk rate and the dividend growth rate.
Using Westpac’s most recent full-year dividend of $1.66 per share and a forward estimate of $1.61 per share, the DDM produces a range of valuations depending on the assumptions applied.
| Growth rate | Risk rate 6% | Risk rate 8.5% | Risk rate 11% |
|---|---|---|---|
| 2% | $41.50 | $25.54 | $18.44 |
| 4% | $83.00 | $36.89 | $23.71 |
WBC share price at time of analysis: approximately $36.74. Full DDM matrix range spans from approximately $17.89 to $80.50 across all risk rate (6%-11%) and growth rate (2%-4%) assumptions.
The base case DDM average sits at approximately $35.10 per share, with the forward-dividend-adjusted average at approximately $34.05. Without franking credits, Westpac appears modestly expensive relative to those estimates at its current price of $36.74. The franking-credit-adjusted estimate, however, rises to approximately $48.64, implying more reasonable value for Australian resident investors able to utilise those credits.
Franking credit mechanics produce materially different after-tax outcomes depending on the investor’s tax status; superannuation funds in pension phase and SMSF accounts can often realise the full credit as a refundable offset, which explains why the franking-adjusted DDM estimate of approximately $48.64 is the more relevant figure for a significant portion of Westpac’s retail shareholder base.
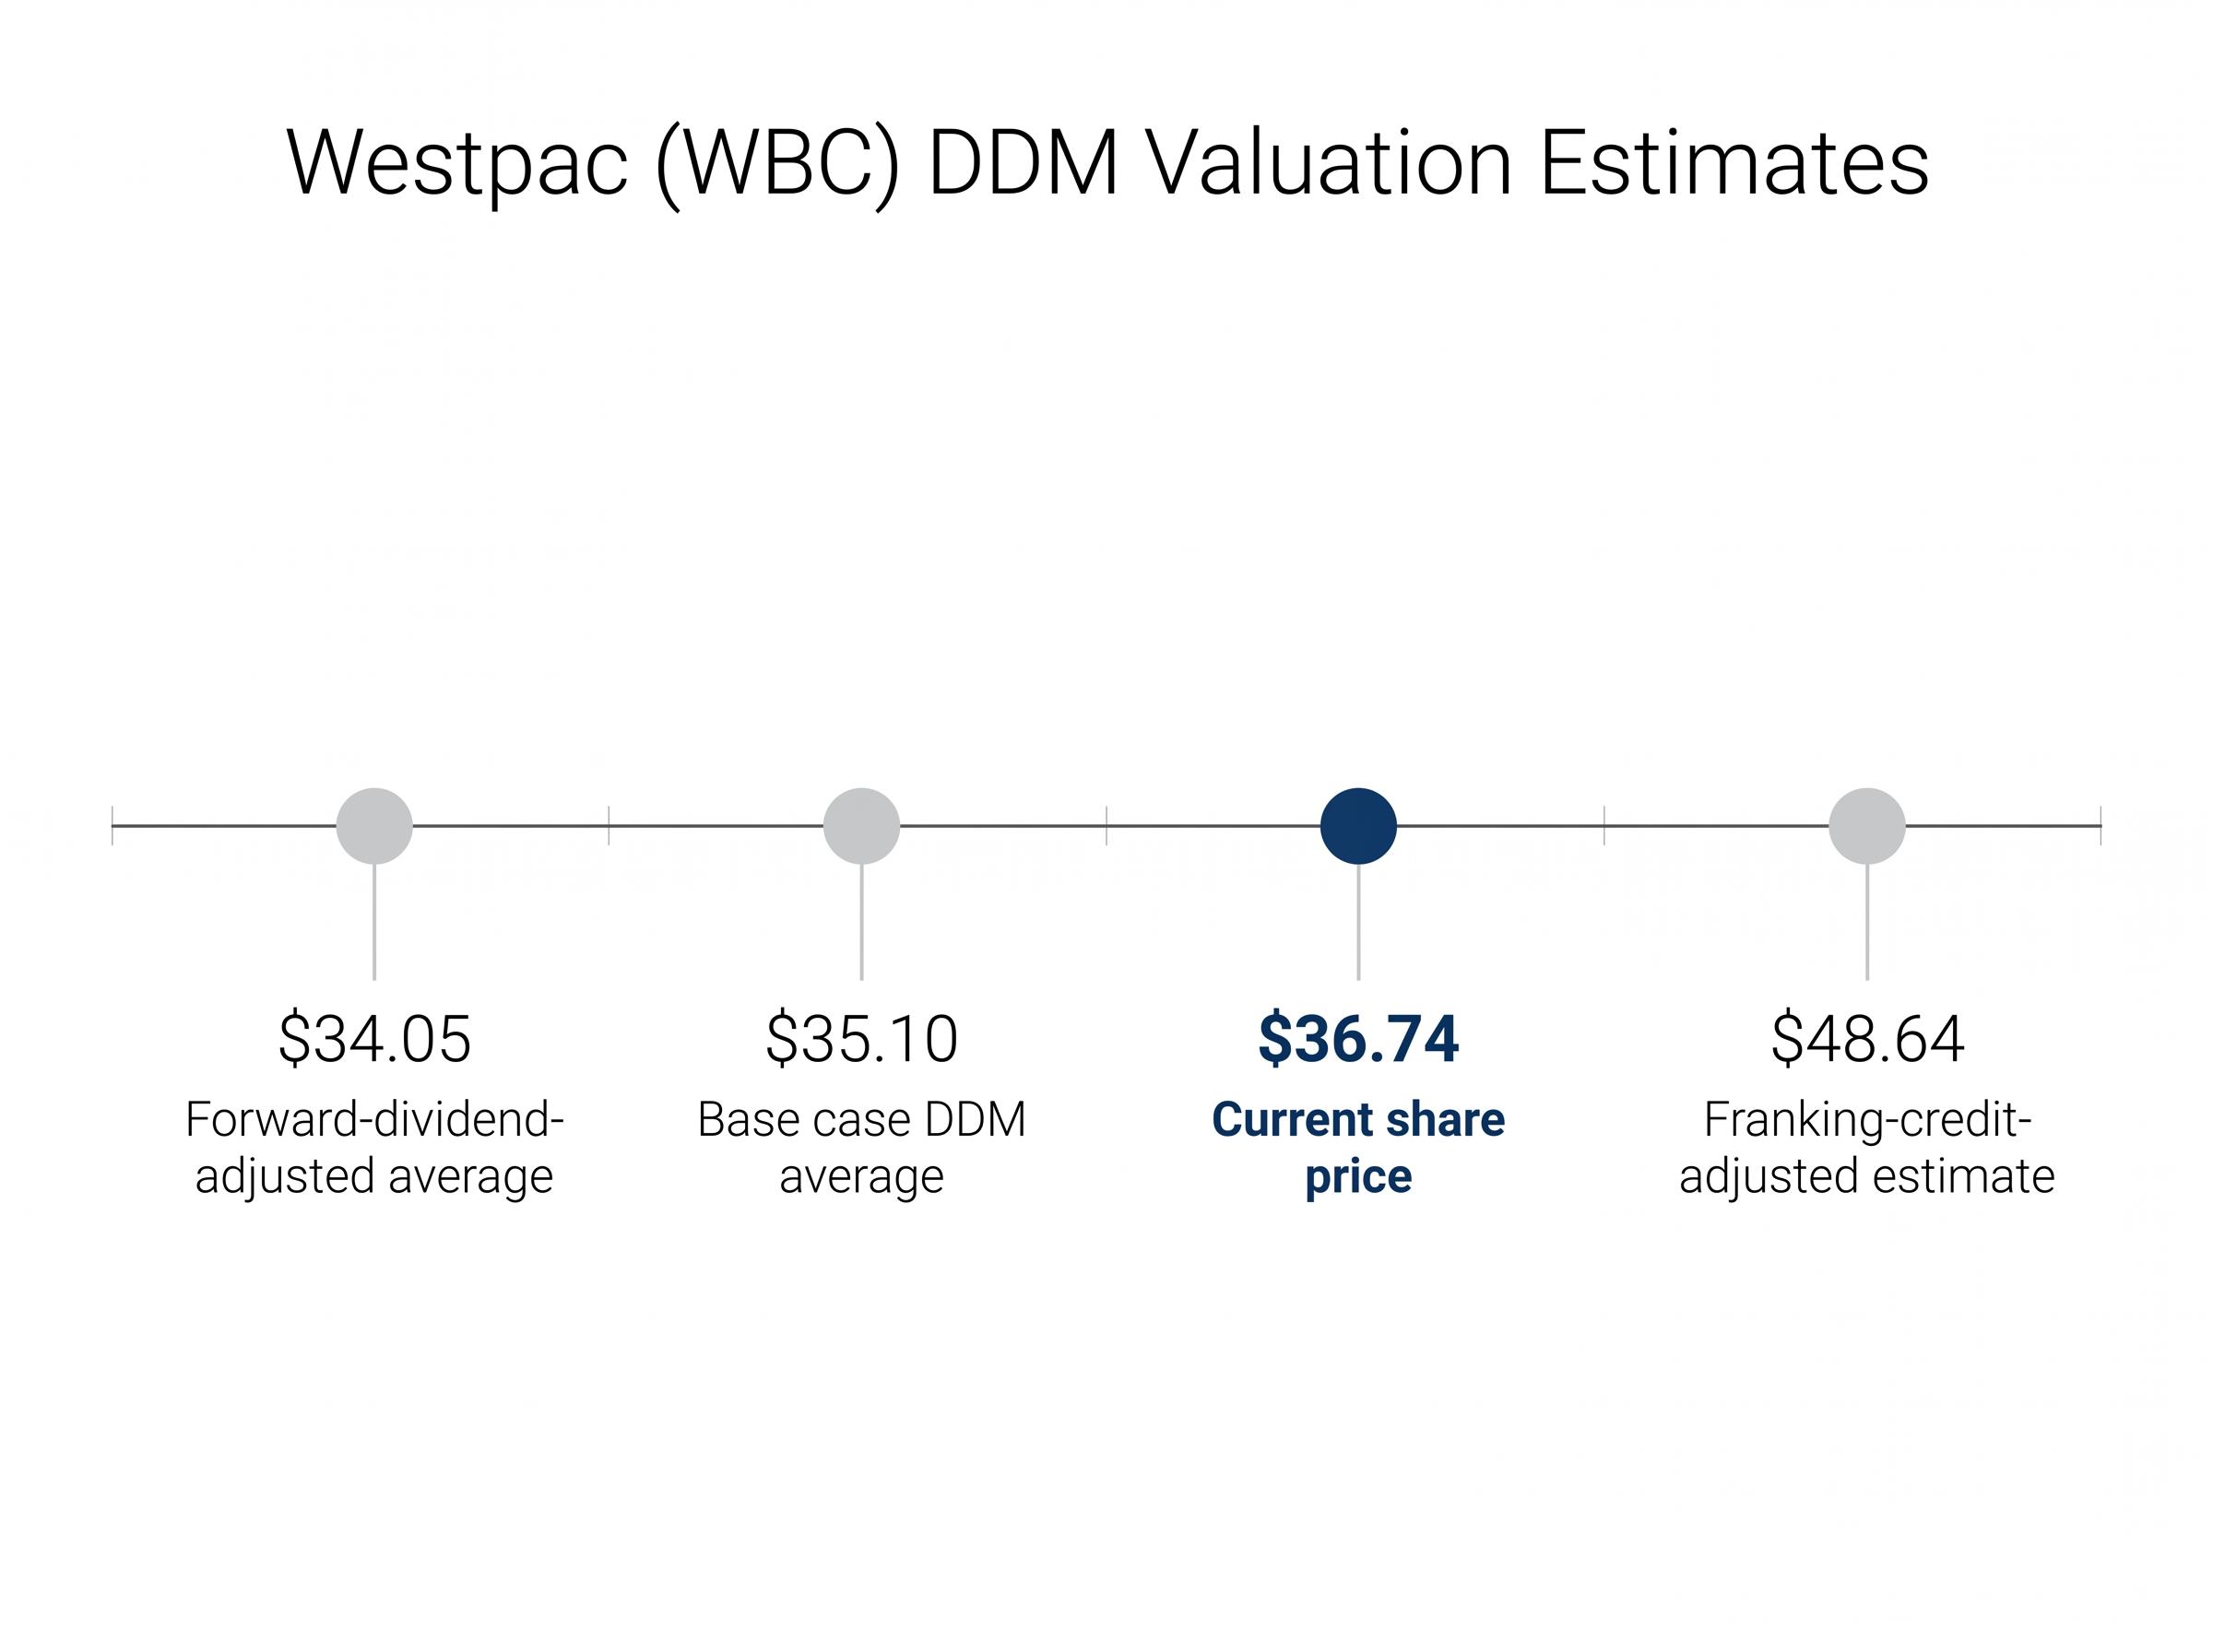
The sensitivity matrix makes one point clearly: valuation is always a range, not a point. Small changes in the risk rate or growth assumption produce materially different outputs.
Rask has cautioned that DDM analysis should be one component of broader research and not the sole basis for any investment decision.
This article is for informational purposes only and should not be considered financial advice. Investors should conduct their own research and consult with financial professionals before making investment decisions. Past performance does not guarantee future results. Financial projections are subject to market conditions and various risk factors.
Westpac’s competitive position: integrating the financial and qualitative signals
Across the metrics examined, Westpac’s position relative to the sector average is consistent:
- NIM: 1.93% vs sector average 1.78%, above average
- ROE: 9.7% vs sector average 9.35%, marginally above average
- CET1: 12.4%-12.5%, at the top of the Big Four peer cluster
- Workplace culture: 3.4 vs sector average 3.1, above average
That profile suggests an institution performing competitively across multiple dimensions in the current snapshot. The structural tension, however, is real: macro NIM pressure from RBA rate cuts and mortgage competition is a named downside risk that could compress Westpac’s margin advantage over the medium term.
The framework itself is transferable. As new half-year and full-year results are released across the Big Four, readers can apply the same NIM, ROE, CET1, and culture-score approach to any peer institution, testing where the numbers cluster and where genuine differentiation appears.
Applying the same three-metric test to a regional peer like Bendigo and Adelaide Bank reveals how the framework scales beyond the Big Four; BEN’s above-peer NIM of 1.90% paired with a below-average ROE of 7.9% and a culture score of 2.9 illustrates precisely the kind of internal inconsistency the framework is designed to surface.