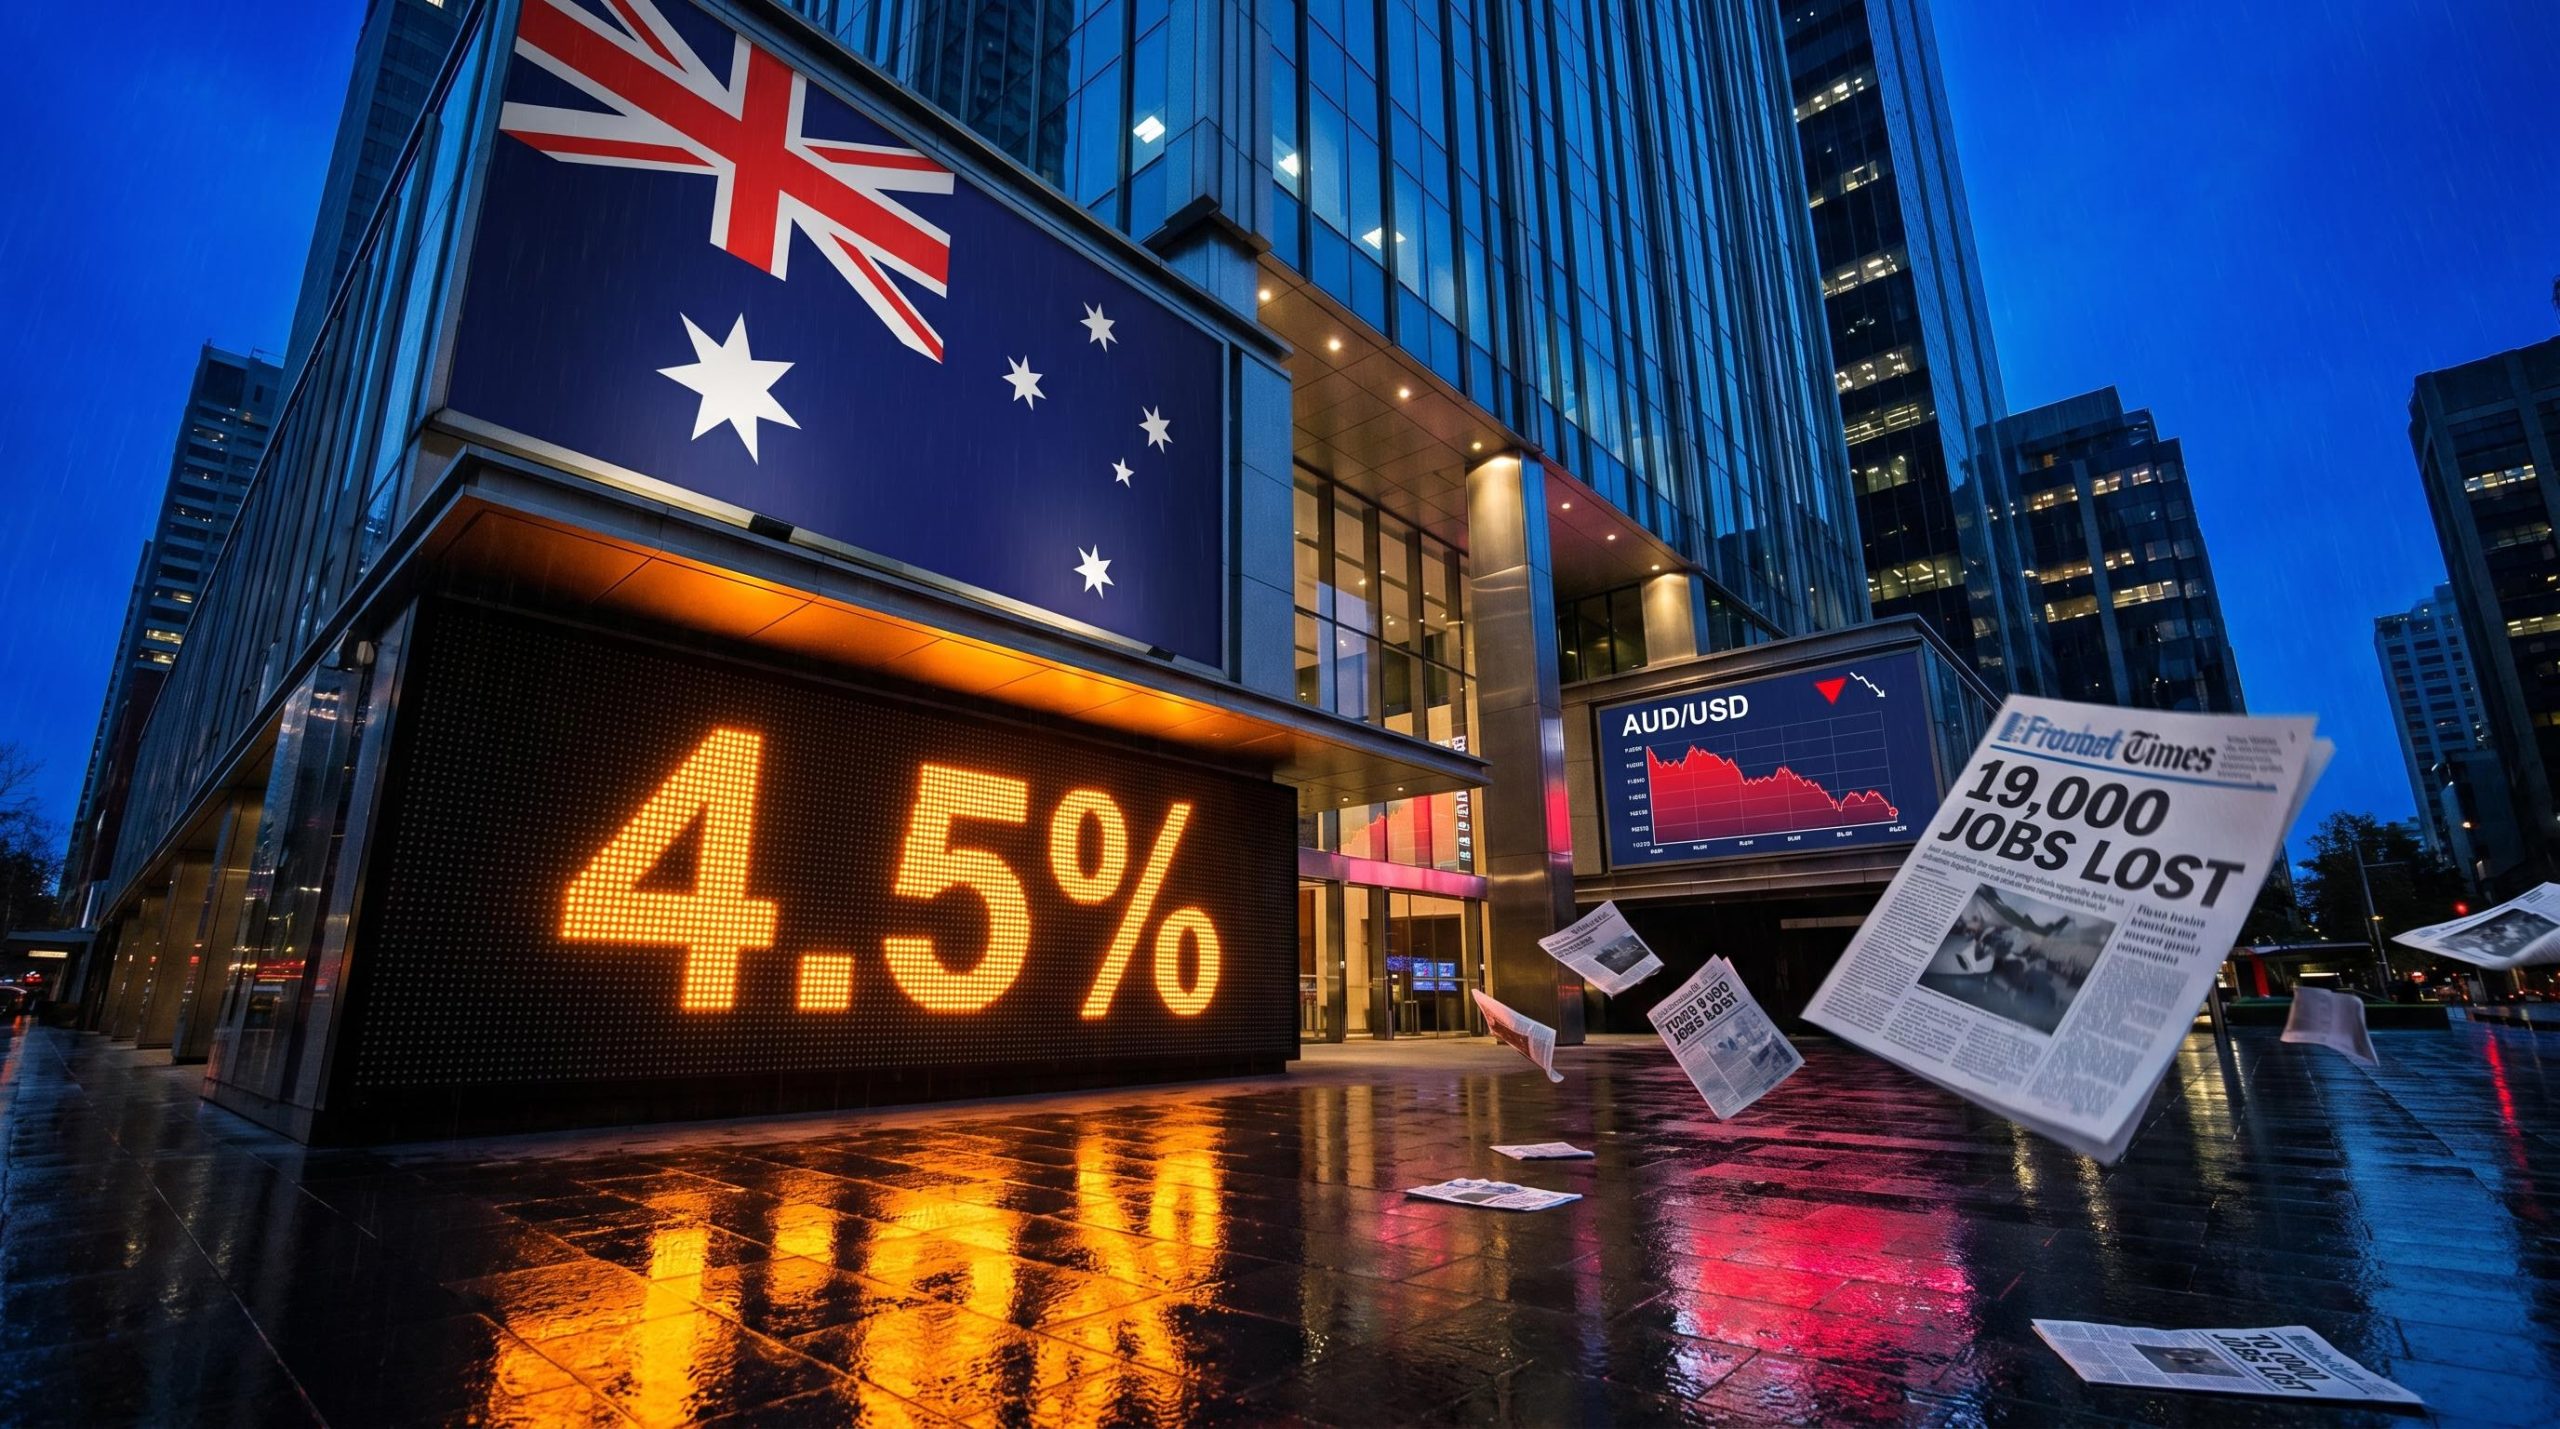
Australia’s unemployment rate jumped to 4.5% in April 2026, its highest reading in recent months, after the labour market shed 19,000 jobs in a single month. The Australian Bureau of Statistics (ABS) released the April Labour Force data on 21 May 2026, landing against a backdrop of active debate about the Reserve Bank of Australia’s (RBA) rate-cut timeline. Every labour market print has become a closely watched event for investors across equities, fixed income, and the Australian dollar. This article breaks down what the headline and underlying figures actually show, why the trend data tells a more measured story, and what the combined picture means for the RBA’s next move and for rate-sensitive assets.
April labour market data shows 19,000 job losses and a sharper jobless rate
The seasonally adjusted unemployment rate rose to 4.5% in April 2026, with the economy recording a net loss of 19,000 employed persons. The total number of unemployed persons climbed by 33,000, a figure that splits unevenly: 22,000 of the newly unemployed were seeking part-time work, while 11,000 were seeking full-time roles.
The key data points from the release:
- Unemployment rate: 4.5% (seasonally adjusted)
- Employed persons change: -19,000
- Unemployed persons change: +33,000 (part-time seekers +22,000; full-time seekers +11,000)
- Full-time employment: -11,000
- Part-time employment: -8,000
- Underemployment rate: 5.8% (down 0.1 percentage points)
The ABS survey reference period ran from 29 March 2026 to 11 April 2026. The data was released on 21 May 2026.
The composition of the job losses matters as much as the headline figure. Full-time roles accounted for 11,000 of the decline and part-time roles for 8,000, while the surge in unemployed persons was overwhelmingly driven by those seeking part-time work. That distinction shapes whether the softening reads as broad-based or concentrated in specific segments.
When big ASX news breaks, our subscribers know first
Female employment leads the decline in a gender-split result
A single headline number concealed two opposite labour market experiences happening at the same time. ABS Head of Labour Statistics Sean Crick attributed the overall employment decline primarily to female employment losses, a detail that reframes the April print entirely.
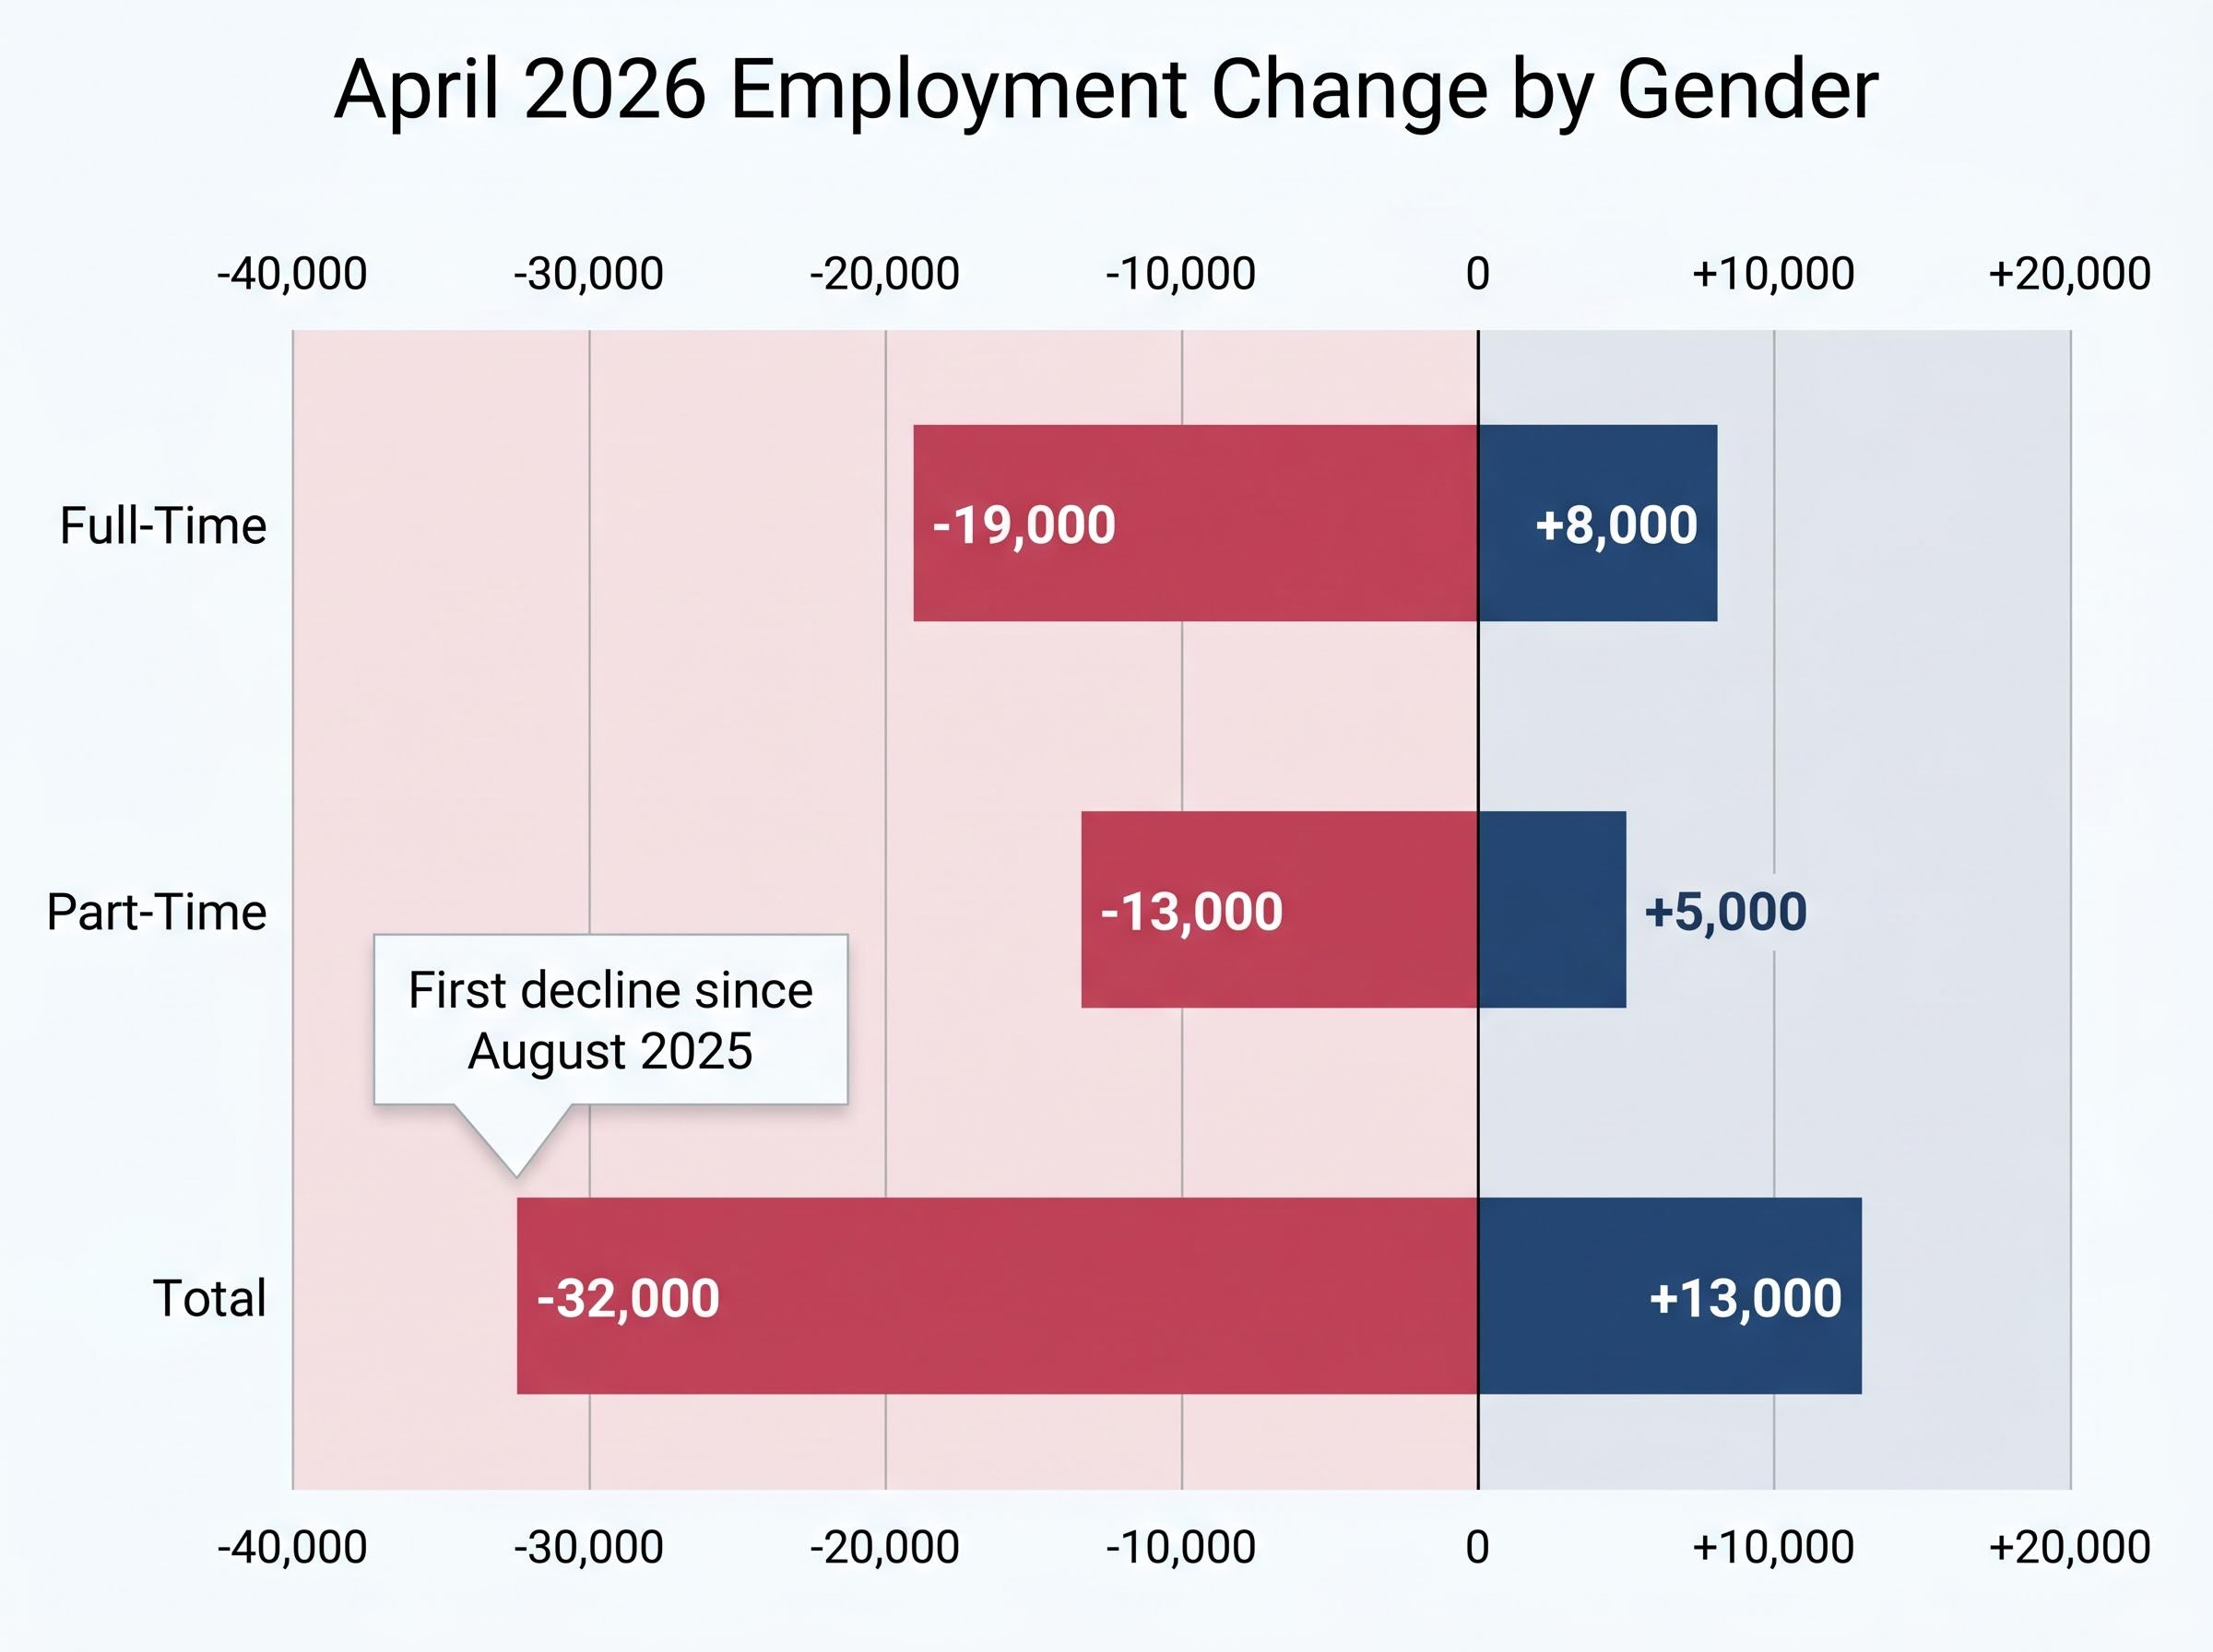
| Category | Female Change | Male Change |
|---|---|---|
| Full-Time | -19,000 | +8,000 |
| Part-Time | -13,000 | +5,000 |
| Total | -32,000 | +13,000 |
Male employment rose across both full-time and part-time categories. Female employment fell across both. This was the first decline in female employment since August 2025, marking a departure from recent trend.
The divergence carries weight for investors assessing consumer spending resilience. Female employment participation is closely linked to household income in discretionary spending categories, and a sustained pullback in female-dominated service-sector roles could weigh on retail and consumer-facing earnings through mid-2026.
What “seasonally adjusted” versus trend data actually tells you
Two legitimate unemployment figures, 4.5% and 4.3%, appeared in the same ABS release. Neither is wrong. Understanding why both exist is the single most useful skill for interpreting every future Labour Force report.
Seasonally adjusted data removes recurring seasonal patterns, such as the regular employment swings around Christmas or the start of the school year, to produce a cleaner month-to-month comparison. This is the figure that generates headlines. Trend data goes further, smoothing out monthly volatility to reveal the underlying direction of the labour market over time. Where the seasonally adjusted rate can jump or fall sharply on a single month’s sample, the trend rate moves slowly and is harder to shift.
In April 2026, the seasonally adjusted rate jumped to 4.5%. The trend rate held steady at 4.3%.
The ABS Labour Force methodology distinguishes seasonal adjustment from trend estimation by treating the two series as serving different analytical purposes: seasonal adjustment isolates month-to-month movements by removing recurring calendar effects, while trend smoothing removes irregular volatility to reveal the labour market’s underlying direction across a longer horizon.
What the April 2026 trend figures show
- Trend unemployment rate: 4.3% (unchanged)
- Trend employment growth: 0.2%
- Trend hours worked growth: 0.3%
- Annual hours worked growth: 2.7%
- Annual employment growth: 1.3%
- Trend underemployment rate: 5.9% (unchanged)
- Trend underutilisation rate: 10.2% (unchanged)
The gap between annual hours worked growth (2.7%) and annual employment growth (1.3%) points to productivity-per-worker improvement alongside modest headcount expansion. Both the trend underemployment and underutilisation rates were unchanged, reinforcing a picture of gradual rather than abrupt softening.
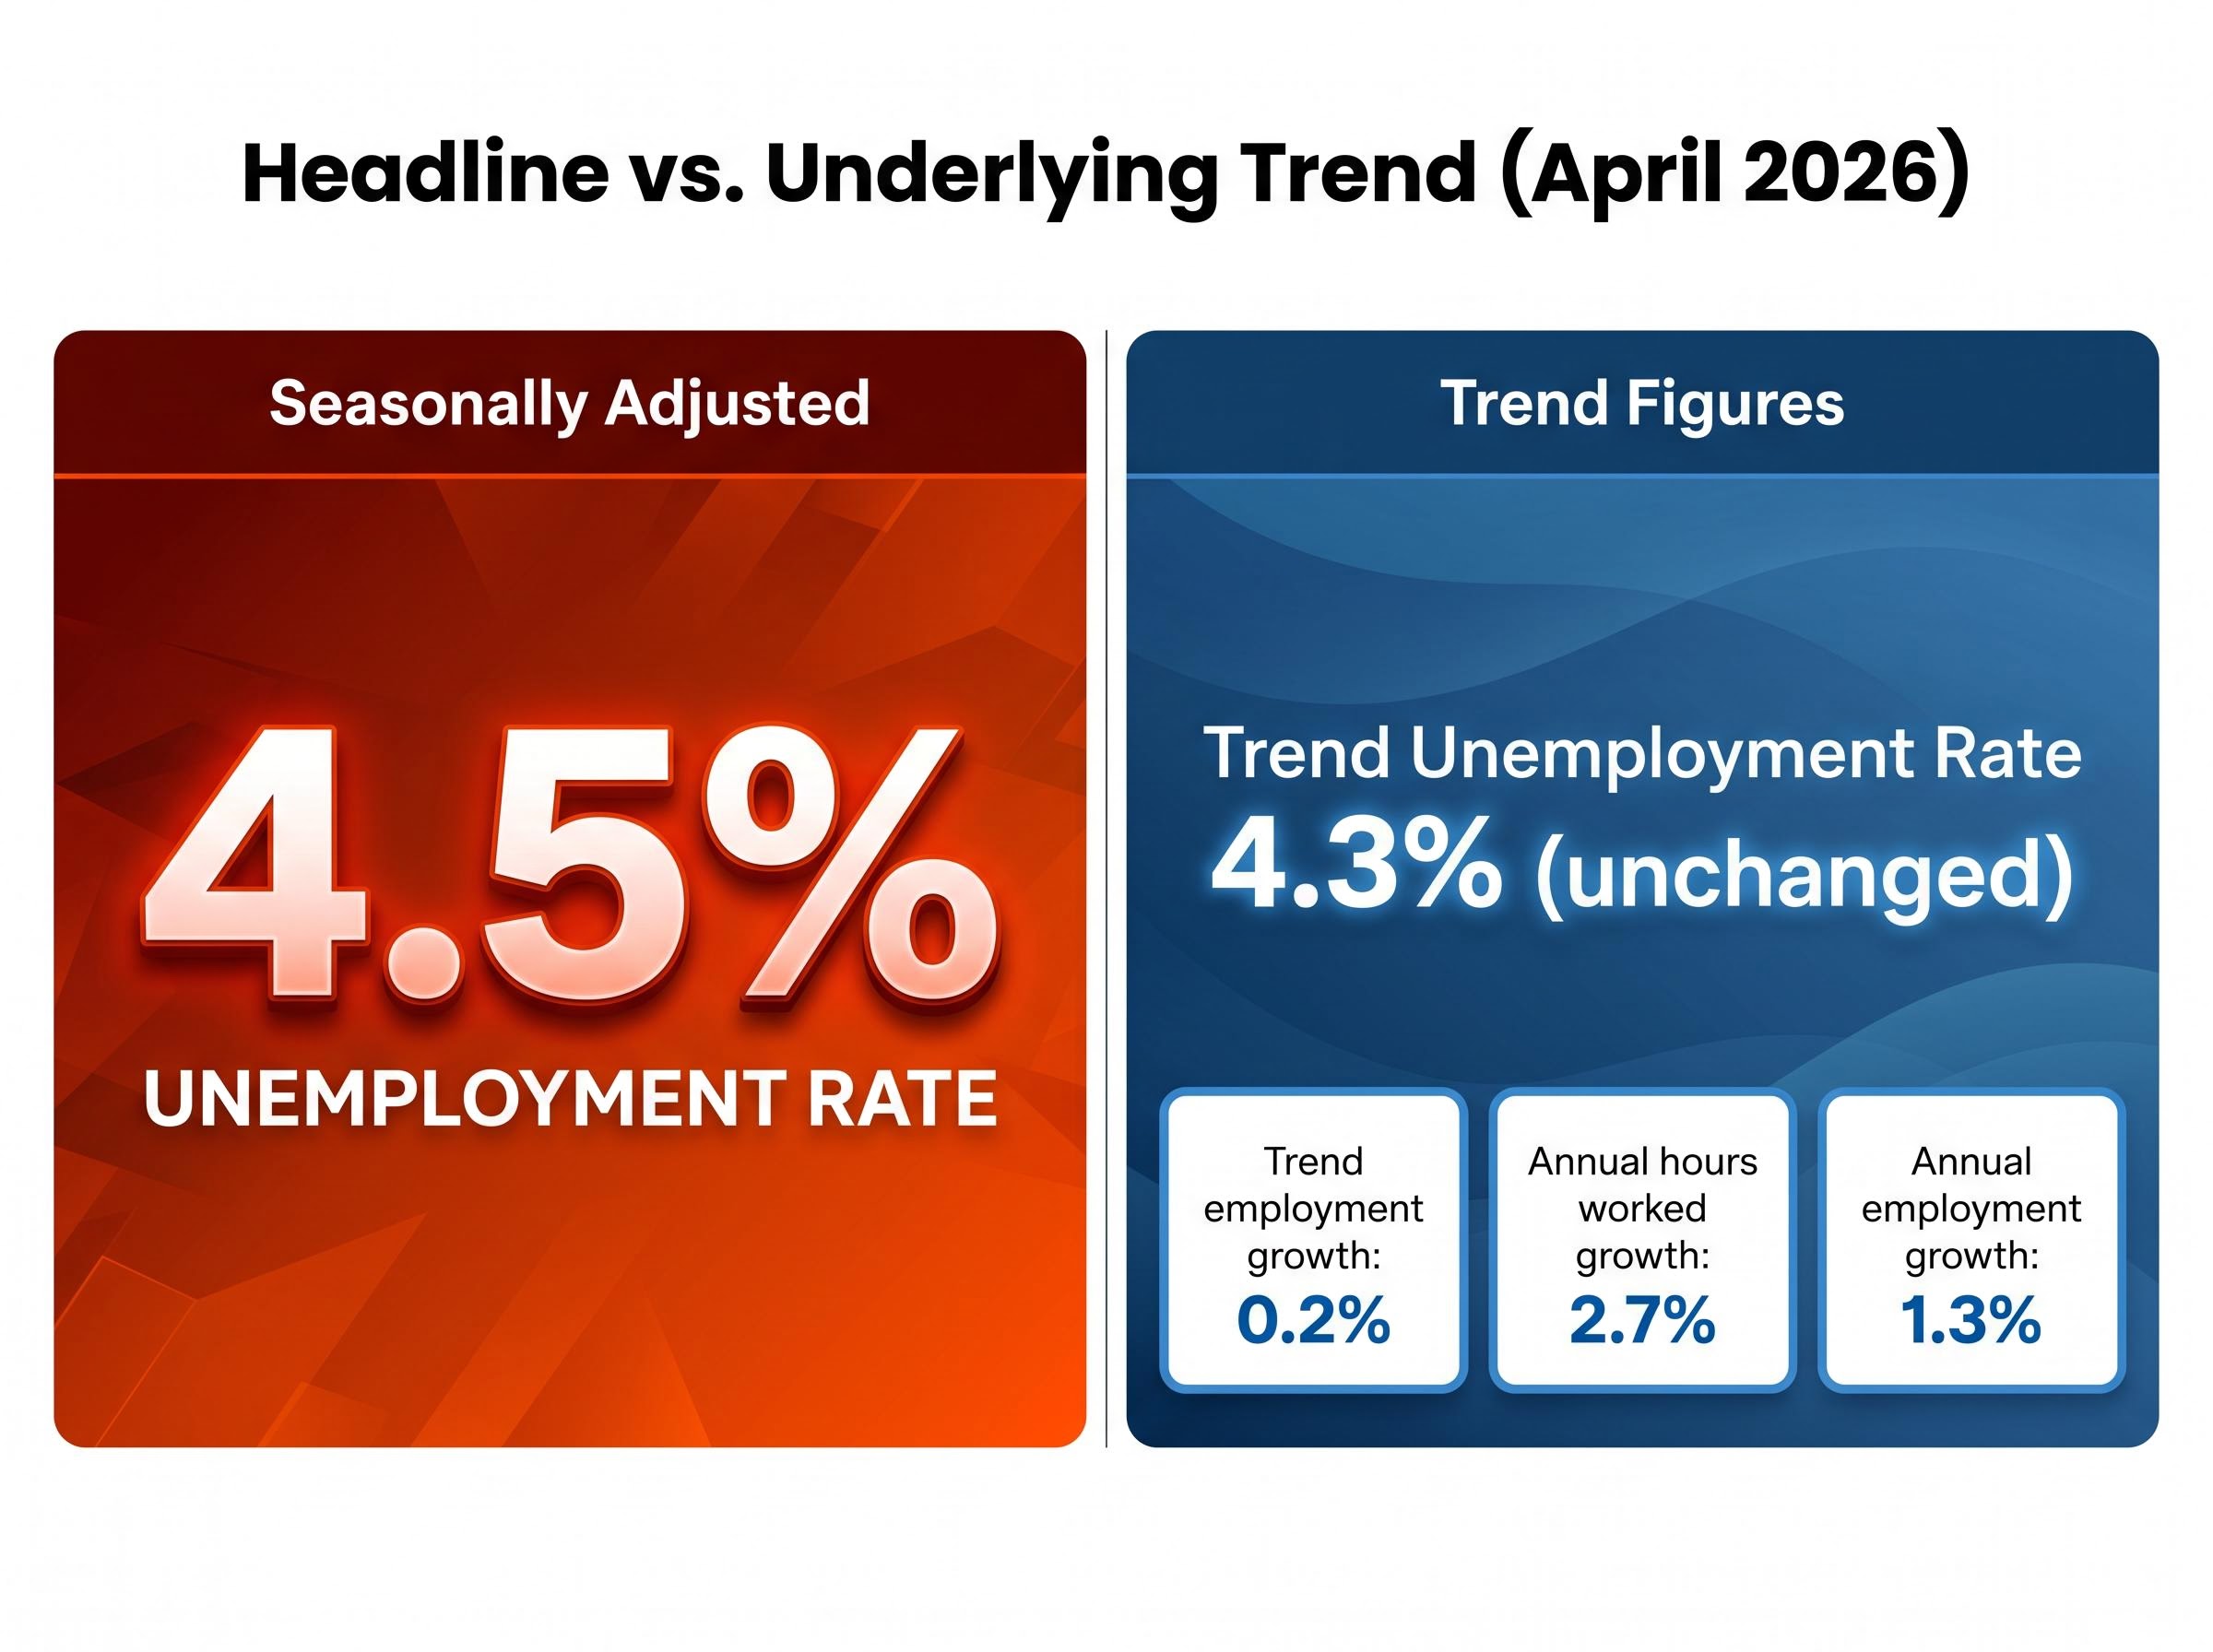
Investors who anchor solely to the seasonally adjusted headline risk overreacting to single-month volatility. The trend series helps calibrate whether a monthly move represents a genuine shift or normal statistical noise.
The hours-worked paradox: fewer jobs, more work
Total hours worked grew by 15.8 million hours in April 2026. Hours worked per employed person rose 0.9%. Yet the number of employed persons fell. The figures look contradictory. They are not, but the resolution requires working through four layered explanations.
- Composition effects: Employment losses were concentrated in low-hour, part-time roles, particularly female part-time positions. When those roles disappear while higher-hour workers remain, the average shifts upward, and total hours can rise even as headcount falls.
- Employer hours strategy: Some employers appear to have raised hours for existing staff rather than adding headcount, a pattern consistent with cautious labour demand.
- Reduced multiple-job holding: A fall in workers holding a second job or multiple casual roles can reduce the count of employed persons while total hours remain stable or rise.
- Normal sampling volatility: Monthly labour force estimates are inherently noisy. One month can produce counter-intuitive combinations due to sampling variation and the timing of public holidays.
The ABS explicitly confirmed that April 2026 data passed quality assurance under the new collection system introduced that month, including rotation group analysis conducted as part of the review.
Rising hours worked despite falling employment signals that productive capacity in the economy may be holding up better than the headline job loss implies. For GDP forecasting purposes, this distinction matters: hours worked feeds directly into output estimates, and a labour market that is shedding low-hour roles while remaining workers contribute more may not produce the output gap the headline unemployment rate suggests.
What the major banks and markets made of the 4.5% print
All four major Australian banks published responses within 24 hours of the release. The shared framing: gradual cooling, not a catalyst for immediate RBA action.
- CBA: Described the print as “not a game-changer,” noting trend unemployment at 4.3% and rising hours worked as evidence of underlying resilience.
- Westpac: Called the report “supportive but not decisive” for near-term easing, flagging the need for further wages and inflation confirmation.
- ANZ: Labelled the result “soft at the margin,” arguing the RBA would look through month-to-month volatility.
- NAB: Characterised 4.5% as “a touch weaker than expected but not outside expectations.”
All four maintained their existing late-2026 timelines for the first RBA rate cut. The RBA cash rate remains at 4.35%, unchanged at the May 2026 decision, with the next board meeting scheduled for early June 2026. No bank called for an immediate move purely on the basis of this release.
The RBA’s third consecutive hike to 4.35% in May 2026 was decided with an eight-to-one board vote, preserving full policy optionality on whether a fourth move would follow in July, a posture that leaves labour market and inflation data as the primary inputs before any easing discussion becomes credible.
How markets responded on 21 May 2026
AUD/USD softened modestly after the 11:30am AEST release, with intraday commentary describing the move as “limited.” Traders had already anticipated some labour market softening following earlier RBA communication.
On the ASX, A-REITs and yield-sensitive sectors outperformed the broader market, linked to increased confidence in an eventual easing path. Financials showed mixed performance, balancing the prospect of eventual rate cuts against softer credit growth implications.
Overnight index swaps and interest-rate futures nudged slightly more dovish, pricing in marginal additional probability of a late-2026 cut. Commentary stressed the shift “fine-tuned” existing expectations rather than fundamentally repricing the RBA curve.
The labour market path ahead and what it means for Australian investors
The RBA’s May 2026 Statement on Monetary Policy (SoMP) projects unemployment drifting from the low-4s toward the mid-4s and potentially approaching 5% into 2027. The RBA characterises the labour market as “tight but easing.”
The RBA May 2026 Statement on Monetary Policy projects unemployment drifting from the low-4s toward the mid-4s and potentially approaching 5% by 2027, characterising the labour market as tight but easing, with vacancies declining from earlier peaks and underemployment edging gradually higher.
RBA May 2026 SoMP: The labour market is described as “tight but easing,” with vacancies declining from earlier peaks and underemployment edging higher.
No major bank forecasts a return to sub-4% unemployment within the current forecast window. The consensus describes an orderly drift higher, not a collapse.
Per capita output fell approximately 0.7% across 2025 even as headline GDP grew, a divergence that gives the April 2026 labour market softening additional resonance: the economy has been losing individual productive ground for over a year, and a rising unemployment rate compounds that pressure on household income rather than marking a clean break from prior conditions.
For investors, three asset classes sit directly in the transmission path:
| Asset Class | Baseline Scenario Implication | Key Risk to Watch |
|---|---|---|
| AUD | Gradual depreciation bias if rate-cut path solidifies | Stronger-than-expected inflation delays cuts, supporting AUD |
| ASX A-REITs | Positive bias in a confirmed easing cycle | Credit quality deterioration if unemployment rises faster than forecast |
| ASX Financials | Mixed; lower rates offset by softer credit growth prospects | Wages data disappoints, delaying RBA action and compressing margins |
The next key signposts: the June Labour Force release and the RBA’s early June board meeting. Inflation data and wages growth remain the inputs the RBA has flagged as decisive for any rate-cut decision.
A measured softening, not a breaking point
The 4.5% unemployment rate marks a meaningful step in the direction of labour market cooling. Yet the trend data holding at 4.3%, the resilience in hours worked, and the unanimous bank consensus all point to gradual easing rather than sudden deterioration.
The next RBA board meeting in early June 2026 and the following Labour Force release will together shape the rate-cut narrative through mid-year. The data strengthens the case that the RBA’s next move is a cut, but patience is required on timing.
For investors, the AUD and rate-sensitive ASX sectors, particularly A-REITs, remain the primary transmission channels to monitor. The direction of travel is toward easing. The pace remains the open question.
Investors wanting to act on the easing cycle before it is fully priced will find our dedicated guide to ASX sector positioning ahead of RBA rate cuts, which covers which sectors have historically outperformed before and after the first confirmed cut, including the specific dynamics for REITs, technology, and bank stocks where the rate-sensitivity picture is more nuanced than it appears.
This article is for informational purposes only and should not be considered financial advice. Investors should conduct their own research and consult with financial professionals before making investment decisions.