Piper Sandler Says the US Fiscal Crisis Has Already Begun
58 mins ago

Markets are pricing roughly a one-in-five chance that the Reserve Bank of Australia raises rates again in August 2026, even as its counterpart across the Tasman holds at 2.25% for a third straight meeting. Two economies, one shared disinflation story, and two very different policy clocks. The week of 27-29 May 2026 delivers three interlocking data events: the RBNZ’s rate decision, Australia’s April CPI print, and Tokyo’s May CPI release. Each carries direct implications for rate paths in its home economy, but together they sketch a broader regional picture of where the inflation outlook is most uncertain, which central banks still face live tightening risk, and where persistent price pressures are proving hardest to dislodge. What follows is an analysis of what each data point means in isolation and in combination, how the structural engines of inflation differ between Australia and New Zealand, and what internationally minded investors holding AUD- or NZD-denominated assets should watch as this data lands.
The 27-29 May window is not three separate events. It is a concentrated regional stress test for Asia-Pacific monetary policy, with each release shaping the interpretation of the next.
The sequencing matters:
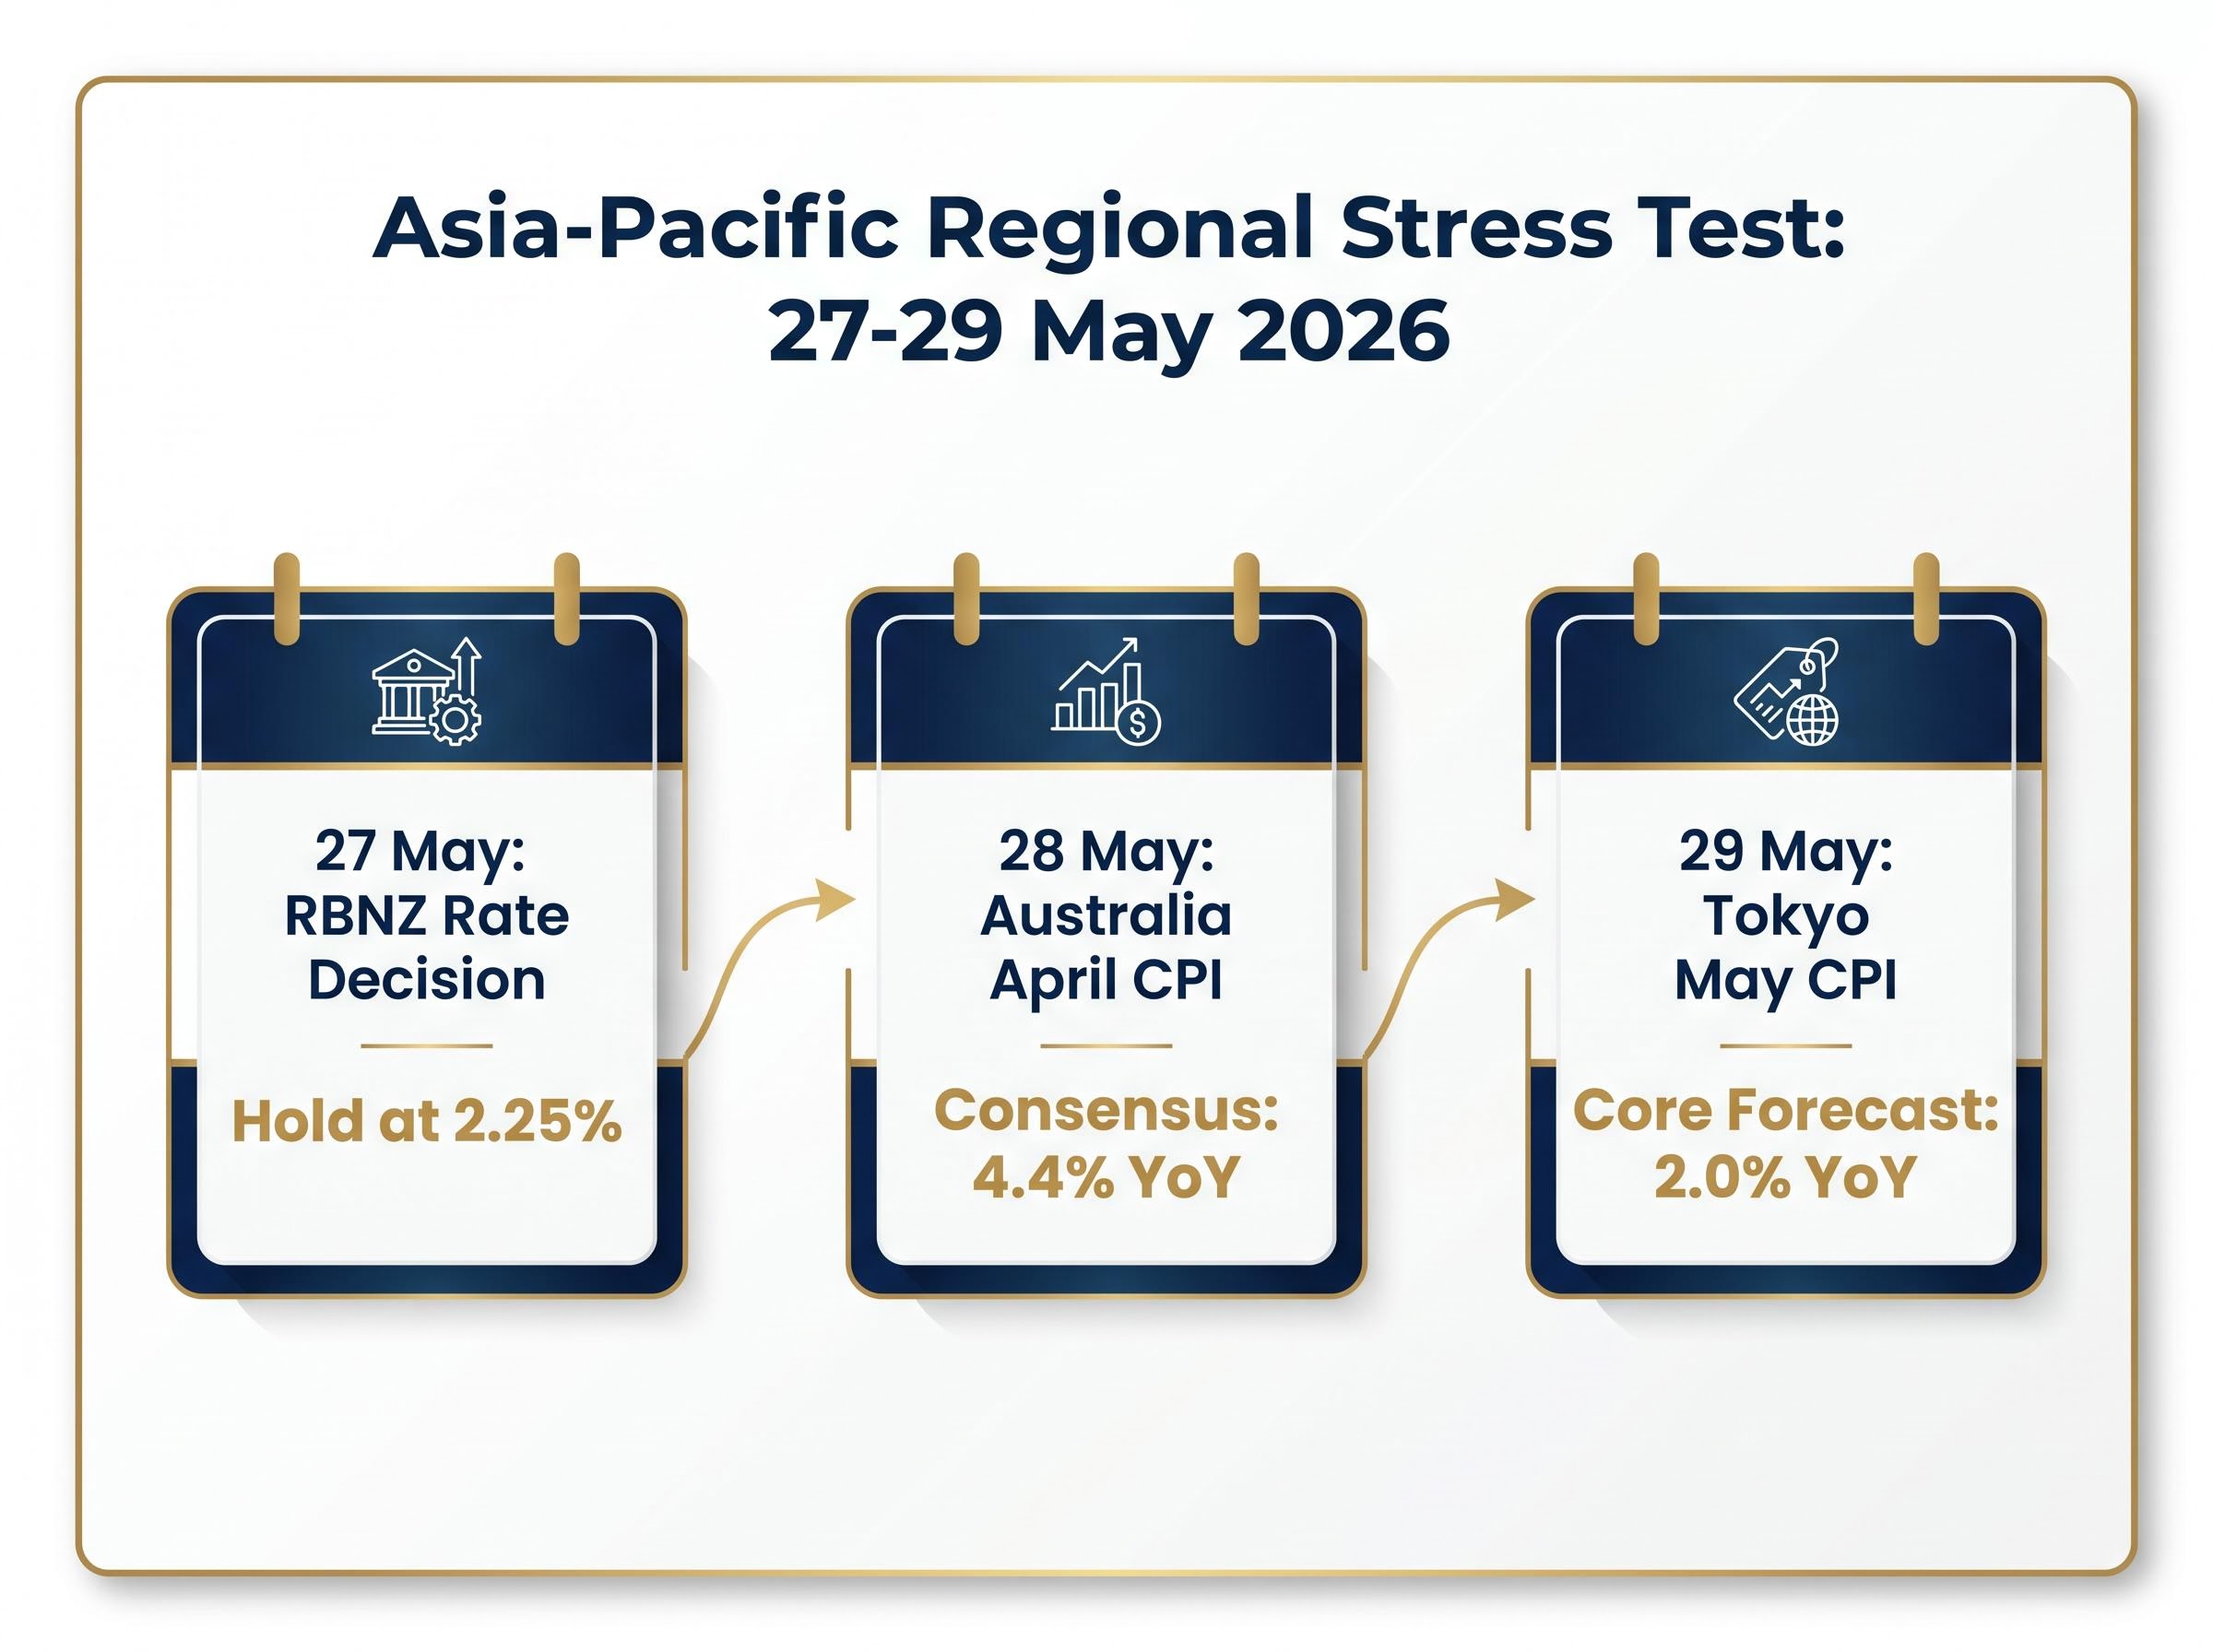
Anchoring figure: Reuters and Bloomberg consensus for Australia’s April CPI stands at 4.4% year-on-year, a reading that would keep the RBA firmly in “higher for longer” territory.
The cumulative signal from this week will either validate or complicate the rate-path forecasts that major banks have been pricing in across all three economies. For investors in AUD- or NZD-denominated assets, the event risk is concentrated, not dispersed.
Cross-regional inflation snapshots, where multiple major economies report price data within a single week, have historically provided a clearer signal about whether inflationary pressures are domestically driven or globally synchronised, a distinction that changes the policy prescription considerably and that the May 2026 data week will test directly.
The RBNZ’s Monetary Policy Committee voted unanimously to hold the Official Cash Rate at 2.25% at its 27 May 2026 meeting. New Zealand’s headline inflation remains at 3.1% year-on-year, above the 1-3% target band, and the unemployment rate unexpectedly declined to 5.3%.
On the surface, unanimity and a hold suggest a committee content to wait. The language underneath tells a different story.
The MPC Record of Meeting noted that “a few members” argued upside inflation risks justified discussing earlier rate increases later in 2026 if non-tradables inflation failed to ease. No member formally dissented, but multiple independent analysts read the language as directional rather than neutral.
ASB described the May Monetary Policy Statement as maintaining a “clear tightening bias,” arguing that “hawks remain influential inside the Committee even if they did not dissent on the OCR level.” BNZ went further, inferring that “at least one Committee member is clearly leaning towards earlier hikes” based on the strengthened tightening language and upgraded near-term inflation track. Kiwibank placed roughly a 40% probability on a 25 basis point OCR increase by November 2026 if inflation does not fall back within the target band.
Governor Adrian Orr stated the Committee was “prepared to raise the OCR further if inflation persistence proves greater than anticipated.”
For NZD asset holders, the distinction between a genuinely neutral hold and a hold with an embedded tightening bias matters directly. Duration exposure and currency positioning carry different risk profiles depending on which reading proves correct.
A single monthly CPI release does not usually shift multiple banks’ full-year rate-path forecasts. This one arrives at a moment when several already have.
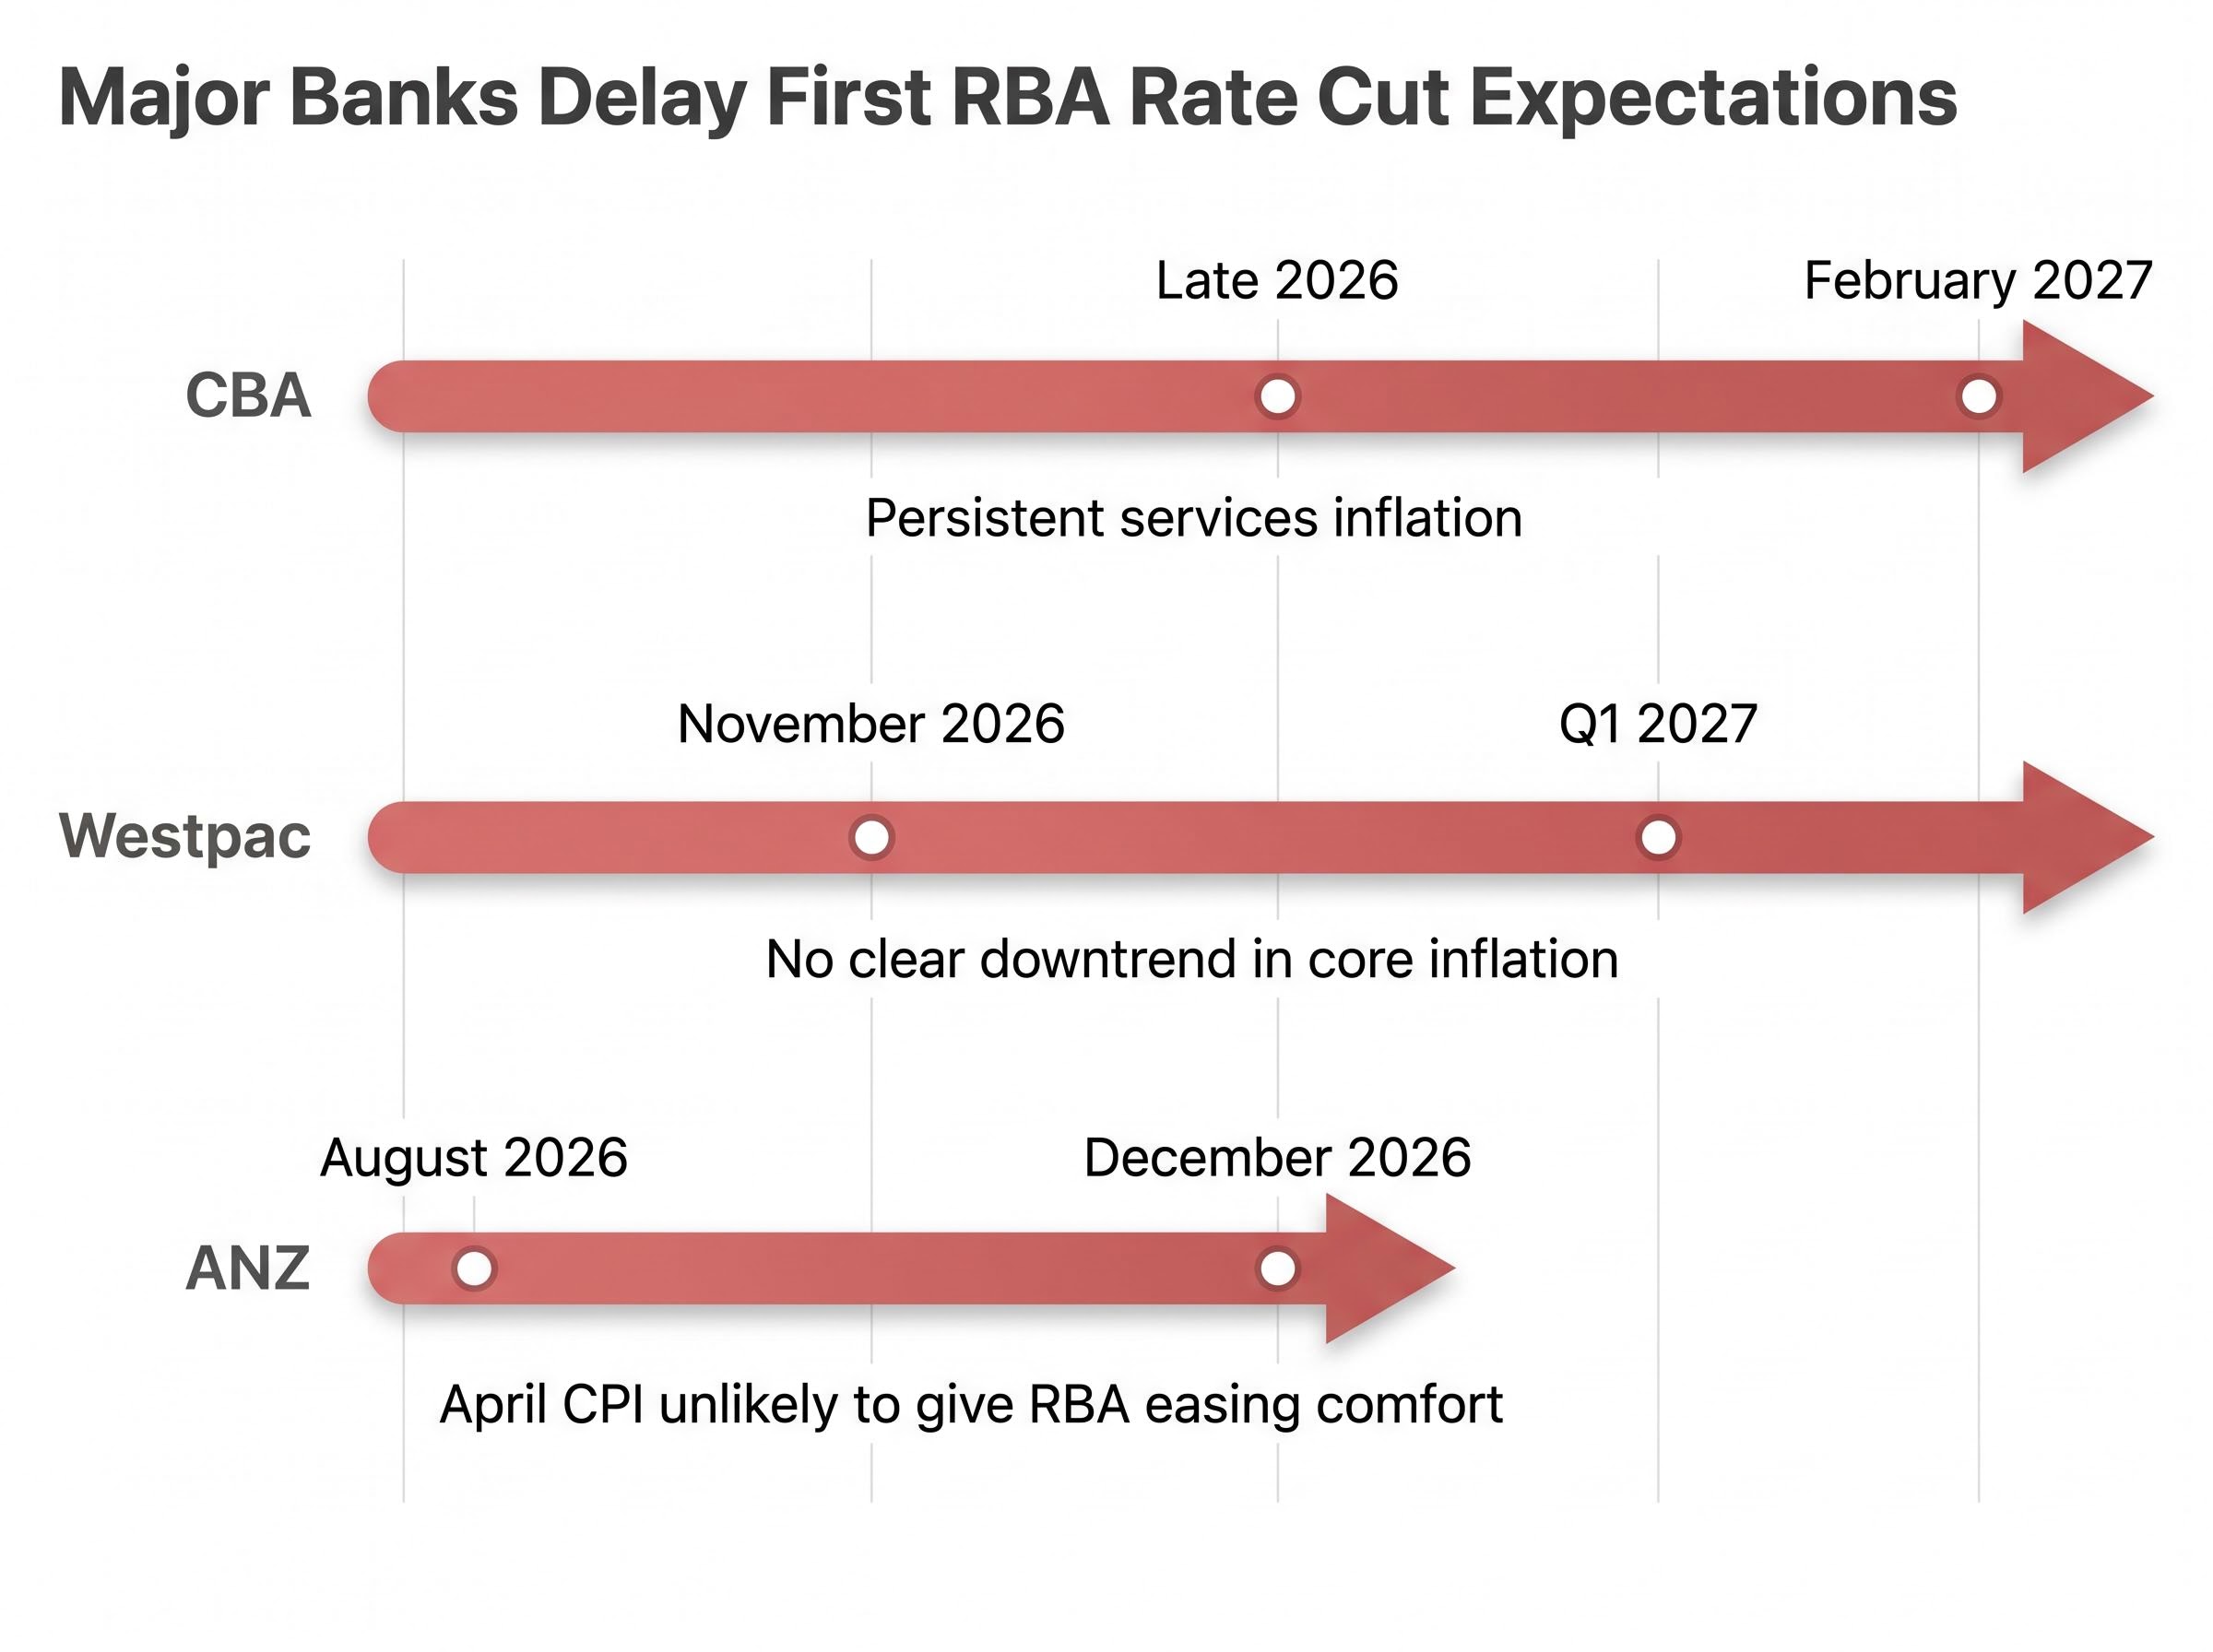
Over the past month, three of Australia’s four major banks have pushed out their expected timing for the first RBA rate cut. The April CPI (forecast at 4.4% year-on-year) is not triggering these revisions; it is arriving into an environment where they have already occurred, meaning an upside surprise would accelerate an existing shift rather than start a new one.
The headline and underlying inflation divergence that shaped the RBA’s May 2026 decision, with a 4.6% headline sitting well above a 3.3% trimmed mean, is the same interpretive tension that will define how the April CPI print is read: a single number that can simultaneously support a hold and keep a hike on the table.
| Institution | Previous first-cut forecast | Revised first-cut forecast | Key condition cited |
|---|---|---|---|
| CBA | Late 2026 | February 2027 | Persistent services inflation |
| Westpac | November 2026 | Q1 2027 | No clear downtrend in core inflation |
| ANZ | August 2026 | December 2026 | April CPI unlikely to give RBA easing comfort |
The spectrum of conviction is wide. ANZ still sees a cut in December 2026 as its base case, while CBA and Westpac have both moved into 2027. What unites them is the direction of revision: later, not sooner.
Goldman Sachs maintains a 15% risk scenario for a 25 basis point hike in August 2026 if April and May CPI prints surprise to the upside. This aligns with the approximately 20% market-implied probability reflected in Bloomberg and Reuters OIS and futures pricing.
The RBA’s cash rate sits at 4.35%. A 4.4% headline print meeting consensus will likely confirm the extended-hold view. A reading at or above 4.5% could meaningfully shift the August hike probability and reprice AUD rates in short order.
Both Australia and New Zealand share above-target inflation and a broad disinflation trend. The similarity ends there. The underlying drivers are materially different, which is why the same headline rate does not imply the same policy prescription.
Australia’s inflation persistence is concentrated in housing rents, energy pass-through, and administered prices. The RBA’s Statement on Monetary Policy (May 2026) identifies services, housing rents, and insurance as the primary contributors. NAB notes that energy price pass-through has been more pronounced in Australia due to regulatory settings and network costs.
New Zealand’s profile is different. The RBNZ’s Monetary Policy Statement describes domestic inflation as “broad-based,” with sharper increases in construction and housing costs. ANZ Research characterises NZ’s inflation as “more skewed to domestic services and government-related charges,” while NAB points to food and construction as larger contributors relative to Australia.
The migration dynamic separates the two economies most sharply. Australia’s high net migration is keeping rental inflation elevated in a way that New Zealand, which experienced an earlier housing downturn and applied tighter macro-prudential measures, has not replicated.
Wage dynamics diverge in parallel. Westpac NZ describes New Zealand’s wage growth as “slower to turn” due to indexation and sector agreements, while Australia’s wages have been moderated by migration-driven labour supply. The implication, according to Westpac NZ, is that New Zealand may need a relatively higher real OCR to tame non-tradables inflation, whereas Australia’s challenge lies more in housing and administered prices.
| Factor | Australia | New Zealand |
|---|---|---|
| Primary inflation drivers | Housing rents, energy, services | Non-tradables, wages, housing construction |
| Migration influence | High net migration elevating rents | Earlier housing downturn; macro-prudential constraints |
| Wage dynamics | Migration-driven supply moderating growth | Indexation keeping growth stickier |
| Energy pass-through | More pronounced (regulatory and network costs) | Less dominant; food and construction larger |
| Policy rate | 4.35% cash rate | 2.25% OCR |
Understanding the structural source of inflation in each economy clarifies why two central banks facing similar headline numbers are not facing the same problem and are unlikely to move in lockstep.
The BIS analysis of inflation persistence in services-heavy economies identifies administered prices and housing costs as the components most resistant to conventional monetary tightening, a finding that maps directly onto the structural challenges facing both the RBA and RBNZ as they weigh their next policy moves.
Tokyo’s CPI functions as a leading indicator for Japan’s national inflation print. The capital-city data releases roughly three weeks ahead of the nationwide figure, and consistently tracks national trends. That makes the 29 May release directly relevant to Bank of Japan rate-hike timing.
The Reuters poll median forecasts Tokyo core CPI (excluding fresh food) at 2.0% year-on-year for May, with core-core (excluding fresh food and energy) at approximately 2.2%. The Nikkei/QUICK survey places headline near 1.9% year-on-year. Both readings sit at or near the BoJ’s 2% target, a threshold level for the next policy move.
Three conditions need to align before the BoJ hikes again:
Japan’s private-sector growth momentum in Q1 2026, with GDP expanding at a 2.1% annualised rate driven by exports and consumption rather than government spending, is the economic backdrop against which the BoJ is calibrating its normalisation timeline; sustained private demand growth is one of the conditions that would give the Committee the confidence to move rates higher even if Tokyo CPI prints only at the 2% threshold.
According to Nikkei Asia, citing unnamed BoJ officials, the next possible hike window is contingent on Tokyo CPI “staying around 2% and evidence that wage inflation is broadening.”
A stronger-than-expected Tokyo print would solidify hike expectations for the next BoJ meeting. A miss would support caution and weigh on the yen. For internationally minded investors, this reading closes the week’s data sequence and either opens or narrows the BoJ’s next hike window, with direct implications for yen-denominated assets and cross-currency flows.
The three central bank positions, taken together, sketch a regional characterisation: higher for longer, but unevenly distributed.
The base case is straightforward. Australian CPI comes in at 4.4%, confirming extended hold expectations. The RBNZ hold is already confirmed. Tokyo CPI prints at 2.0%, keeping the BoJ on its cautious normalisation path. Under this scenario, rate-path forecasts remain where they are and positions sized for “higher for longer” continue to carry.
The tail risk is a compounding upside scenario. If Australian CPI lands at or above 4.5%, NZ non-tradables show no easing, and Tokyo CPI surprises above 2.0%, the combined signal shifts the “higher for longer” probability distribution across all three economies simultaneously. Goldman Sachs’s 15% August hike scenario for the RBA becomes harder to dismiss. Kiwibank’s 40% November hike probability for the RBNZ looks conservative. The BoJ’s next hike window narrows.
Each print updates probabilities rather than resolving them. The asymmetry, however, is worth noting: in an already “higher for longer” consensus environment, upside CPI surprises are more likely to reprice rates markets than downside misses.
The Asia-Pacific inflation story in mid-2026 is not one of convergence toward target. It is one of persistent, structurally embedded price pressures that differ in composition between economies but share a common feature: they are above target and slow to resolve.
The week’s data events connect back to that longer structural argument. Australia’s rents and energy costs, New Zealand’s non-tradables and indexed wages, Japan’s cautious wage-price cycle: different engines, different timelines, but a shared direction. Central banks across the region will remain on guard well into 2027.
The next milestones to watch after this week include Australia’s May monthly CPI (expected late June), New Zealand’s Q2 CPI release, and the Bank of Japan’s next scheduled policy meeting. Each will test whether the “higher for longer” consensus that this week’s data is expected to reinforce remains intact, or whether the structural pressures prove even more stubborn than markets have priced.
For investors wanting to understand how currency markets have already been pricing the inflation and rate divergence story ahead of this week’s data, our deep-dive into AUD/USD reaction to inflation surprises covers the three structural forces that compressed the pair by 98 pips in mid-May 2026, with specific technical levels that will be retested if the April CPI print lands above consensus.
This article is for informational purposes only and should not be considered financial advice. Investors should conduct their own research and consult with financial professionals before making investment decisions. Financial projections and rate-path forecasts are subject to market conditions and various risk factors. Past performance does not guarantee future results.
Australia's inflation outlook remains elevated, with April CPI forecast at 4.4% year-on-year and major banks including CBA and Westpac pushing their first expected RBA rate cut into 2027. Markets are pricing roughly a 20% probability of a further rate hike in August 2026.
The Reserve Bank of New Zealand held its Official Cash Rate at 2.25% for a third consecutive meeting despite headline inflation sitting at 3.1%, above its 1-3% target band. The unanimous hold was accompanied by language signalling a tightening bias, with Kiwibank assigning a 40% probability to a rate increase by November 2026.
Australia's inflation is primarily driven by housing rents, energy pass-through, and administered prices, while New Zealand faces broader domestic inflation skewed toward non-tradables, construction costs, and indexed wages. These structural differences mean the two central banks are not facing the same problem despite similar headline rates.
Tokyo CPI functions as a leading indicator for Japan's national inflation print and is released roughly three weeks ahead of the nationwide figure. A core reading at or above 2% in May 2026 would support the case for further BoJ normalisation, provided it is accompanied by broadening wage growth across small and medium-sized firms.
The key tail risk is a compounding upside scenario where Australian CPI lands at or above 4.5%, New Zealand non-tradables show no easing, and Tokyo CPI surprises above 2.0%. This combination would simultaneously shift the probability distribution toward higher-for-longer across all three economies and could reprice short-dated rates markets materially.