
Dividends have contributed an average of approximately 33% of the S&P 500’s total return from 1940 to 2025, according to Hartford Funds. Yet most investors who hold dividend-paying stocks leave that return on the table by taking payouts as cash rather than systematically reinvesting them.
Passive income through dividends remains one of the most durable wealth-building ideas in personal finance. The strategy only compounds into meaningful wealth, however, when two disciplines work together: selecting stocks with sustainable payout ratios, and reinvesting every dividend payment to accelerate share accumulation. One without the other leaves money unrealised.
This guide covers the practical mechanics of both disciplines, including how to read payout ratios to distinguish safe dividends from traps, how reinvestment interacts with compounding over 20-30 year horizons, and how to structure a dividend-growth portfolio that builds passive income organically without active trading.
What the payout ratio actually tells you (and what it hides)
The payout ratio looks like one of the simplest numbers in investing. Divide the dividend per share by earnings per share, and the result tells you what percentage of profits a company returns to shareholders. A 50% ratio means half the earnings go out the door; the other half stays for reinvestment, debt reduction, or reserves.
That simplicity is misleading. A 75% payout ratio at a regulated utility with contractually stable cash flows signals a healthy, well-covered dividend. The same 75% at a consumer discretionary company with cyclical earnings and rising debt signals a payout under pressure. The number is identical; the risk is not. Without sector context, the ratio is a snapshot that can confirm a bias in either direction.
The payout ratio calculation sits within a broader framework of dividend total return mechanics: the share price falls by approximately the dividend amount on the ex-dividend date, meaning a high yield driven by a falling price is not a signal of generosity but of deteriorating fundamentals.
The ratio becomes genuinely useful when examined as a trend across three to five years of earnings history. A company whose ratio has crept from 40% to 70% over four years may be masking slowing earnings growth by maintaining dividend increases. A company holding steady at 55% while earnings grow is building headroom.
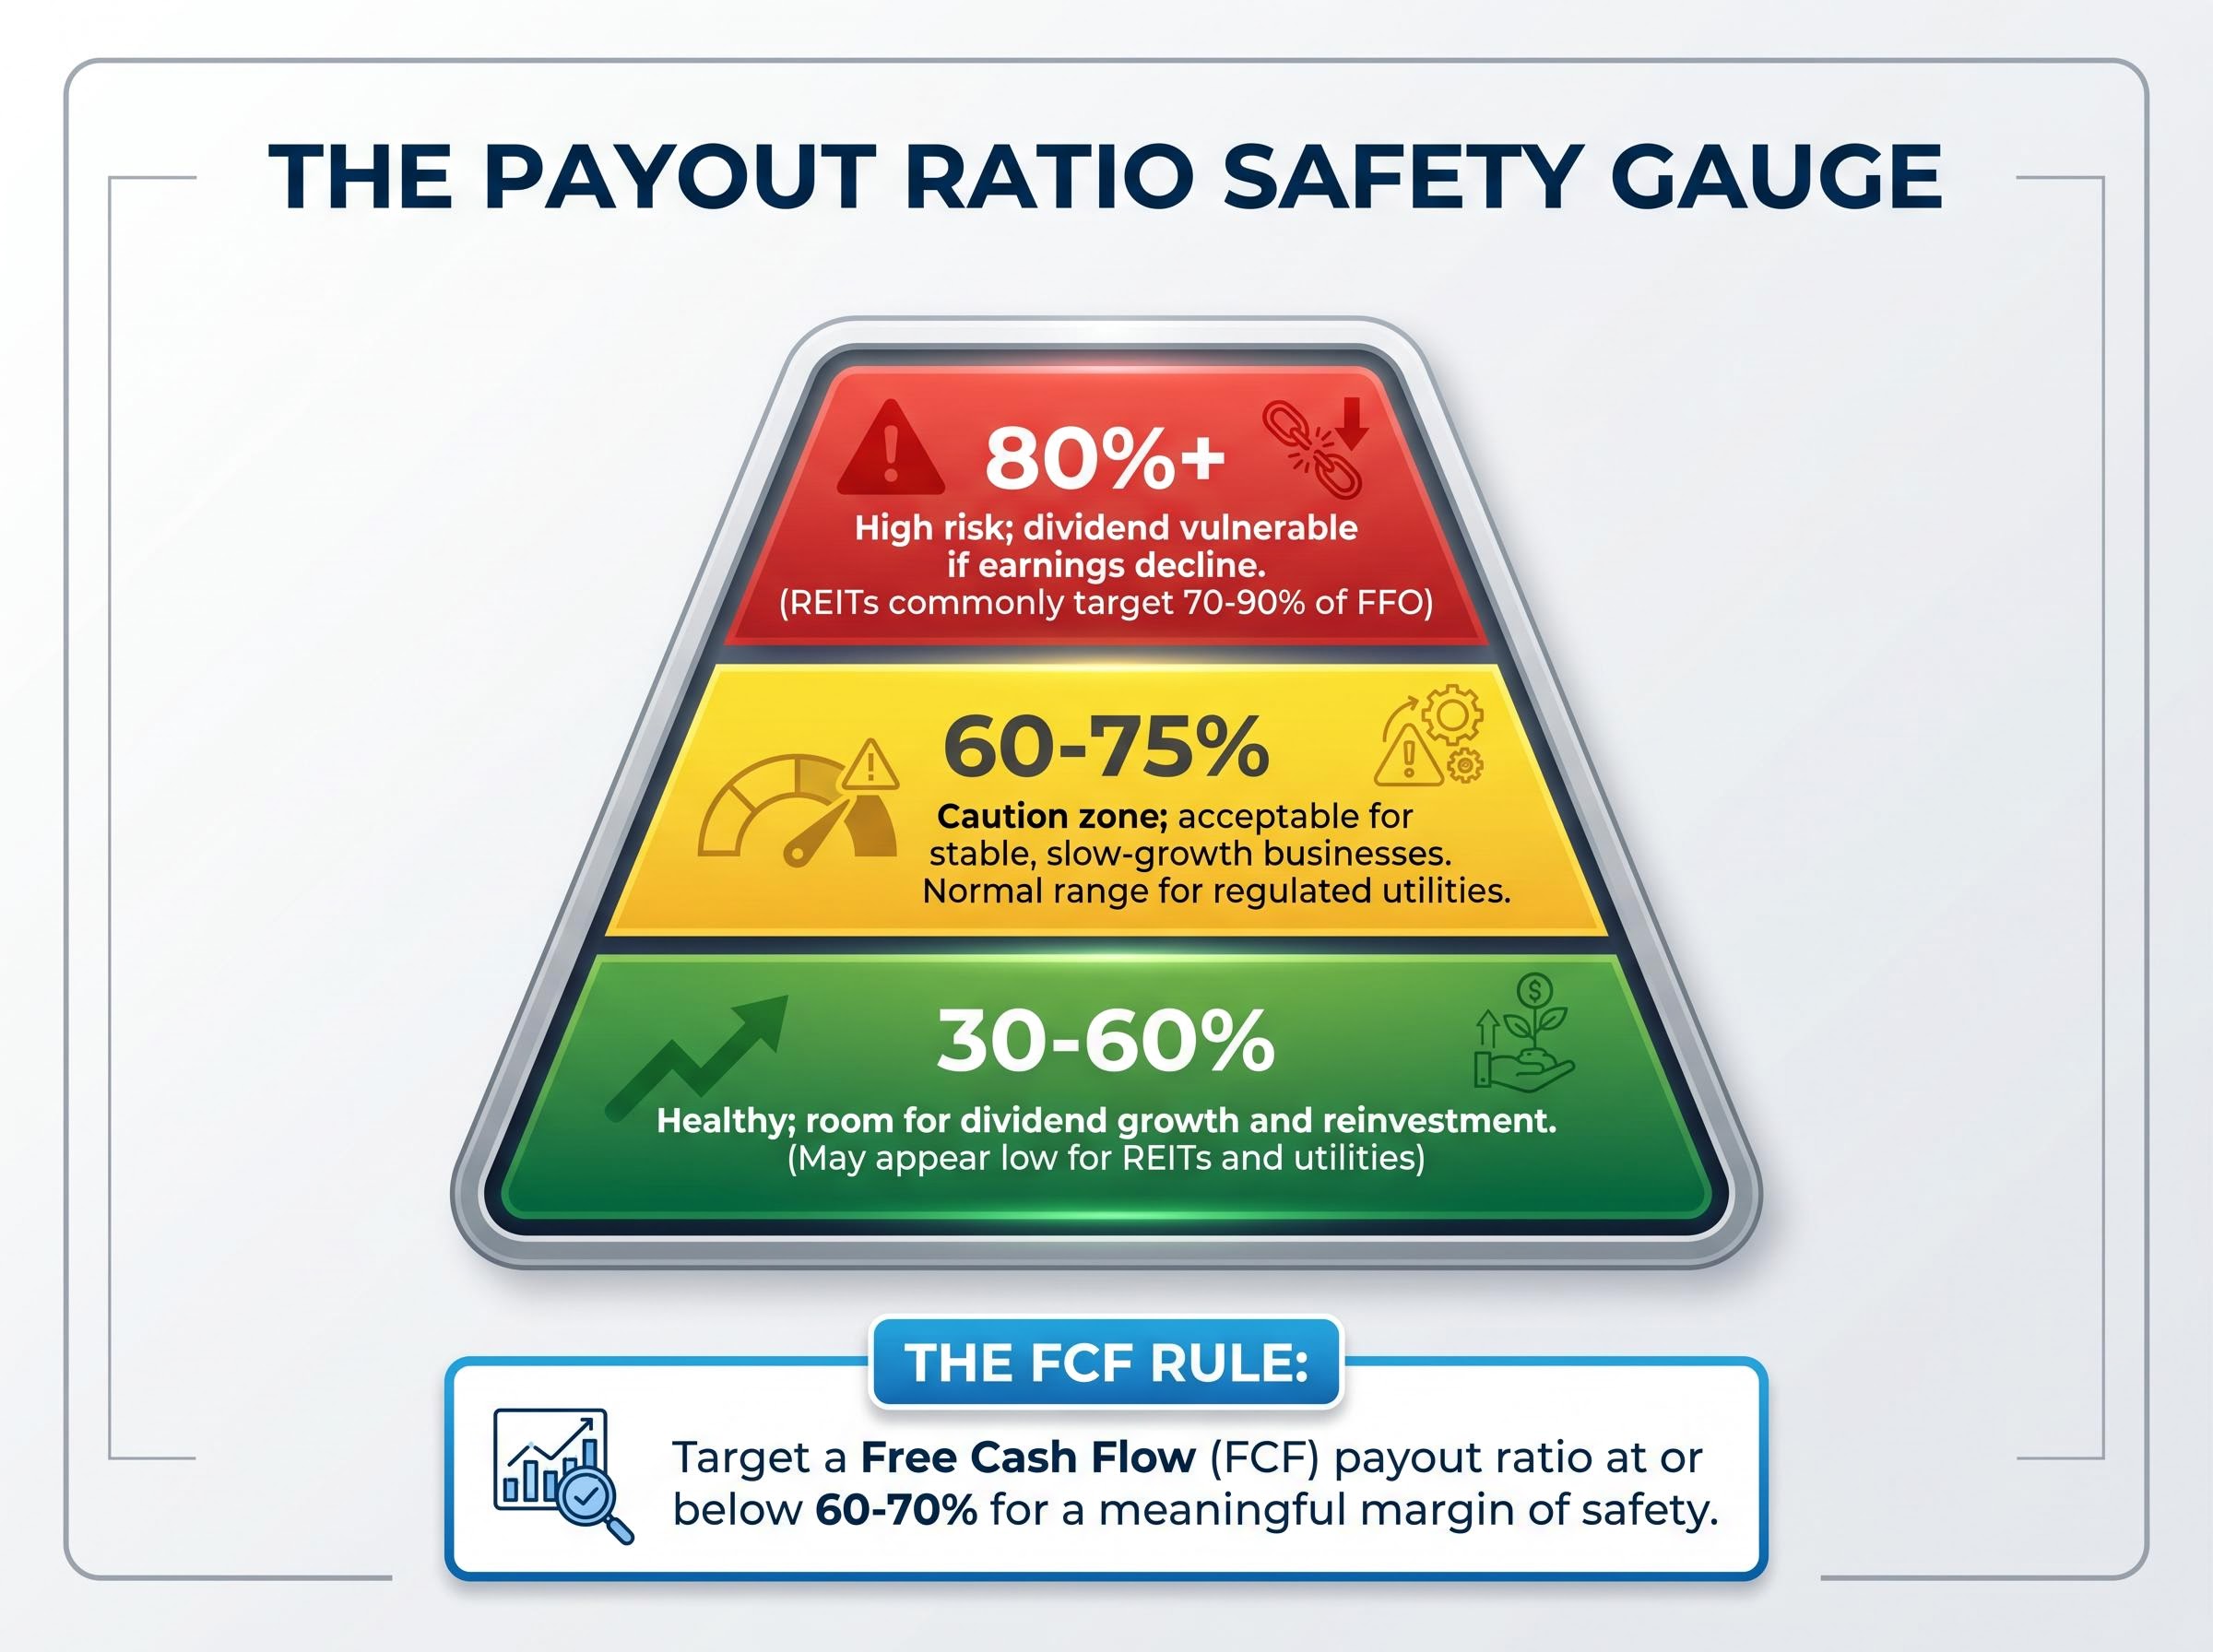
| Ratio Range | Signal for Most Companies | Sector Exceptions |
|---|---|---|
| 30-60% | Healthy; room for dividend growth and reinvestment | May appear low for REITs and utilities, which structurally pay more |
| 60-75% | Caution zone; acceptable for stable, slow-growth businesses but requires monitoring | Normal range for regulated utilities (60-75% of earnings) given stable regulated cash flows |
| 80%+ | High risk; dividend vulnerable if earnings decline | REITs commonly target 70-90% of funds from operations (FFO), a metric distinct from standard EPS |
Why free cash flow ratio matters more than earnings ratio
Earnings can be shaped by accounting choices: depreciation schedules, revenue recognition timing, and non-cash adjustments all influence the reported EPS figure. Free cash flow (FCF), the actual cash a business generates after capital expenditure, is harder to massage.
This distinction matters directly for dividend safety. A company showing a comfortable 60% earnings payout ratio but a 95% FCF payout ratio is a common profile in dividend trap situations. The earnings-based number looks safe; the cash-based number reveals the company is spending nearly all its available cash to maintain the payment. General guidance favours an FCF payout ratio at or below 60-70% of free cash flow for a meaningful margin of safety.
When big ASX news breaks, our subscribers know first
How to spot a dividend trap before it springs
A dividend trap begins with a number that looks generous. A yield of 8% or 9% on a regular corporation draws income-seeking investors precisely when the risk of a cut is highest. The mechanics are straightforward: the share price falls first as the market prices in deteriorating fundamentals, which pushes the calculated yield higher. The yield is not signalling generosity; it is reflecting fear.
“Yields above 7% often signal elevated risk rather than opportunity.” Morningstar, April 2024
The warning signs rarely appear in isolation. They cluster. An investor evaluating a high-yield position should look for the following red flags appearing together:
- Yield above 7-8% for regular corporations (outside REITs, master limited partnerships, and other structurally high-distribution vehicles)
- Payout ratio exceeding 100% of earnings, meaning the company pays out more than it earns
- FCF payout ratio exceeding 100%, meaning free cash flow does not cover the dividend
- Negative or highly volatile free cash flow trend over multiple quarters
- Rising leverage combined with credit-rating downgrades
- Yield far above sector peers: a utility yielding 6% when comparable names yield 3-4% signals distress, not value
The causal chain matters. Earnings deteriorate first. The share price falls in response. The yield spikes as a mathematical consequence. Investors who screen for high yield without checking the underlying fundamentals enter the trap at precisely the wrong moment.
The high-dividend safe-haven narrative — the idea that income-generating stocks offer downside protection in volatile markets — was stress-tested in early 2026, when the MSCI World High-Dividend Yield Index lagged the broader market recovery after initially falling in line with it, reinforcing why payout sustainability rather than yield magnitude is the more durable quality filter.
VF Corporation provides a concrete example. The company had maintained 25-plus consecutive years of dividend increases, qualifying it as an S&P 500 Dividend Aristocrat. It cut its dividend in February 2023 and was subsequently removed from the Aristocrats index at the 2024 rebalance. Decades of track record offered no protection once the underlying business fundamentals deteriorated. According to Investopedia (updated February 2025), examining at least five years of dividend and earnings history helps identify these deteriorating patterns before the cut arrives.
The mechanics of dividend reinvestment and why they matter
A dividend reinvestment plan (DRIP) is straightforward in its mechanics. When a company pays a dividend, the cash does not arrive in the investor’s account as spendable income. Instead, the payment automatically purchases additional fractional or whole shares of the same stock at the prevailing market price. Those newly acquired shares then generate their own dividends at the next payment date.
The compounding effect this produces requires two simultaneous inputs to fully accelerate. The first is the reinvested dividends steadily expanding the number of shares held. The second is the underlying company continuing to raise its per-share dividend each year. When both inputs are present, each reinvestment cycle buys shares that yield more per share than the previous cycle’s purchases did at the time they were made.
Most modern brokers and many companies offer DRIP programmes with no commission on reinvestment purchases. Once enabled, the process runs without intervention, making it genuinely passive after the initial setup.
What the long-run data shows
The evidence for reinvestment’s impact is consistent across multiple institutional sources. According to S&P Dow Jones Indices (2024), over the 1993-2023 period (30 years), the S&P 500 price index trailed the total return index by a gap consistent with approximately 3-4 percentage points per year of extra return attributable to reinvested dividends.
Hartford Funds (2026 update, data through December 2025) reported that dividends contributed an average of approximately 33% of the S&P 500’s total return from 1940 to 2025. That contribution rose during decades of muted price appreciation, meaning reinvestment was particularly valuable when capital gains alone delivered less.
The Hartford Funds dividend reinvestment research extends this finding further, reporting that going back to 1960, 85% of the cumulative total return of the S&P 500 can be attributed to reinvested dividends and the power of compounding — a figure that underscores how much of long-run wealth creation originates from the reinvestment decision rather than price appreciation alone.
Research from Vanguard (April 2024) confirmed that this reinvestment advantage holds in global equity portfolios, not only US markets. The directional finding is well-supported: reinvesting investors end with substantially larger portfolios than cash-taking investors over 29-30 year windows. The precise multiples vary by time period and methodology, but the gap is consistent and material.
A 3-4 percentage point annual return advantage sounds modest in any single year. Over 30 years, the exponential nature of compounding transforms that gap into a substantial wealth difference.
How dividend-growth rate compounds your income, not just your wealth
Most dividend investors focus on total portfolio value. The more useful frame, particularly for those building toward financial independence, is income stream growth. A dividend-growth investor is constructing an income engine whose annual output rises every year without any new capital being deployed.
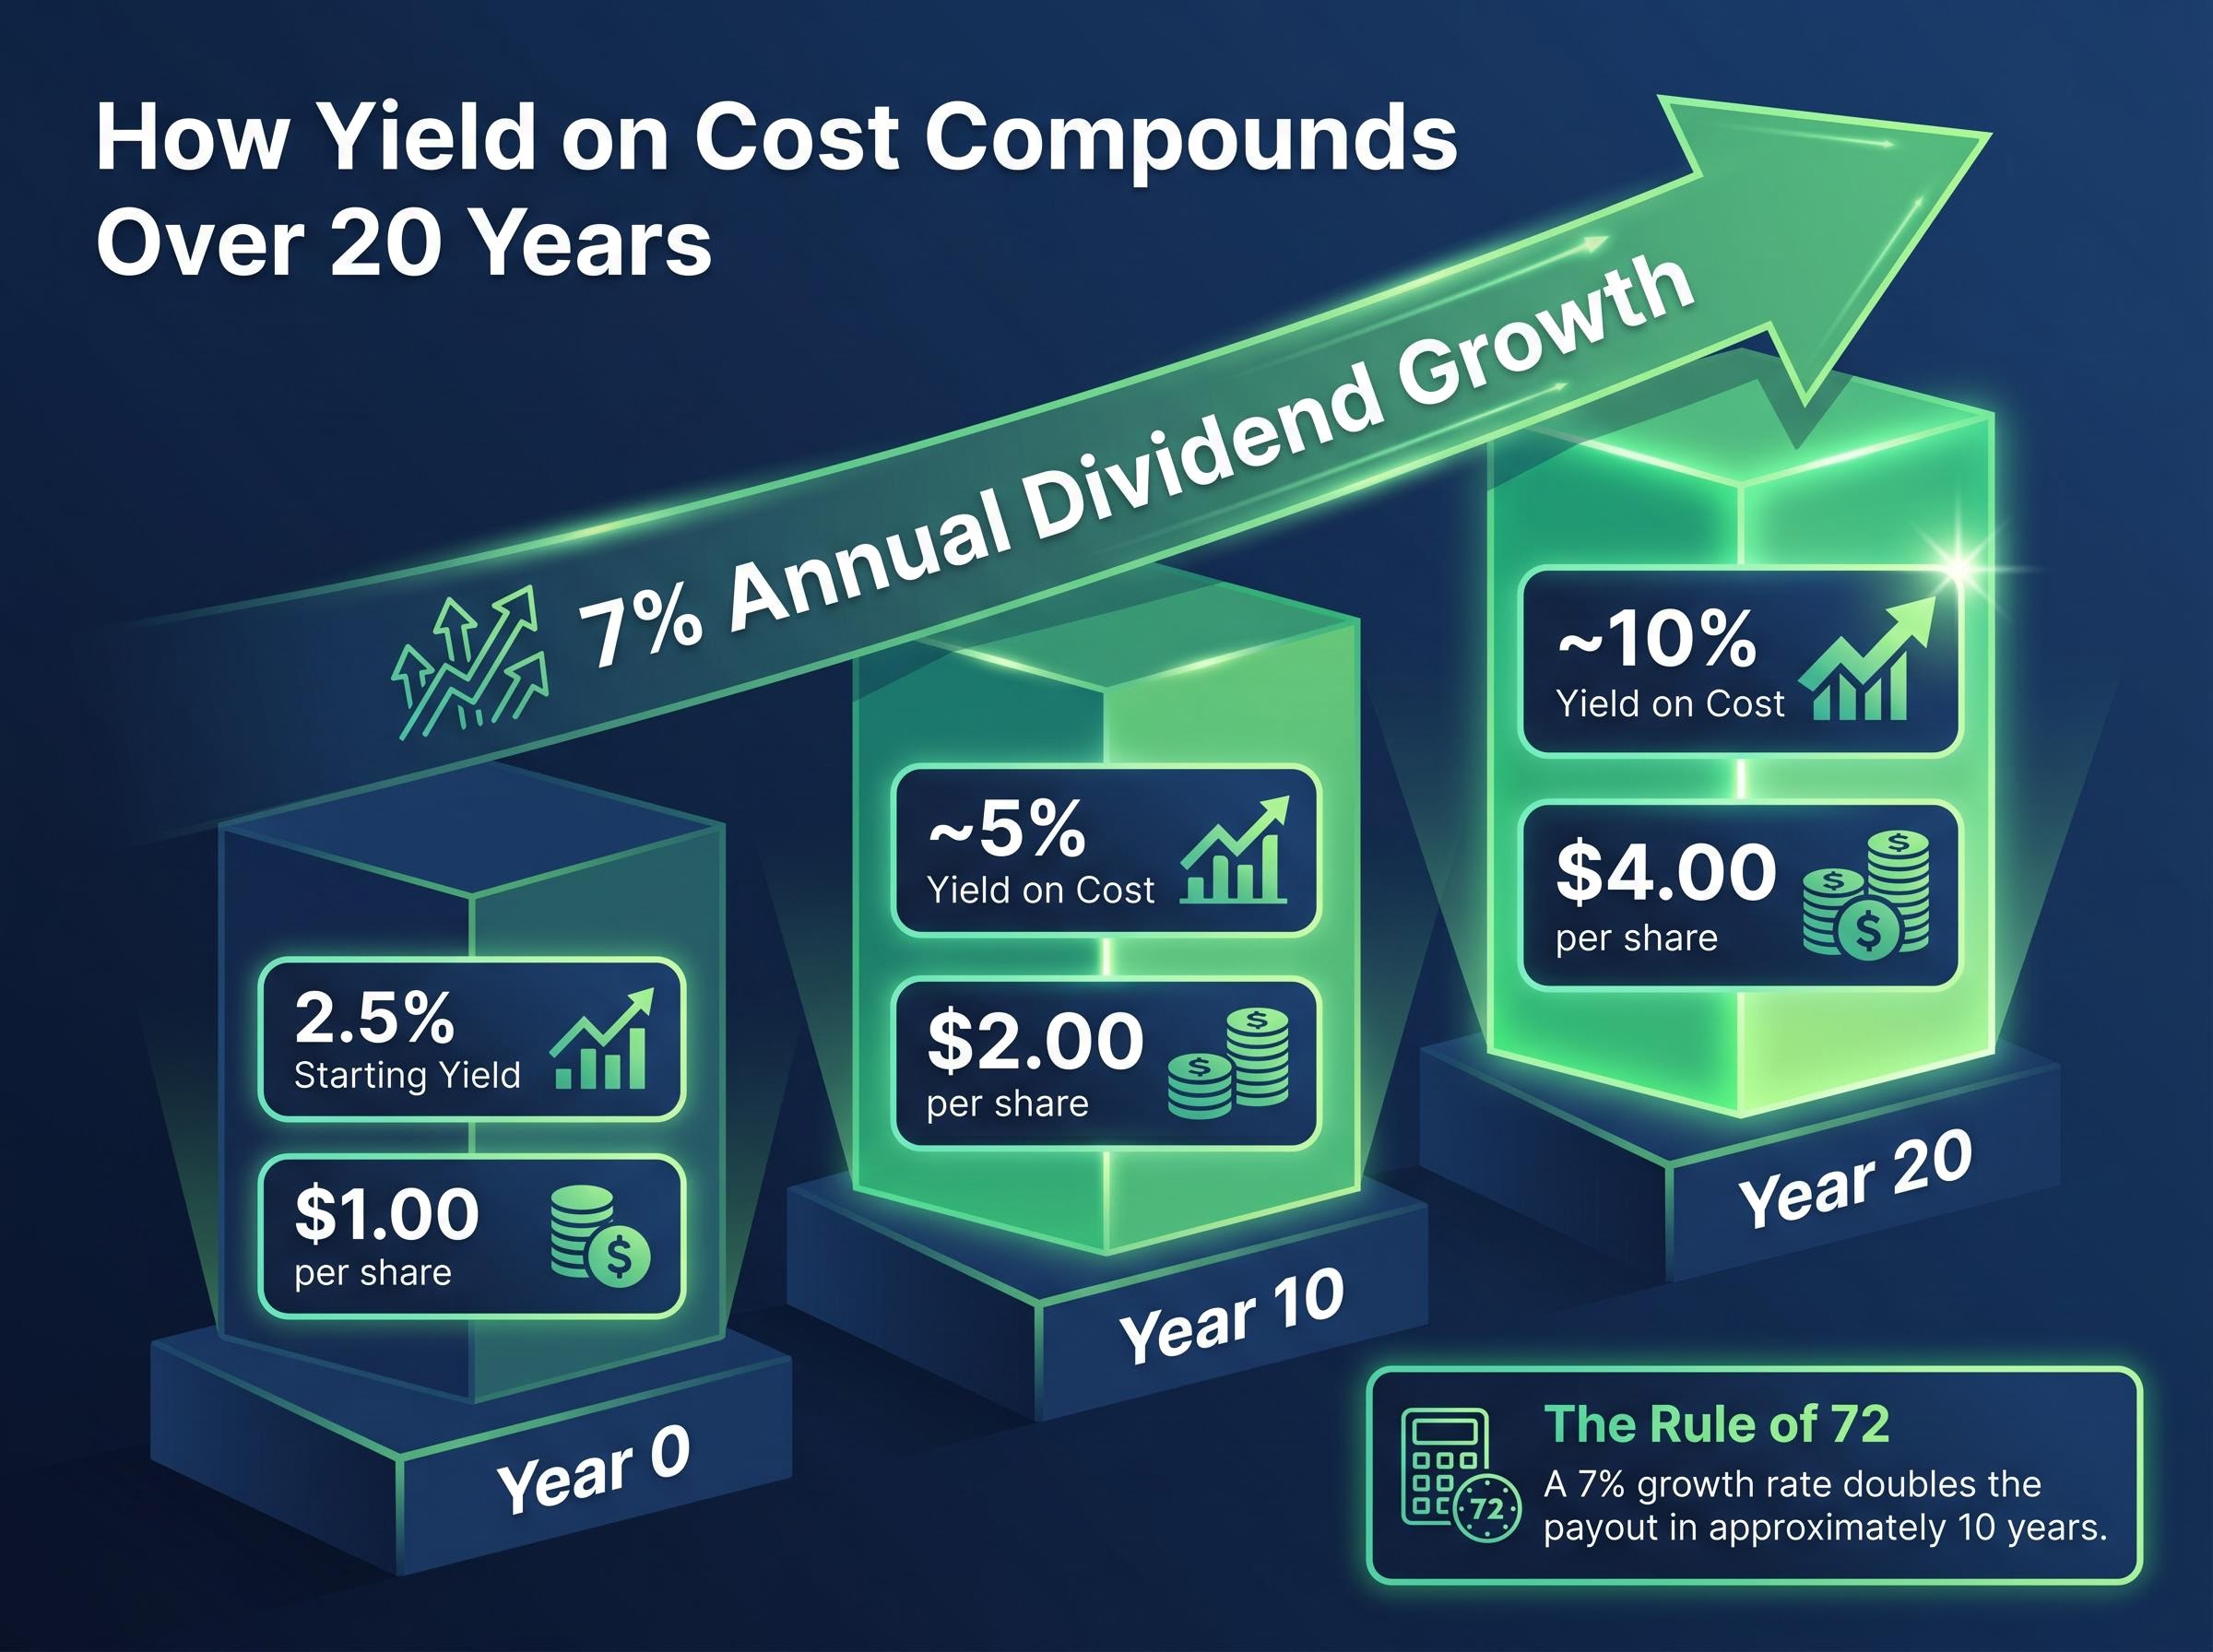
The concept that makes this visible is yield on cost. When an investor purchases a stock yielding 2% and the company raises its dividend at 7% annually, the effective yield on the original purchase price grows each year, even as the current market yield remains modest. After a decade, the per-share payout has roughly doubled (applying the rule of 72: a 7% growth rate doubles the payout in approximately 10 years). After two decades, the income from that original position bears little resemblance to the starting yield.
A simple yield-on-cost illustration:
- Year 0: Purchase at a 2.5% starting yield. Annual dividend per share: $1.00
- Year 10: At 7% annual dividend growth, the per-share payout has approximately doubled to $2.00. Yield on original cost: approximately 5%
- Year 20: A second doubling cycle brings the per-share payout to approximately $4.00. Yield on original cost: approximately 10%
This progression connects directly to payout ratio discipline. According to Morningstar (February 2024), companies with payout ratios “well below 60%” have “room to grow dividends while maintaining safety.” A lower starting payout ratio provides the structural capacity to sustain high dividend-growth rates for longer without straining cash flows.
For readers building toward financial independence rather than just portfolio growth, our dedicated guide to living off dividends works through the capital requirements at various portfolio yield levels, including why a standard S&P 500 portfolio at its current yield requires several million dollars to replace a typical household income, and how Social Security or pension income changes that calculation materially.
Companies with payout ratios “well below 60%” have “room to grow dividends while maintaining safety.” Morningstar, February 2024
Recent additions to the S&P 500 Dividend Aristocrats at the January 2024 rebalance, including Cintas Corporation (CTAS), Nordson Corporation (NDSN), and West Pharmaceutical Services (WST), illustrate the kind of companies that sustain this growth discipline long enough to qualify. Target Corp (TGT) announced its 52nd consecutive annual dividend increase in 2023, demonstrating that dividend-growth streaks can extend well beyond the Aristocrat threshold when the underlying business supports them.
How to screen and structure a dividend-growth portfolio
The analytical framework from the preceding sections translates into a repeatable screening sequence. Rather than starting with the highest-yielding names, the process works from quality filters inward:
- Start with yield relative to sector peers. A yield moderately above the sector average suggests a reasonable income starting point. A yield dramatically above peers warrants the trap-identification analysis covered earlier.
- Apply payout ratio thresholds. For most non-REIT, non-utility companies, target an earnings-based payout ratio of 30-60%. For utilities, 60-75% is acceptable. For REITs, evaluate against 70-90% of FFO.
- Check free cash flow coverage. The FCF payout ratio should sit at or below 60-70% to provide a meaningful margin of safety.
- Review at least five years of dividend and earnings history. According to Investopedia (updated February 2025), this timeframe helps identify deteriorating patterns. Look for a stable or rising earnings trend alongside consistent dividend increases.
- Verify management commitment. As Barron’s (May 2024) noted, a sustainable high-yield profile includes management explicitly committed to the dividend in recent communications, combined with strong interest coverage and a history of maintaining payouts through at least one recession.
The Dividend Aristocrats index (25-plus consecutive years of S&P 500 dividend increases) and the Dividend Kings framework (50-plus consecutive years) provide pre-screened starting universes. Payout ratio and FCF analysis should still be applied to every name within those universes. 3M (MMM), for instance, completed its spin-off of Solventum in 2024 with a subsequent dividend adjustment, illustrating that even long-streak companies can create ambiguity around streak continuity through corporate actions.
Diversification and position sizing
Concentrating in a handful of high-yield names is a common construction error. According to Charles Schwab (March 2024), diversification across sectors reduces the risk that a single sector downturn simultaneously affects multiple positions.
Spreading holdings across consumer staples, utilities, healthcare, industrials, and financials builds a portfolio where no single sector’s weakness can materially disrupt the overall income stream. Concentrating in any single high-yield sector to maximise income introduces correlated risk that undermines the passive, low-maintenance character of the strategy.
The compounding timeline: what patient dividend investors actually experience
The wealth-building arc of dividend reinvestment unfolds in three distinct phases. Understanding what each phase looks and feels like helps investors maintain the discipline required to let compounding work.
- Accumulation phase (years 1-10). Reinvested dividends quietly add shares, but the incremental income feels modest. The portfolio’s dividend income grows, yet it remains a small fraction of the investor’s earned income. This phase tests patience because the visible results appear disproportionately small relative to the effort of selecting quality names and resisting the urge to spend payouts.
- Visibility phase (years 10-20). Dividend income becomes a noticeable cash-flow line. Yield on cost has climbed meaningfully above the starting yield. The compounded share base, combined with a decade of per-share dividend increases, begins producing annual income that feels real. Reinvestment at this stage accelerates noticeably because each quarterly payment buys more shares than the same payment would have a decade earlier.
- Income-dominance phase (years 20-30). The compounded share base and rising per-share payouts produce income that dwarfs the original investment’s yield. According to S&P Dow Jones Indices, the 3-4 percentage point annual return advantage from reinvestment over the 1993-2023 period compounds into a substantial wealth gap by the end of a 30-year window.
S&P Dow Jones data shows that the reinvestment advantage, approximately 3-4 percentage points of additional annual return, compounds into a substantial wealth gap over 30-year horizons.
Hartford Funds (2026 update) noted that the dividend contribution to total return rises during periods of muted price appreciation. This means reinvestment is most valuable precisely when markets feel least rewarding, a counterintuitive finding that reinforces the case for maintaining the discipline through flat or slow-growth environments. Research from both Morningstar (May 2024) and Vanguard (April 2024) supports the directional finding that reinvesting investors end with substantially larger portfolios than cash-taking investors over multi-decade windows.
The strategy requires patience and a deliberate decision not to spend dividends during the accumulation phase. This distinguishes it from approaches that prioritise current income from the outset. The two decisions that matter most, selecting companies with sustainable payout ratios and enabling automatic reinvestment, can both be implemented this week.
The strategy works, but only if the dividend actually survives
The two disciplines this guide covers are inseparable. Payout ratio assessment is the quality gate: it determines whether the dividend an investor is reinvesting will still exist in five, ten, or twenty years. Systematic reinvestment is the compounding engine: it transforms a modest yield into a growing income stream and a substantially larger portfolio over time. One without the other produces either safe dividends that never compound or aggressive reinvestment into payments that eventually get cut.
The most common failure mode in dividend investing is not choosing the wrong reinvestment platform. It is selecting a company that eventually cuts its dividend, resetting years of compounded share accumulation in a single announcement.
The practical sequence is direct. Screen for sustainable payout ratios and FCF coverage first. Enable DRIP second. Then let the compounding timeline do the work without active interference.
Investors wanting to stress-test the dividend-growth framework against a passive total market approach will find the comparison useful; backtested data shows a total market portfolio outpacing a dividend-focused one by over a percentage point annually, with the compounded wealth gap quantified on a $100,000 starting investment.
As an immediate next step, pull the payout ratio and FCF payout ratio for any dividend stock currently held or being considered, and check whether it falls within the sector-appropriate safe zone outlined above. It is a five-minute exercise that applies this guide’s framework directly.
This article is for informational purposes only and should not be considered financial advice. Investors should conduct their own research and consult with financial professionals before making investment decisions. Past performance does not guarantee future results.