What ASML’s High NA EUV Actually Does to Chip Manufacturing
1 hr ago

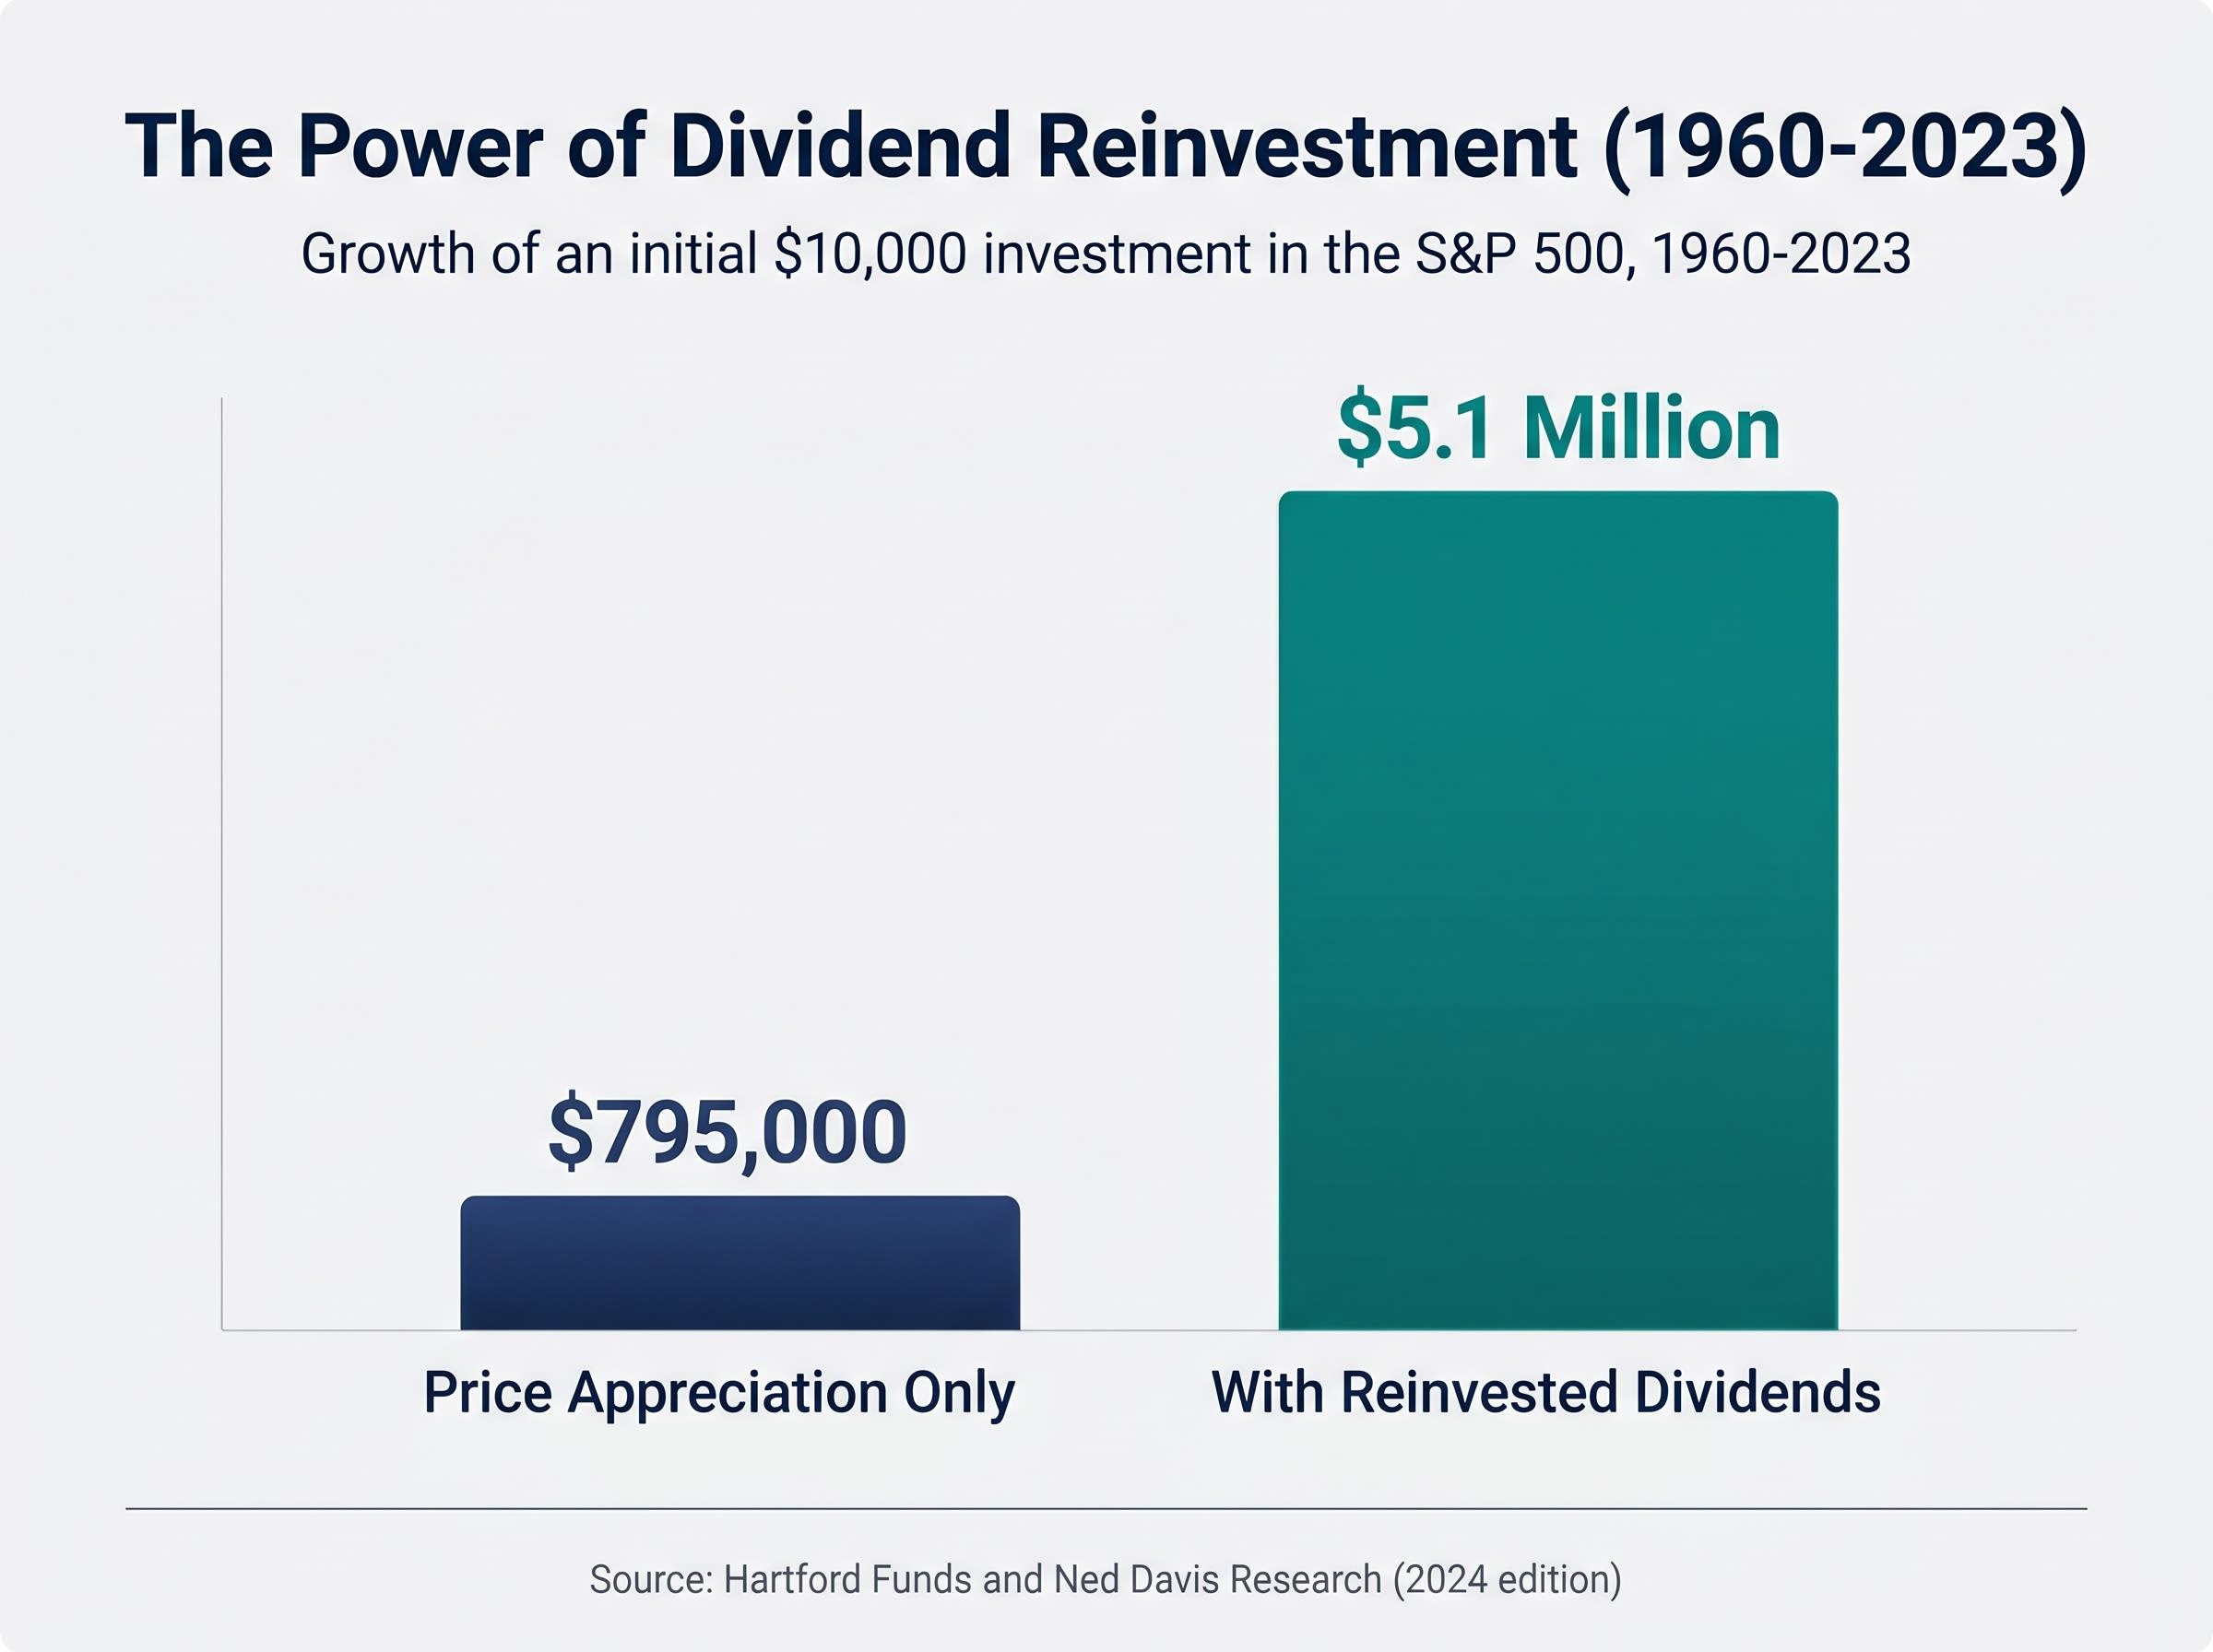
$10,000 invested in the S&P 500 in 1960 grew to approximately $5.1 million with dividends reinvested by the end of 2023. The same investment, relying on price appreciation alone, reached roughly $795,000. The difference is not stock-picking skill; it is the compounding logic of dividend reinvestment, applied over decades.
For income-focused investors, the quality of a dividend matters as much as its existence. Two mechanics determine whether a dividend investing strategy actually builds lasting passive income: whether the payout is financially sustainable, measured through payout ratio discipline, and whether reinvested distributions are left to compound through a dividend reinvestment plan (DRIP). These two principles are typically taught separately but are most powerful when understood as a system.
This guide covers how to read payout ratios as a signal of dividend health, how reinvestment compounding works mechanically, and how combining both disciplines creates a durable passive income engine over multi-decade holding periods.
A 7% yield looks generous until the company cuts it in half. Yield measures price-relative income, but it says nothing about whether the underlying business can actually support the distribution. The more diagnostic metric is the payout ratio: dividends paid divided by earnings, or more reliably, by free cash flow.
Yield measures price-relative income in isolation, which is precisely why dividend total return, combining price appreciation and reinvested distributions, is the more accurate benchmark for evaluating whether a dividend strategy is actually building wealth or merely redistributing it.
The broad S&P 500 carries a trailing 12-month payout ratio of approximately 38%, according to the S&P Dow Jones Indices factsheet dated 31 January 2025. The S&P 500 Dividend Aristocrats, a group of companies with at least 25 consecutive years of dividend increases, carry a payout ratio of 52% from the same source. The gap reflects a deliberate trade-off: Aristocrats pay out more of their earnings but maintain enough headroom to sustain those payments through cycles.
Morningstar equity strategist Susan Dziubinski, writing in February 2025, frames the thresholds as follows:
“When payout ratios push consistently above 75% without underlying earnings growth, dividend risk rises sharply.” — Fidelity Viewpoints, 13 November 2024
A low yield with a conservative payout ratio often signals a more durable long-run income position than a high yield with a stretched payout. Screening by payout ratio rather than yield alone shifts the focus from price-relative attractiveness to business-level sustainability.
A 75% payout ratio looks identical whether it belongs to a regulated utility or a cyclical manufacturer. It is not. Payout ratio thresholds must be interpreted relative to the earnings stability and capital structure of each sector.
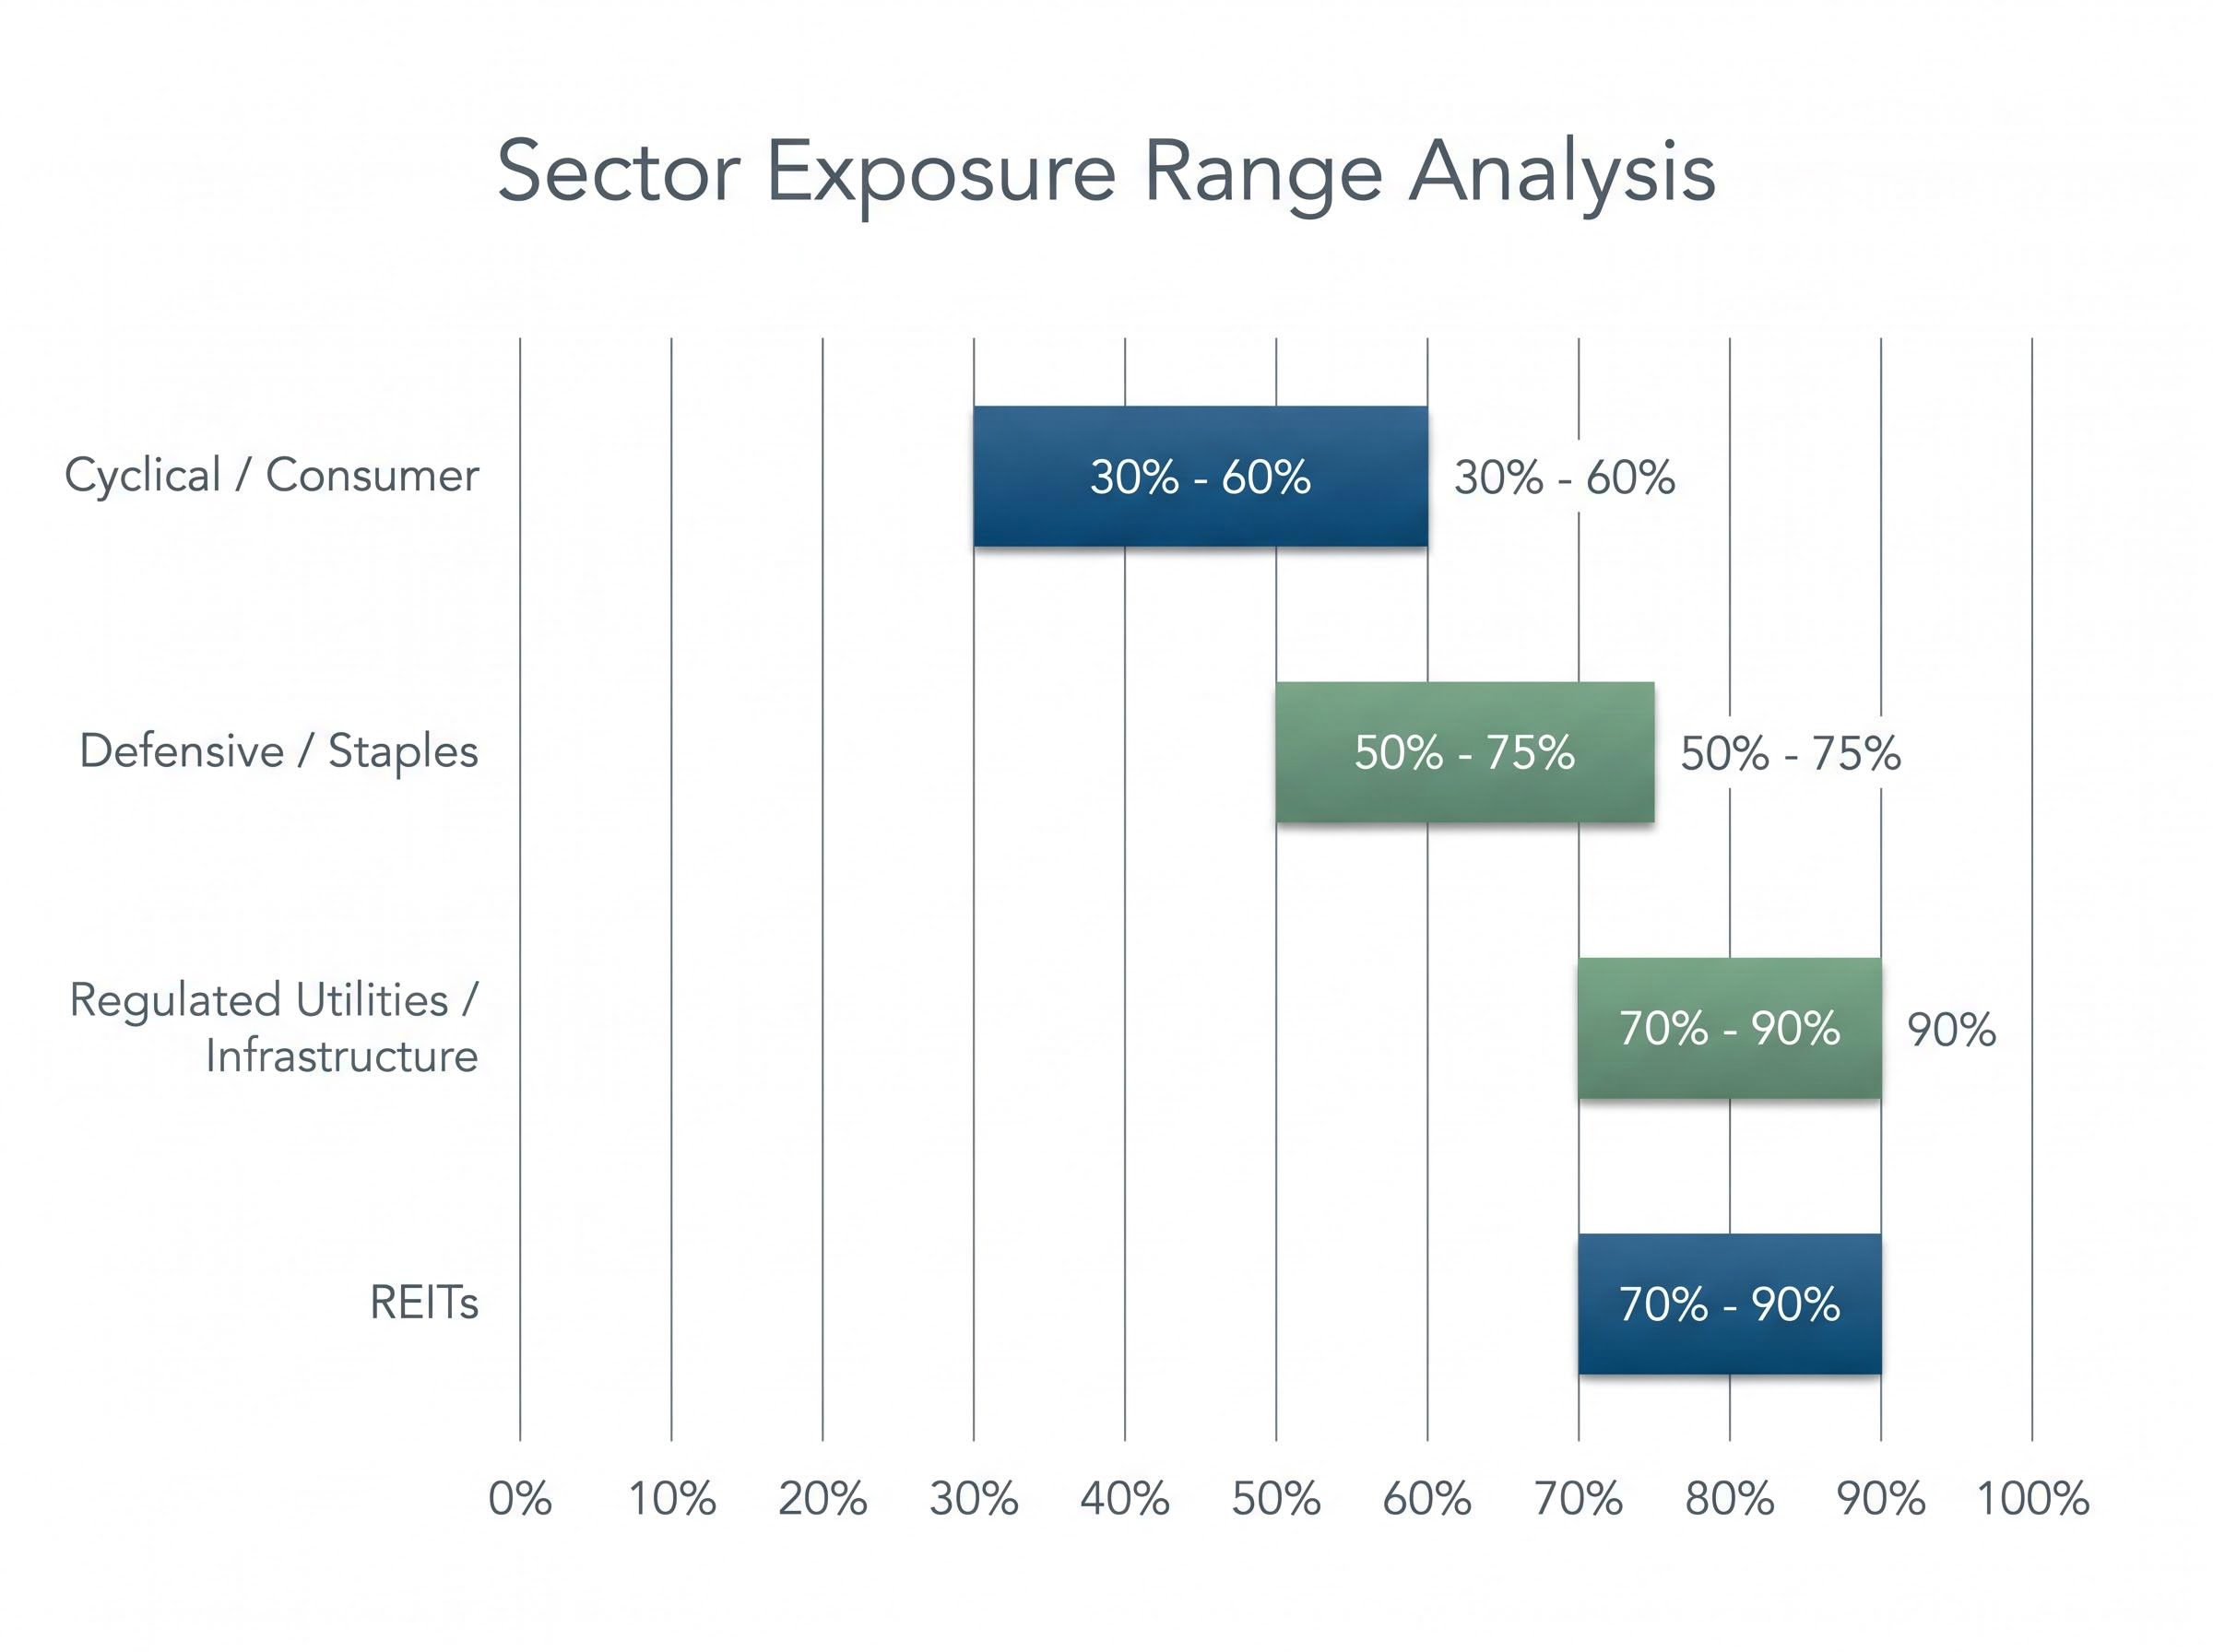
Schroders, in an October 2024 insight piece, identifies 40-60% as the “sweet spot” for global developed-market equities, with explicit carve-outs for utilities, infrastructure, and REITs at 70-90% given their regulated or contractual cash flows. JPMorgan’s Guide to the Markets for Q1 2025 reinforces this, noting that payout ratios materially above 70% have historically coincided with higher future cut or suspension risk during downturns. BlackRock’s Global Equity Income 2025 Outlook, published 16 January 2025, expresses a preference for firms in the 40-60% payout range with mid-single-digit to low-double-digit dividend growth backed by earnings rather than balance sheet stretch.
The free cash flow payout ratio is the more reliable metric across all sectors. Accounting earnings can be distorted by non-cash charges and one-time items, masking the true cash available to cover distributions.
| Sector Category | Sustainable Payout Range | Key Risk Factor | Representative Examples |
|---|---|---|---|
| Cyclical / Consumer | 30-60% | Earnings volatility during downturns | Industrials, consumer discretionary |
| Defensive / Staples | 50-75% | Margin compression from input costs | Consumer staples, healthcare, telecom |
| Regulated Utilities / Infrastructure | 70-90% | Regulatory changes to allowed returns | Electric utilities, toll roads, water |
| REITs | 70-90% | Occupancy and refinancing risk | Office, industrial, residential REITs |
Without sector context, a single payout number cannot distinguish a healthy distribution from a vulnerable one.
Abstract thresholds sharpen when measured against real portfolio consequences. Three high-profile dividend cuts in 2024 share a common pattern: payout ratios that climbed past sustainability before the announcement arrived.
A Morningstar analyst note on Walgreens, dated 5 January 2024, observed that the dividend was “no longer supported by underlying free cash flow.”
In each case, GAAP-based payout ratios obscured the deterioration that free cash flow analysis would have flagged earlier. The pattern is consistent: unsustainable payouts, left unaddressed through multiple reporting periods, precede the cut.
The high-yield safe haven narrative received a structural stress test in early 2026, when the MSCI World High-Dividend Yield Index fell approximately 7.6% peak to trough while the broader index recovered to all-time highs by mid-April, with lagging high-dividend holdings exposing the concentration risk that elevated payout ratios often mask.
The contrast is instructive. Johnson & Johnson announced its 62nd consecutive annual dividend increase in April 2024, with a payout ratio typically in the 40-60% range. Microsoft raised its quarterly dividend by 10% in September 2024 with a payout ratio near 30%. Nestlé approved its 29th consecutive increase at its April 2025 AGM with a payout ratio below 65%.
The S&P 500 Dividend Aristocrats currently carry 67 constituents, per the S&P Dow Jones Indices factsheet dated 31 January 2025, with a portfolio payout ratio of 52%. The index systematically tilts toward this conservative range, and the companies that remain in it are those whose payout discipline survived the cycle.
Compounding through dividend reinvestment is frequently cited but rarely explained mechanically. The sequence is straightforward, and understanding it clarifies why time horizon is the single most important variable.
When combined with companies that raise their per-share dividend annually, the effect accelerates: the investor holds more shares, and each share pays more. This dual compounding, rising share count and rising per-share payout, is structurally faster than reinvestment alone.
Hartford Funds and Ned Davis Research provide the most comprehensive long-run dataset on this effect, tracking S&P 500 total returns from 1960 through to the end of 2023 and attributing the substantial majority of cumulative gains to reinvested dividends rather than price appreciation alone.
Hartford Funds and Ned Davis Research (2024 edition) found that $10,000 invested in the S&P 500 in 1960 grew to approximately $5.1 million with dividends reinvested versus approximately $795,000 with price appreciation only, through to the end of 2023. Dividends and reinvested dividends contributed 69% of the S&P 500’s total return over that period.
JPMorgan’s Guide to the Markets for Q2 2024 reported an annualised total return of 10.2% with dividends reinvested versus 7.7% price-only over 1993-2023. Vanguard research, updated November 2024, found that for U.S. stocks from 1930-2023, reinvested dividends account for roughly 60% of total return, with the difference between reinvesting and spending dividends amounting to 2-3 percentage points per year in long-run compounded returns.
A dividend reinvestment plan (DRIP) automates this process at the broker level. Vanguard, Fidelity, and Schwab all offer automatic DRIP enrolment with fractional share support. Interactive Brokers extends DRIP availability to U.S., Canadian, and European securities.
The compounding mathematics assume every reinvested dollar stays invested. In a taxable account, that assumption breaks down. In most jurisdictions, reinvested dividends are taxable in the year received, even though no cash changes hands, creating annual tax drag that erodes the compounding advantage.
The solution is account structure. Each major geography offers tax-advantaged vehicles where DRIP compounding can operate without annual friction.
| Geography | Tax Treatment of Reinvested Dividends | Optimal Account Vehicle | Key Consideration |
|---|---|---|---|
| United States | Qualified dividends taxed at 0%, 15%, or 20% even when reinvested; each lot affects cost basis | IRAs, 401(k)s | Cost basis tracking complexity in taxable accounts |
| Canada | Eligible dividends receive a tax credit but remain taxable in non-registered accounts | RRSPs, TFSAs | TFSAs eliminate both income and capital gains tax on DRIP growth |
| United Kingdom | Dividends above the annual allowance are taxable even if reinvested | ISAs, SIPPs | Described as “usually the best place” for DRIP investors (Hargreaves Lansdown) |
| Australia | DRP shares included in assessable income at cash value in year received; franking credits remain attached | Superannuation funds | Superannuation offers concessional tax rates on dividend income |
For taxable accounts, the marginal benefit of automatic reinvestment versus selective reallocation to higher-growth opportunities should be weighed, particularly for high-yield, slow-growth payers. A DRIP in the wrong account type can turn a compounding engine into an annual tax event with accumulating cost basis complexity.
Payout ratio analysis and DRIP compounding are most powerful when operated as a sequential screening process, not as independent habits.
The combination addresses the two primary failure modes of dividend investing:
The implementation sequence follows four steps:
Professional dividend-growth managers operationalise this framework in practice. The Vanguard Dividend Growth Fund (VDIGX) carries a weighted-average payout ratio of 49%, per its fund profile dated 30 April 2025. The Schwab U.S. Dividend Equity ETF (SCHD) carries a payout ratio of 58%, per its fact sheet dated 31 March 2025. Both sit within the institutional consensus range, illustrating how the payout threshold translates into real portfolio construction.
ASIC’s MoneySmart guide describes dividend reinvestment plans as “a disciplined way to grow your investment,” with a caution to review company fundamentals periodically rather than maintaining DRIP into deteriorating businesses. That periodic review is the step that connects the two disciplines: payout ratio analysis is not a one-time screen but a recurring check that keeps the compounding engine running on sustainable fuel.
The discipline of systematic reinvestment is also why comparisons between total return vs dividend-only strategies tend to favour total return portfolios over sufficiently long periods, with backtested data from 2016-2025 showing a 10.49% annualised return for a total market approach against 9.43% for a dividend-focused equivalent, a gap that compounds to roughly $116,000 additional wealth on a $100,000 starting position over 20 years.
Both mechanics covered in this guide require time to express their full advantage. Conservative payout ratios give companies room to sustain distributions through recessions, rate cycles, and earnings compression. Reinvestment compounding requires long holding periods for the share accumulation effect to overtake short-term yield.
The practical starting point is account structure. Establish tax-advantaged accounts as the DRIP vehicle first, then screen for payout sustainability as the entry criterion for each position. A dividend strategy built this way is less about stock selection skill and more about process discipline applied consistently over decades.
The $5.1 million versus $795,000 gap in the Hartford Funds data did not materialise in any single year. It accumulated across 63 years of reinvested dividends, rising share counts, and growing per-share payments. The investor’s primary task is not to find the highest yield; it is to find sustainable payouts, reinvest them systematically, and hold the position through market cycles rather than reacting to short-term yield fluctuations.
The natural endpoint of multi-decade dividend compounding is the question of how much capital is actually required to live off dividends; at the S&P 500’s current yield of approximately 1.10%, a $1 million portfolio generates only around $11,000 per year, illustrating why the reinvestment phase described in this guide must run for decades before the passive income target becomes reachable.
This article is for informational purposes only and should not be considered financial advice. Investors should conduct their own research and consult with financial professionals before making investment decisions. Past performance does not guarantee future results.
A payout ratio is the percentage of a company's earnings or free cash flow paid out as dividends. It is the primary metric for assessing whether a dividend is financially sustainable, with ratios below 60% generally considered safe for most sectors.
A DRIP automatically uses dividend payments to purchase additional shares, growing your share count over time. This larger share base then generates bigger dividends at the next payment date, creating a compounding cycle that accelerates wealth accumulation over long holding periods.
For most sectors, a payout ratio below 60% is generally considered sustainable, while 60-80% warrants closer scrutiny. Regulated utilities and REITs can sustain higher ratios of 70-90% due to their stable, contractual cash flows.
In taxable accounts, reinvested dividends are typically taxed in the year received, creating annual tax drag that erodes compounding returns. Holding DRIP positions inside tax-advantaged accounts such as IRAs, ISAs, or TFSAs eliminates this friction and allows the full compounding effect to operate.
According to Hartford Funds and Ned Davis Research, reinvested dividends contributed approximately 69% of the S&P 500's total return from 1960 through 2023, with a $10,000 investment growing to $5.1 million with reinvestment versus only $795,000 from price appreciation alone.