Investor excitement around a fresh wave of AI and technology listings is running high in 2025-2026, with names like Databricks and Anthropic reportedly evaluating public offerings and completed IPOs from CoreWeave, Klarna, and Chime already trading on major exchanges. The enthusiasm is understandable. The problem is the data. Research spanning 1980 to 2024 shows that newly listed companies underperformed comparably sized established peers by an average of 3.3% per year across their first five years as public companies. Several of the cycle’s most anticipated listings are already trading below their offer prices. What follows is a clear explanation of why IPO investing has structurally tended to disappoint long-term holders, what the current AI and tech wave has in common with prior hot-issue periods, and how investors can use IPO sentiment as a broader market cycle signal rather than a buy ticket.
The numbers behind the narrative: what the long-run IPO record actually shows
A 3.3% annual drag sounds modest. Over a single year, it barely registers. Over five years, compounding turns that gap into something harder to ignore.
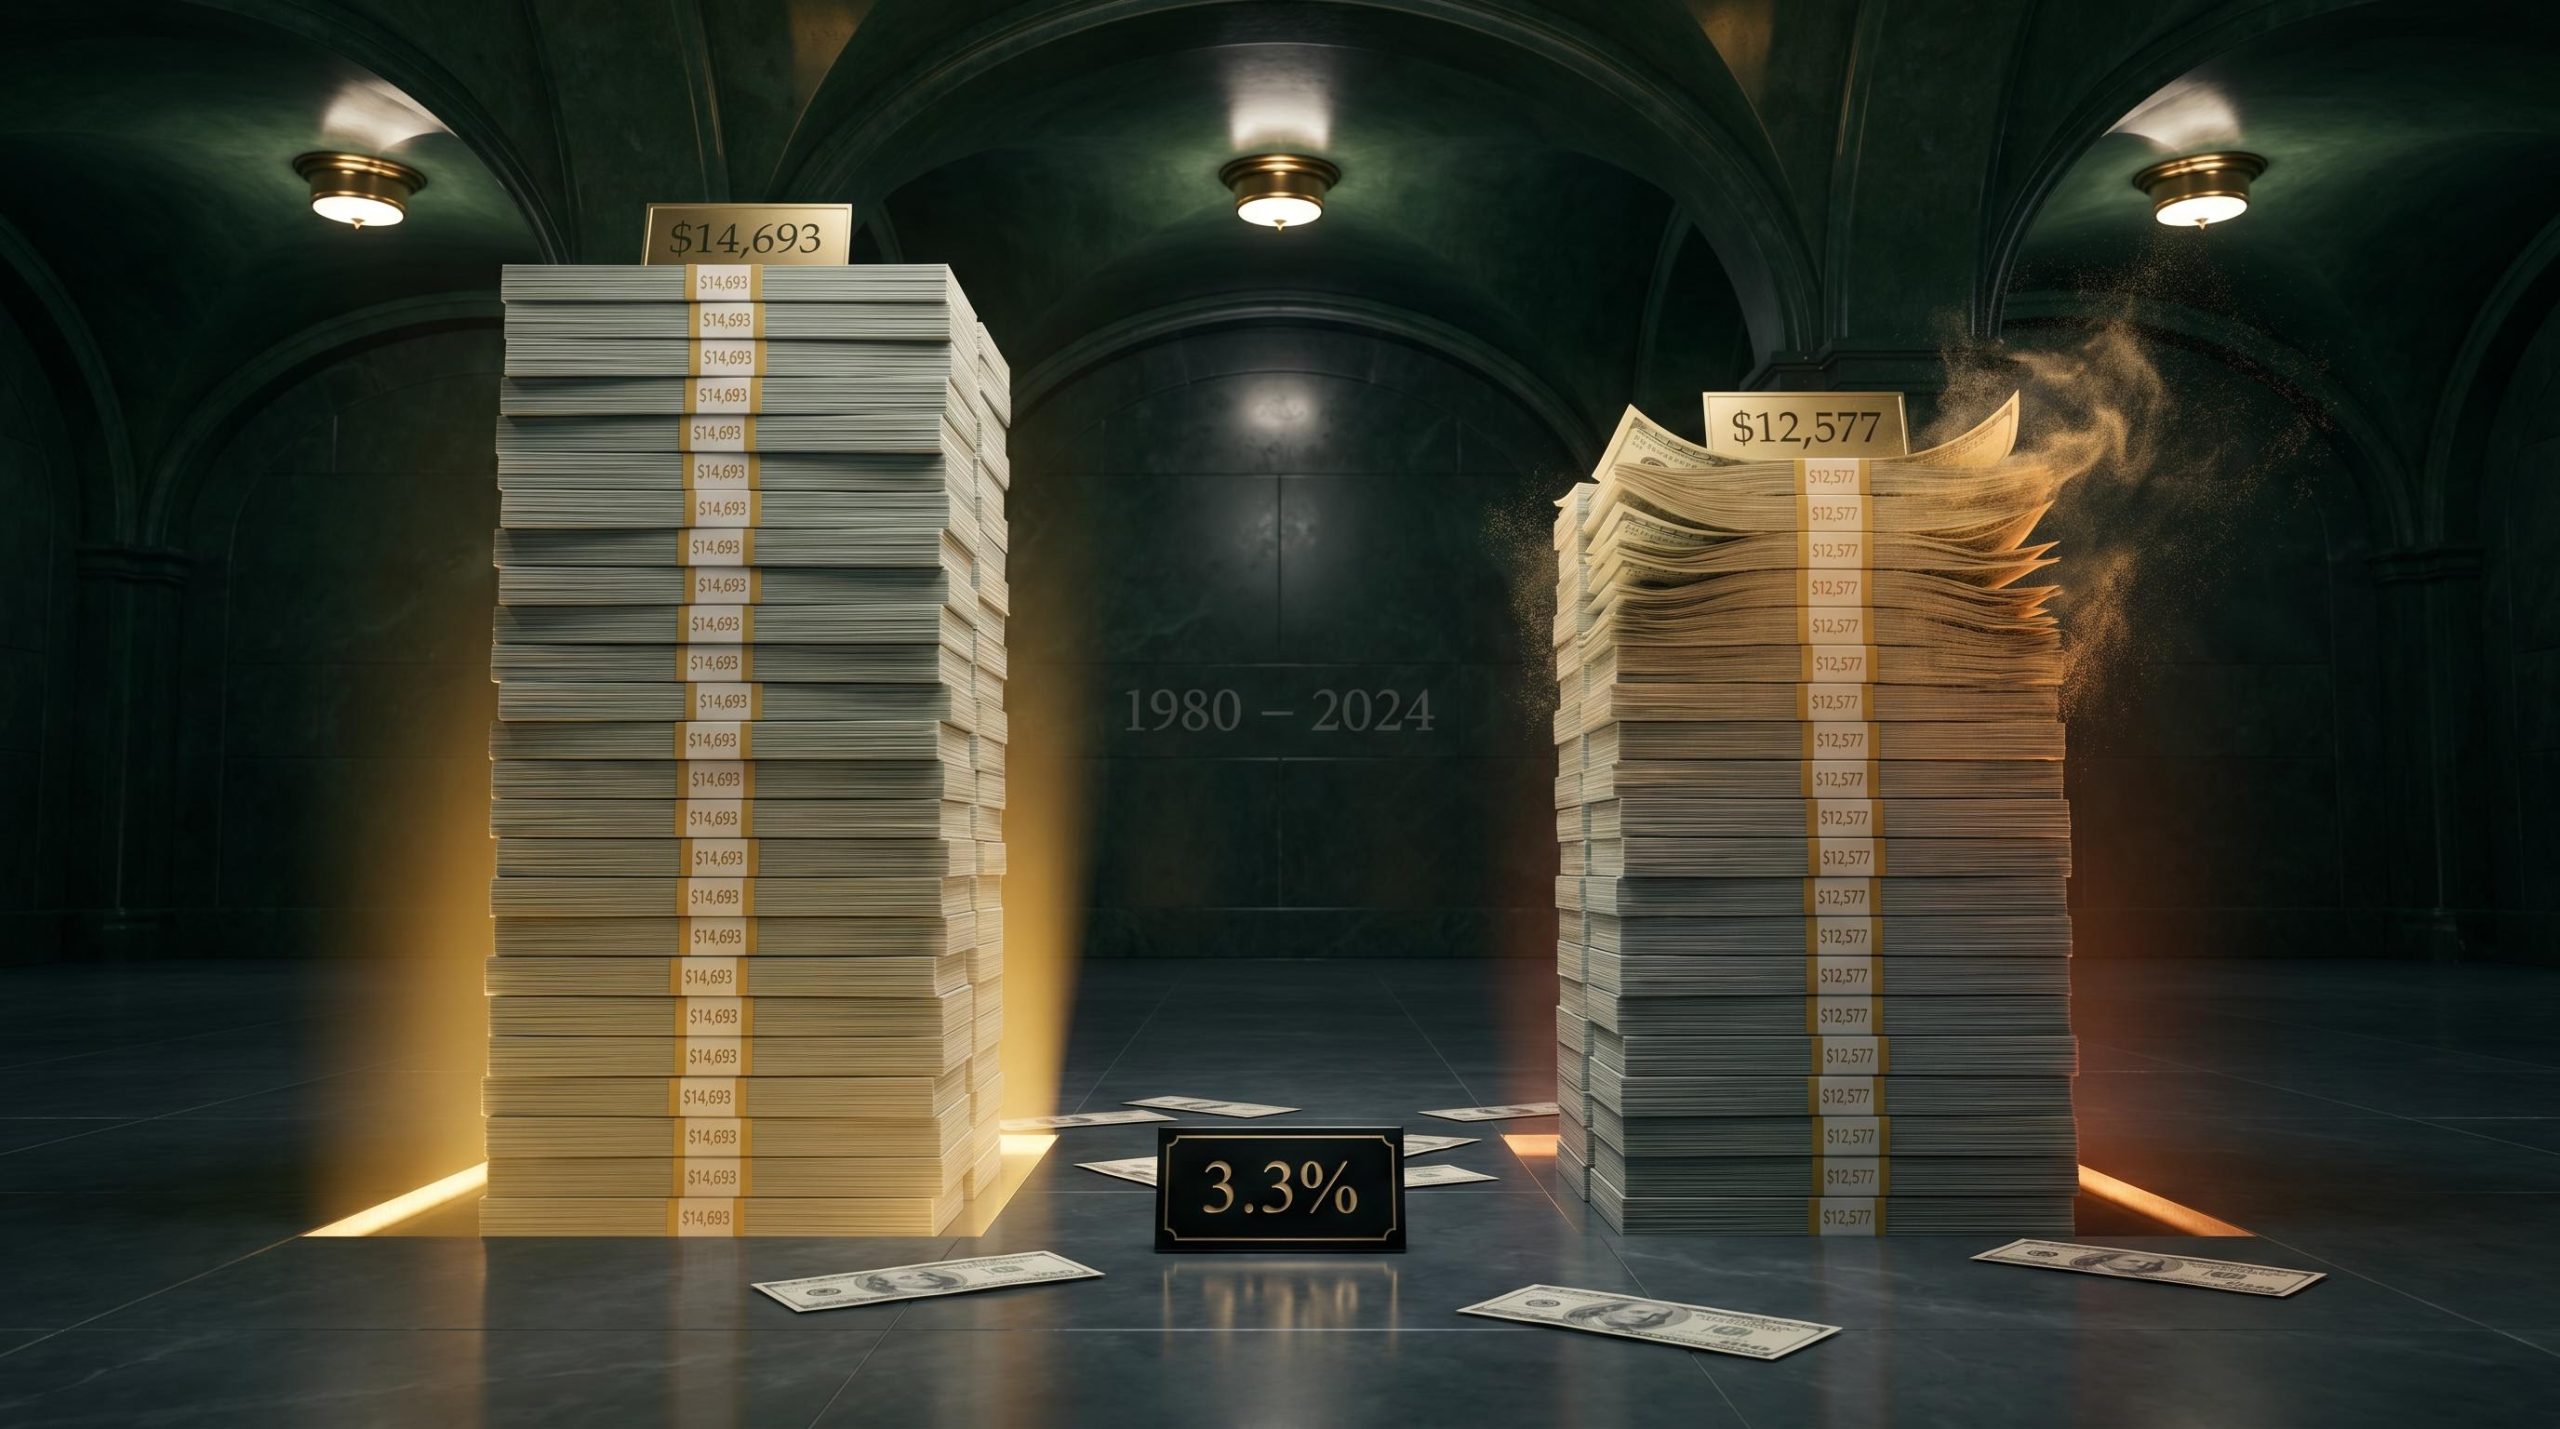
The anchor statistic: Newly listed companies underperformed comparably sized established peers by an average of 3.3% per year over their first five years as public companies, based on data spanning 1980 to 2024 (Fisher Investments analysis).
Consider a simple illustration. A $10,000 investment compounding at a benchmark rate of 8% annually reaches $14,693 after five years. The same investment subject to a 3.3% annual performance drag (compounding at 4.7%) reaches only $12,577. That is a gap of more than $2,100, or roughly 14% of the original capital, generated by a difference that seemed small in year one.
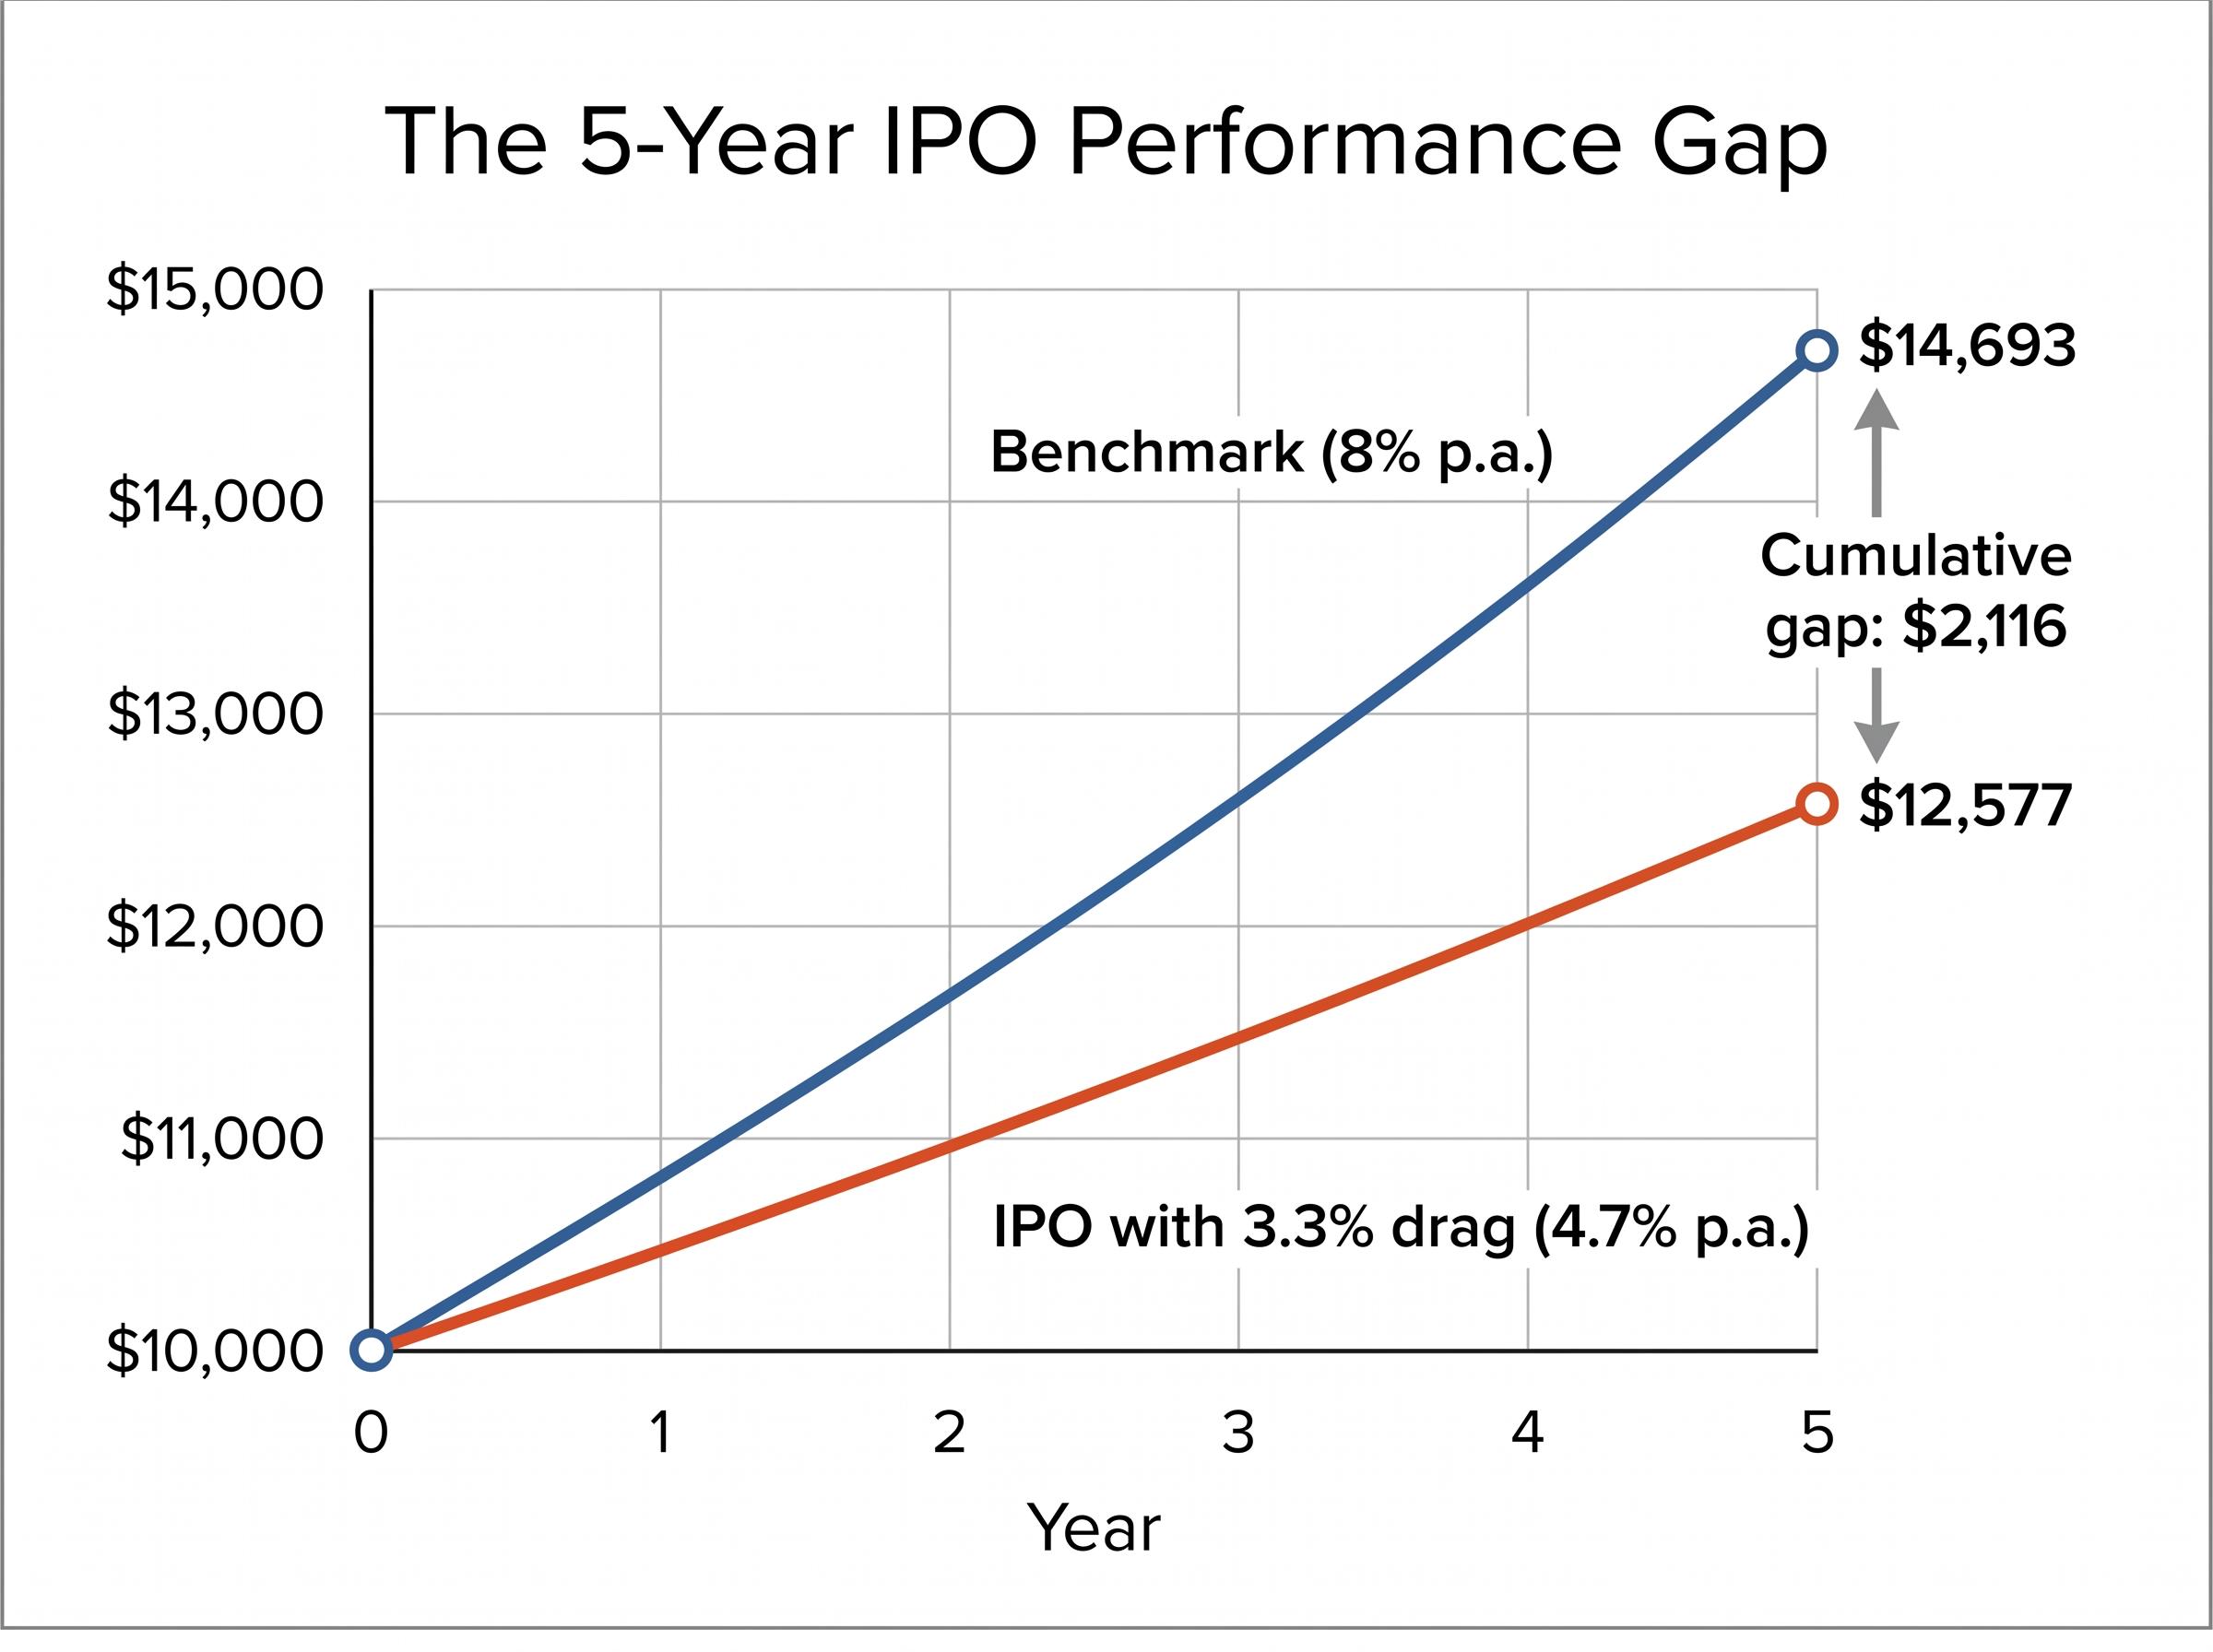
| Year | Benchmark (8% p.a.) | IPO with 3.3% drag (4.7% p.a.) | Cumulative gap |
|---|---|---|---|
| 1 | $10,800 | $10,470 | $330 |
| 3 | $12,597 | $11,478 | $1,119 |
| 5 | $14,693 | $12,577 | $2,116 |
This is not a fringe finding. Jay Ritter’s long-run academic research (working paper updated February 2024) confirms persistent underperformance, with the effect strongest in technology waves. Renaissance Capital’s practitioner data shows that average three-year buy-and-hold returns of IPOs lagged the S&P 500 by double-digit percentages across cohorts since 2010. EY and PwC practitioner reviews independently confirm that boom-time IPOs show “muted or negative excess returns” over three-to-five-year horizons.
Jay Ritter’s University of Florida database, one of the most comprehensive records of IPO underperformance across cycles, shows that the pattern holds across multiple decades and market regimes, with high-profile listings including Facebook, Uber, and Snap each ultimately confirming the structural thesis rather than disproving it.
The underperformance is most pronounced during hot-issue periods, precisely the conditions that characterise the current AI and tech wave.
When big ASX news breaks, our subscribers know first
Why companies choose their IPO moment (and why that timing works against you)
There is a common assumption that companies go public when they are ready. The more accurate framing is that companies go public when the market lets them extract maximum value.
Goldman Sachs Chief US Equity Strategist David Kostin warned in June 2024 that AI-exposed IPOs were coming at “full valuations” and that past cycles show such IPOs often underperform over three to five years. The observation was not a prediction about specific companies. It was a structural point about timing incentives: issuers and their investment banks choose listing windows to exploit periods of elevated investor optimism, meaning IPO supply peaks when pricing is already stretched.
This is not malfeasance. It is rational behaviour for a seller. Going public in a hot market with elevated multiples and receptive institutional demand maximises proceeds for pre-IPO shareholders and insiders. The companies reportedly evaluating listings in 2025-2026, including Databricks and Anthropic, are doing so as investor enthusiasm around AI sits at elevated levels, fitting the historical pattern of late-cycle issuance that Fisher Investments has documented.
Issuers hold three structural advantages over IPO buyers:
- Information advantage: Pre-IPO companies have months or years of internal data that public investors cannot access before the listing.
- Timing control: The issuer chooses when to come to market and can delay or accelerate based on market conditions.
- Market window selection: Companies list when sentiment, multiples, and demand are most favourable to the seller, not the buyer.
NYU Stern’s Aswath Damodaran wrote in August 2024 that IPO investors are often “subsidising option value for pre-IPO insiders,” with narrative running ahead of cashflows. The observation applies to every cycle, but it applies with particular force when the narrative in question, artificial intelligence, carries as much speculative premium as any technology theme in a generation.
What an IPO actually is, and why the first-day pop can mislead you
How IPO pricing works
An initial public offering (IPO) is the first sale of a company’s shares to the public, transitioning ownership from private investors to public market participants. The pricing process is more structured than many retail investors realise:
- The company and its underwriting investment banks conduct a roadshow, presenting the business to institutional investors.
- Institutional investors submit orders indicating how many shares they want and at what price, building what is known as the order book.
- Underwriters review demand and recommend a final offer price, typically set below the level where they believe the stock will trade on the open market.
- Shares are allocated to institutional investors at the offer price before public trading begins.
- The stock opens for trading on the exchange, and retail investors can buy at whatever the market price happens to be.
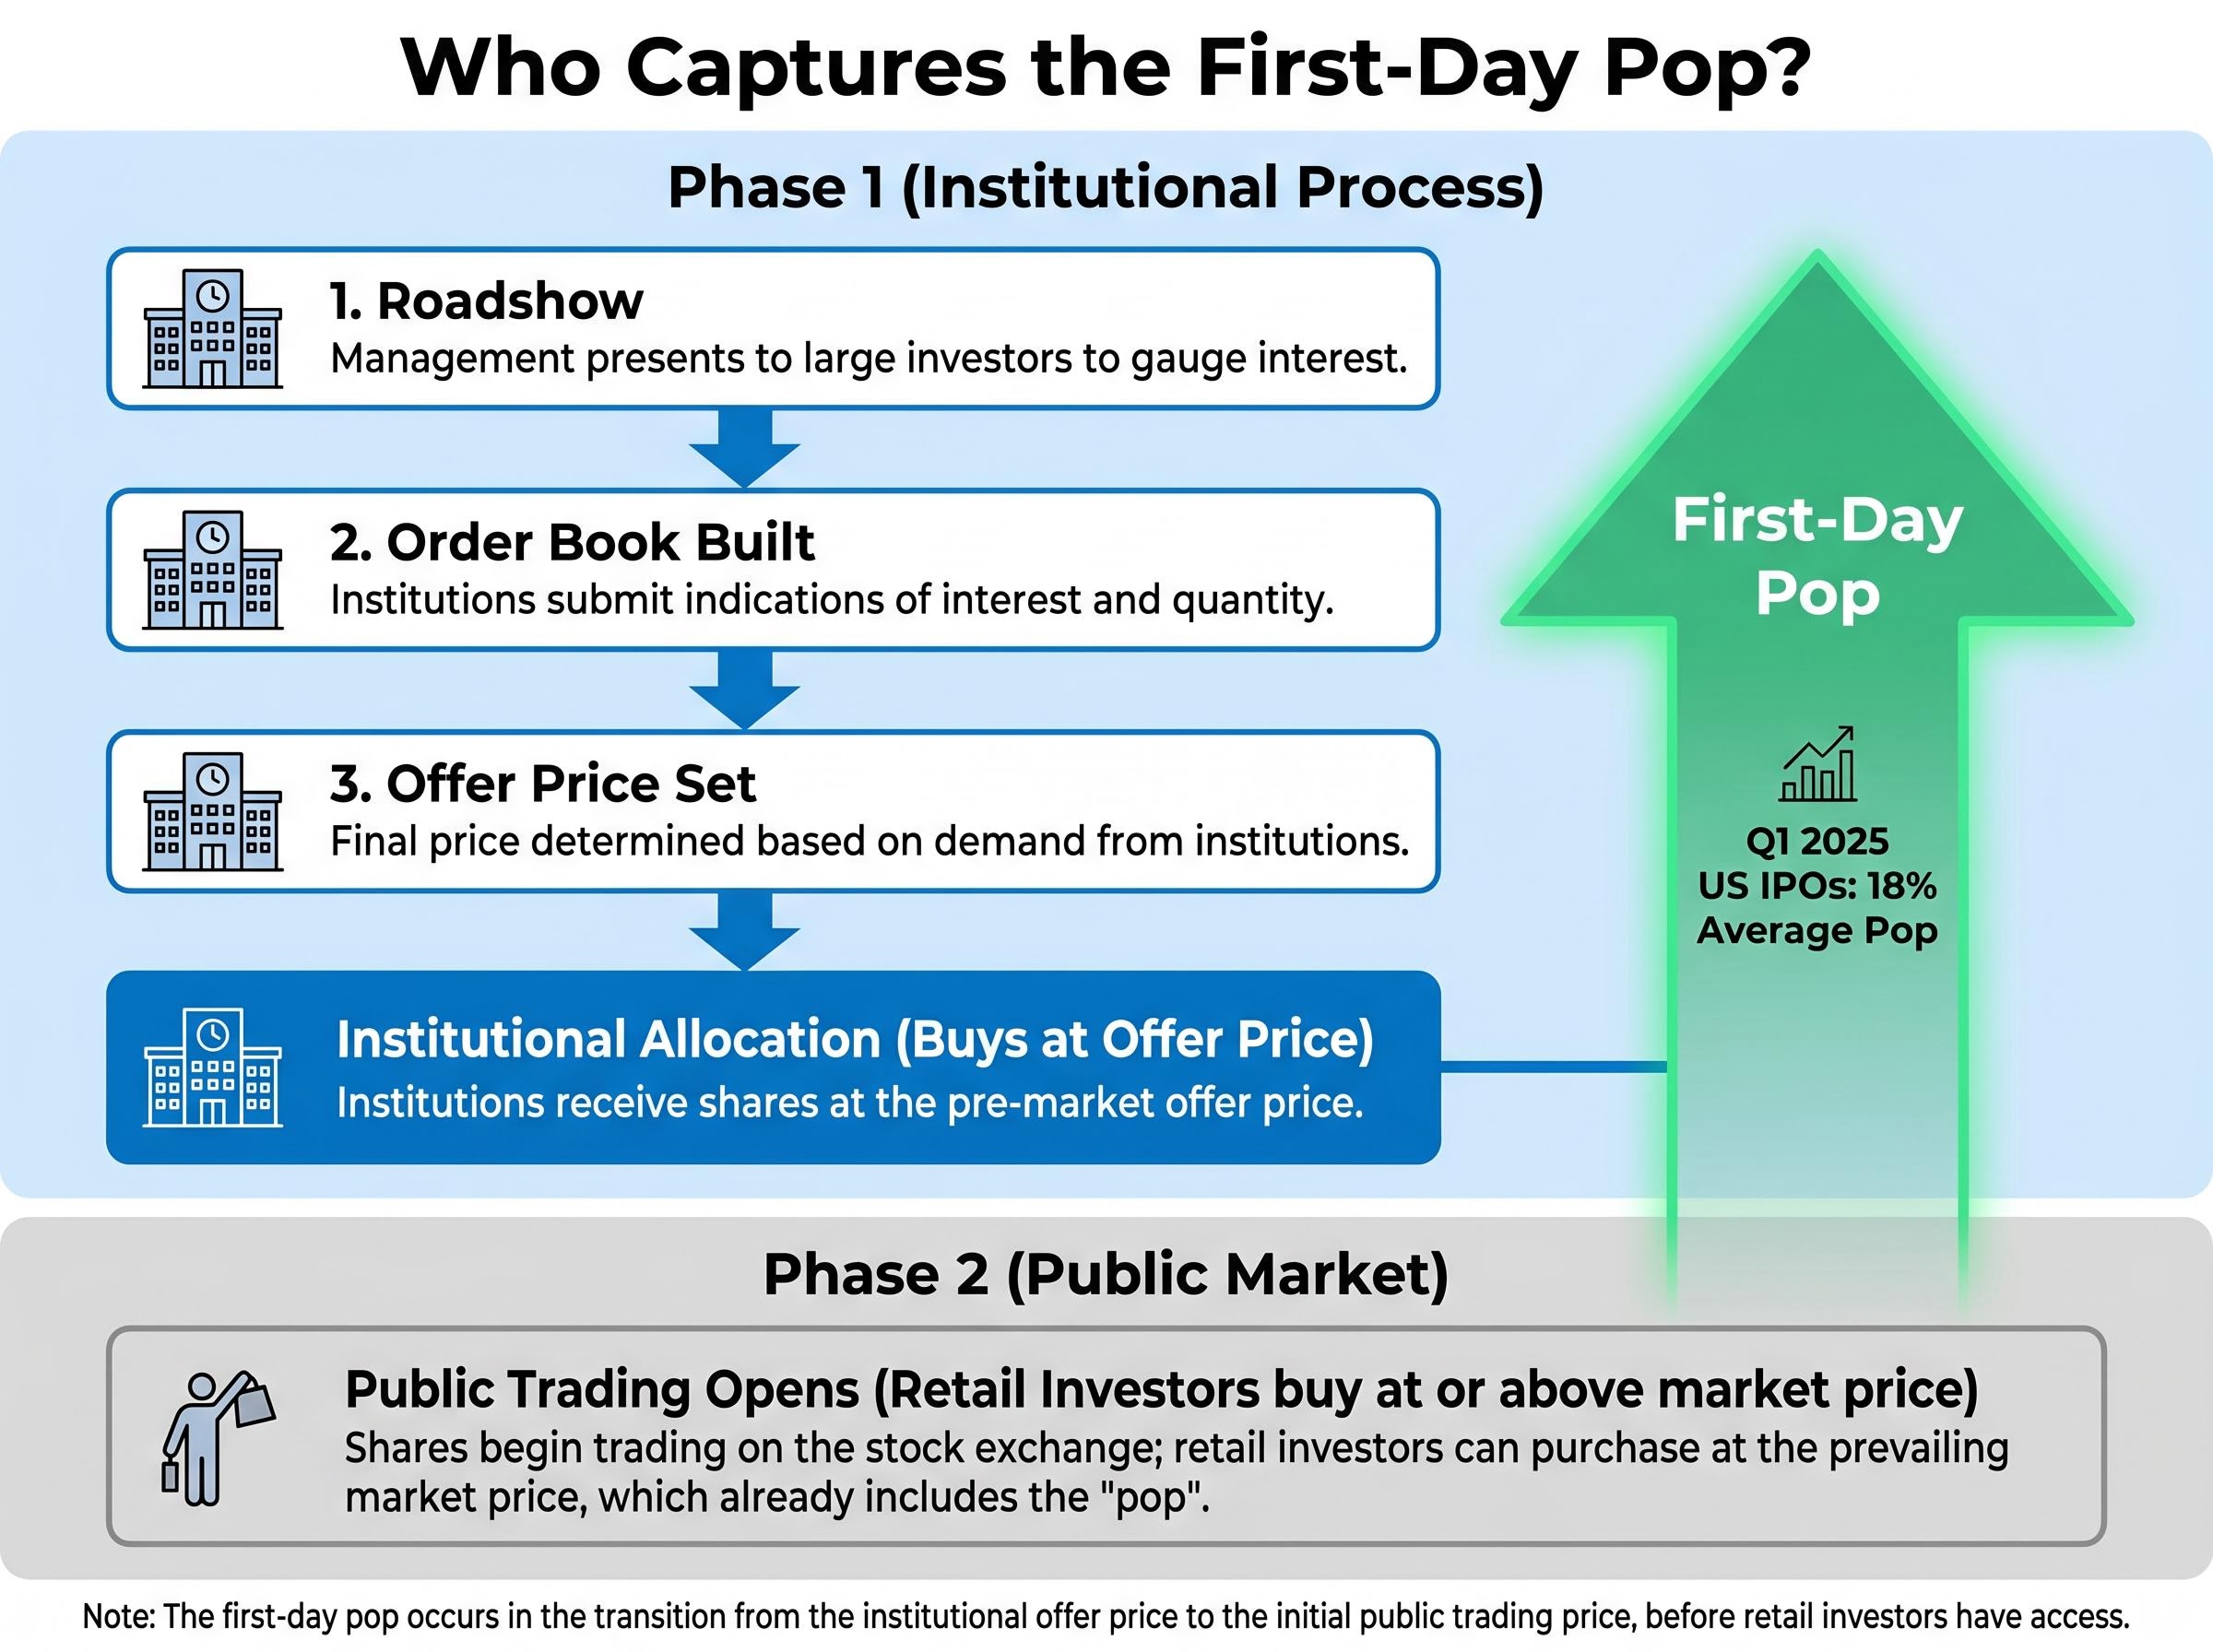
The offer price is negotiated between issuers and underwriters before retail investors can participate. This distinction is worth understanding before interpreting any headline about a stock “surging” on its first day.
The distinction between offer price and opening market price is rooted in primary market mechanics, specifically the separation between the price at which new shares are issued to institutions and the price at which the same shares then trade on the secondary market once public trading begins.
Why the first-day pop is not your return
Renaissance Capital reported that Q1 2025 US IPOs averaged an 18% first-day pop. That figure measures the gain from the institutional offer price to the closing market price. It does not measure the return available to most retail investors.
The gap matters because of what each group actually pays:
- Institutional investors receive allocations at the offer price, capturing most or all of the first-day gain.
- Retail investors typically buy at or above the opening market price, after the pop has already occurred, meaning they absorb the premium rather than benefiting from it.
The deliberate underpricing is a feature of the system, not a flaw. Investment banks set the offer price below anticipated clearing price to reward institutional clients and generate opening-day momentum. A summary in The Economist (June 2024) noted that direct listings, which bypass this underpricing mechanism, show post-listing performance closer to benchmarks than traditional IPOs.
Contrasting cases from March 2024 illustrate the variation within the system. Astera Labs, an AI data-centre semiconductor company, produced stronger early performance on the back of tangible hardware demand. Reddit, which attracted attention as an AI-adjacent data licensing play, followed a different trajectory. The hardware versus narrative distinction matters because it shapes how much of the first-day price reflects current earnings power versus future possibility.
The current AI and tech IPO wave seen through a historical lens
The academic record says hot-issue periods produce the weakest long-run returns for IPO buyers. The 2023-2025 cohort is providing a real-time test of that thesis, and the early results are consistent with the pattern.
| Company | IPO date | IPO price | Approx. price at 6-12 months | Change |
|---|---|---|---|---|
| Instacart | Sep 2023 | $30 | ~$21 (Sep 2024) | -30% |
| Arm Holdings | Sep 2023 | $51 | Below $51 (Sep 2024) | Negative |
| Chime | Jun 2025 | $27 | ~$19.70 (Feb 2026) | -27% |
| Klarna | Sep 2025 | $40 | Significantly below first-day close (May 2026) | Negative |
Instacart fell roughly 30% from its $30 IPO price by September 2024. Arm Holdings was trading below its $51 offer price by the same date after early gains faded. Among the 2025 listings, Chime dropped approximately 27% from its $27 offer price within eight months, and Klarna has declined significantly from its first-day close since listing at $40 per share in September 2025.
Renaissance Capital flagged AI-branded tech IPOs as priced at higher revenue multiples than the broader tech cohort, a specific valuation risk given the historical record of high-multiple cohorts. Howard Marks of Oaktree Capital drew the comparison explicitly in a 2024 memo.
Renaissance Capital flagged AI-branded tech IPOs as priced at higher revenue multiples than the broader tech cohort, and the broader concern around AI stock valuation risk extends beyond IPO pricing into the index itself, where the top five companies now control roughly 30% of total US market capitalisation and passive investors may carry more single-theme concentration than standard diversification metrics indicate.
“Prices in hot IPOs tend to over-discount the distant future,” Howard Marks wrote, comparing the current AI and tech enthusiasm to prior TMT waves and noting that the pattern leaves weak long-run returns for late-cycle buyers.
The bullish counterpoint deserves fair consideration. Cathie Wood of ARK Invest argued in November 2024 that conventional metrics may understate AI disruptors’ long-term potential, and that some AI-intensive IPOs could represent generational opportunities. Even if the technology proves transformative, however, the question for IPO investors is whether the listing price already reflects that transformation, and whether they are paying for a future that may take years to materialise while absorbing the structural disadvantages outlined above.
Astera Labs stands as the contrasting case: an AI hardware company with tangible demand drivers that has delivered stronger post-IPO performance than contemporaneous tech listings priced more aggressively. The distinction between hardware substance and narrative premium appears to matter.
Using IPO sentiment as a market cycle barometer
The most useful shift an investor can make is from “should I buy this IPO?” to “what does the IPO environment tell me about where the market cycle stands?”
High IPO volumes, strong first-day pops, and large pipelines of announced listings tend to cluster near market cycle peaks, when optimism is at its most elevated. Fisher Investments has observed that IPOs emerge more frequently in the later stages of a cycle. EY’s Q1 2025 Global IPO Trends data reinforces the point: proceeds were up approximately 40% versus Q1 2024, with elevated first-day gains in US tech and AI-related offerings. That acceleration itself signals elevated cycle optimism.
Lisa Shalett, Chief Investment Officer of Morgan Stanley Wealth Management, recommended in mid-2024 that clients “be highly selective” in AI IPOs, citing the historical underperformance of hot-issue cohorts. The recommendation was not simply a warning to avoid IPOs. It was a reframing of what IPO enthusiasm signals about the broader market.
Three questions worth asking when a high-profile IPO is announced:
- Is the company coming to market during a period of peak investor enthusiasm for its sector?
- Are the listing multiples already pricing in several years of growth?
- What does the volume and reception of current IPOs suggest about where the broader market cycle sits?
Translating the signal into portfolio thinking
Recognising that IPO enthusiasm tends to peak near cycle tops does not require shorting equities or avoiding them altogether. It suggests asking whether the excitement concentrated in high-profile listings might be creating relative opportunities in less-hyped segments of the market, where expectations are lower and the margin of safety is wider. Fisher Investments has made the point that redirecting attention toward areas where investor expectations appear less stretched is often the more productive response to a frothy IPO environment.
For investors wanting to identify where lower-expectation opportunities might currently sit outside the AI and tech IPO ecosystem, our full explainer on market leadership rotation examines the valuation spreads between US Technology and international developed markets, the historical precedents from the Nifty Fifty and TMT cycles, and the institutional fund flow data that suggests the rotation trade is not yet crowded.
The IPO that is hardest to resist is often the one most worth resisting
The conditions that make an IPO feel most compelling, the household brand name, the AI exposure, the breathless first-day pop, are precisely the conditions that the historical record associates with the weakest long-run returns for public market buyers. The structural mechanics reinforce this: issuers choose the moment of maximum optimism, underwriters price to reward institutions, and retail investors absorb the premium.
Exceptions exist. Astera Labs demonstrated that substance-driven AI hardware names can outperform the broader IPO cohort. Some of the companies currently evaluating listings may ultimately justify their valuations over a decade. The probabilistic case, however, favours caution. A 3.3% annual drag compounding over five years is not a rounding error. It is a structural headwind that has persisted across more than four decades of data.
3.3% per year. That is the average annual underperformance of newly listed companies versus comparably sized established peers over their first five years (1980-2024). In a market where Databricks is targeting a possible 2026 listing and Anthropic is reportedly preparing for an October 2026 offering, the figure is worth keeping in view.
The IPO market remains active. Global listings raised approximately $44 billion across 287 IPOs in Q1 2025 alone, and the pipeline continues to build. Supply tends to meet demand when optimism is at its highest. The framework developed here, grounded in structural incentives, pricing mechanics, and four decades of performance data, gives investors a lens to evaluate each new offering critically rather than reactively, not only in this cycle but in every cycle that follows.
This article is for informational purposes only and should not be considered financial advice. Investors should conduct their own research and consult with financial professionals before making investment decisions. Past performance does not guarantee future results. Financial projections are subject to market conditions and various risk factors.