SK Hynix’s $26.5B Nasdaq Listing Shatters ADR Demand Records
9 hrs ago

The US 30-year Treasury yield hit 5.20% on 20 May 2026, a level not seen since before the Global Financial Crisis, and Australian equities absorbed the blow in a single session. The S&P/ASX 200 closed at 8,454, shedding approximately 151 points (down 1.75%) as the global bond market repricing collided with an already tightened domestic rate environment. The RBA’s cash rate sits at 4.35% following its third hike of 2026, effective 6 May, meaning investors faced a global yield shock layered on top of a domestic tightening cycle running in the same direction. What follows is a breakdown of how the sell-off transmitted through sectors, why bond yields mechanically compress equity valuations, and how to read the defensive rotation into Consumer Staples as a signal rather than noise.
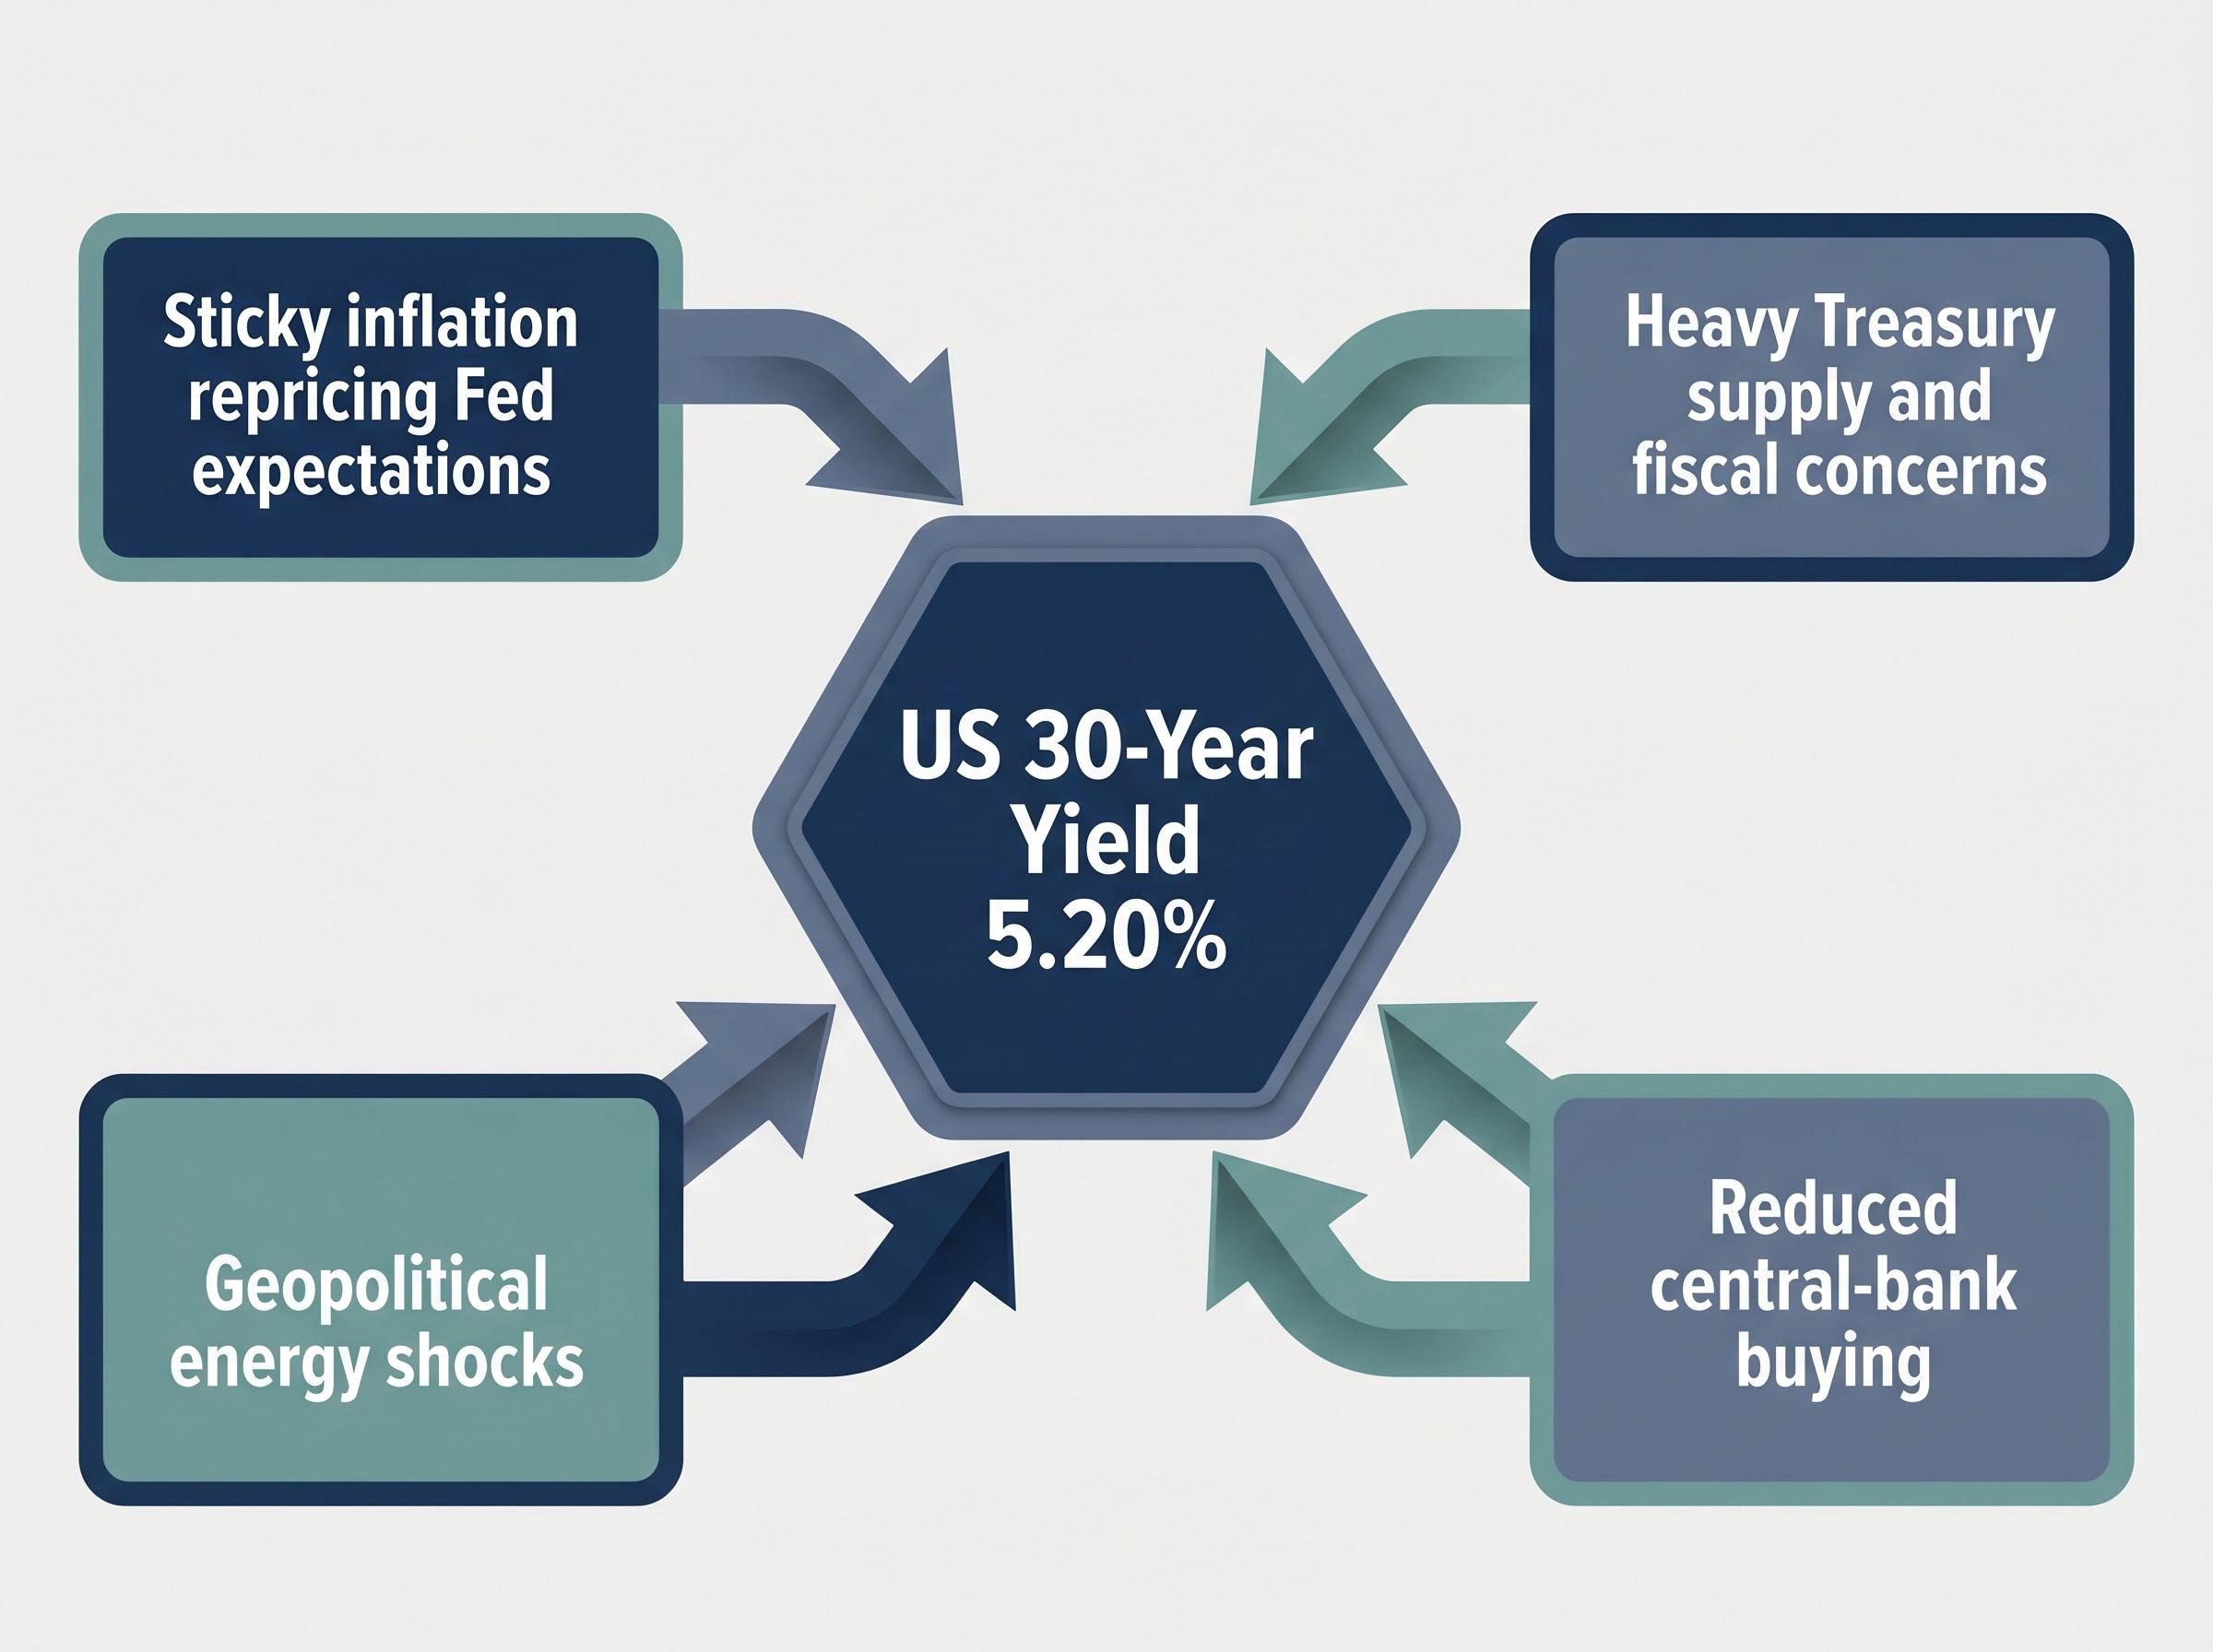
The US 30-year yield at 5.20% is the highest level since before the Global Financial Crisis.
The number carries weight on its own. The last time long-dated US government debt demanded this much compensation from investors, Bear Stearns still existed.
But this was not a single-cause event. The yield surge reflects a pressure system built from four converging forces:
The global trigger hit an Australian market already under pressure. The RBA’s 4.35% cash rate, the third hike of 2026, means domestic investors absorbed the shock with no monetary policy cushion underneath them. The All Ordinaries fell 1.27% to 8,717.0. The Small Ordinaries dropped 2.12% to 3,314.3, reflecting the amplified risk premium smaller companies face when rates rise across both hemispheres.
The RBA’s third consecutive hike to 4.35%, decided on 5 May 2026 with eight of nine Board members voting in favour, produced a domestic tightening overlay that compounds every global yield shock rather than cushioning it, because Australian investors now face no buffer from accommodative local policy.
The connection between bond yields and share prices is mechanical, not speculative. Understanding the mechanism converts every future yield-driven sell-off from a surprise into a pattern.
The logic runs in three steps:
The mechanics of discount rate compression are not unique to this session; on 18 May 2026, simultaneous multi-decade yield highs across the US, UK, Japan, and Australia demonstrated that a move from 2% to 5% can reduce the present value of a perpetual income stream by as much as 60% with no change to the underlying business.
Higher yields set a higher bar for equities to clear. When the 30-year Treasury offers 5.20% with sovereign backing, every dollar of future corporate profit must justify a premium above that rate, or capital moves to bonds.
Certain equity sectors are purchased primarily for their income streams rather than their growth potential. Real estate investment trusts and utilities are the clearest Australian examples; investors hold them for stable dividends, much as they would hold a government bond for its coupon.
When government bond yields rise, these sectors must re-price their own yields upward (meaning share prices fall) to remain competitive with risk-free alternatives. The 20 May session demonstrated this precisely: 239 stocks declined against just 42 advancers in the ASX 300, and the index closed within 0.1% of its intraday low, confirming persistent sell pressure throughout the day rather than a brief panic. The Australian dollar slipped 0.04% to US$0.7104, reflecting the broader risk-off tone.
The session sorted the ASX by yield sensitivity with near-mechanical precision.
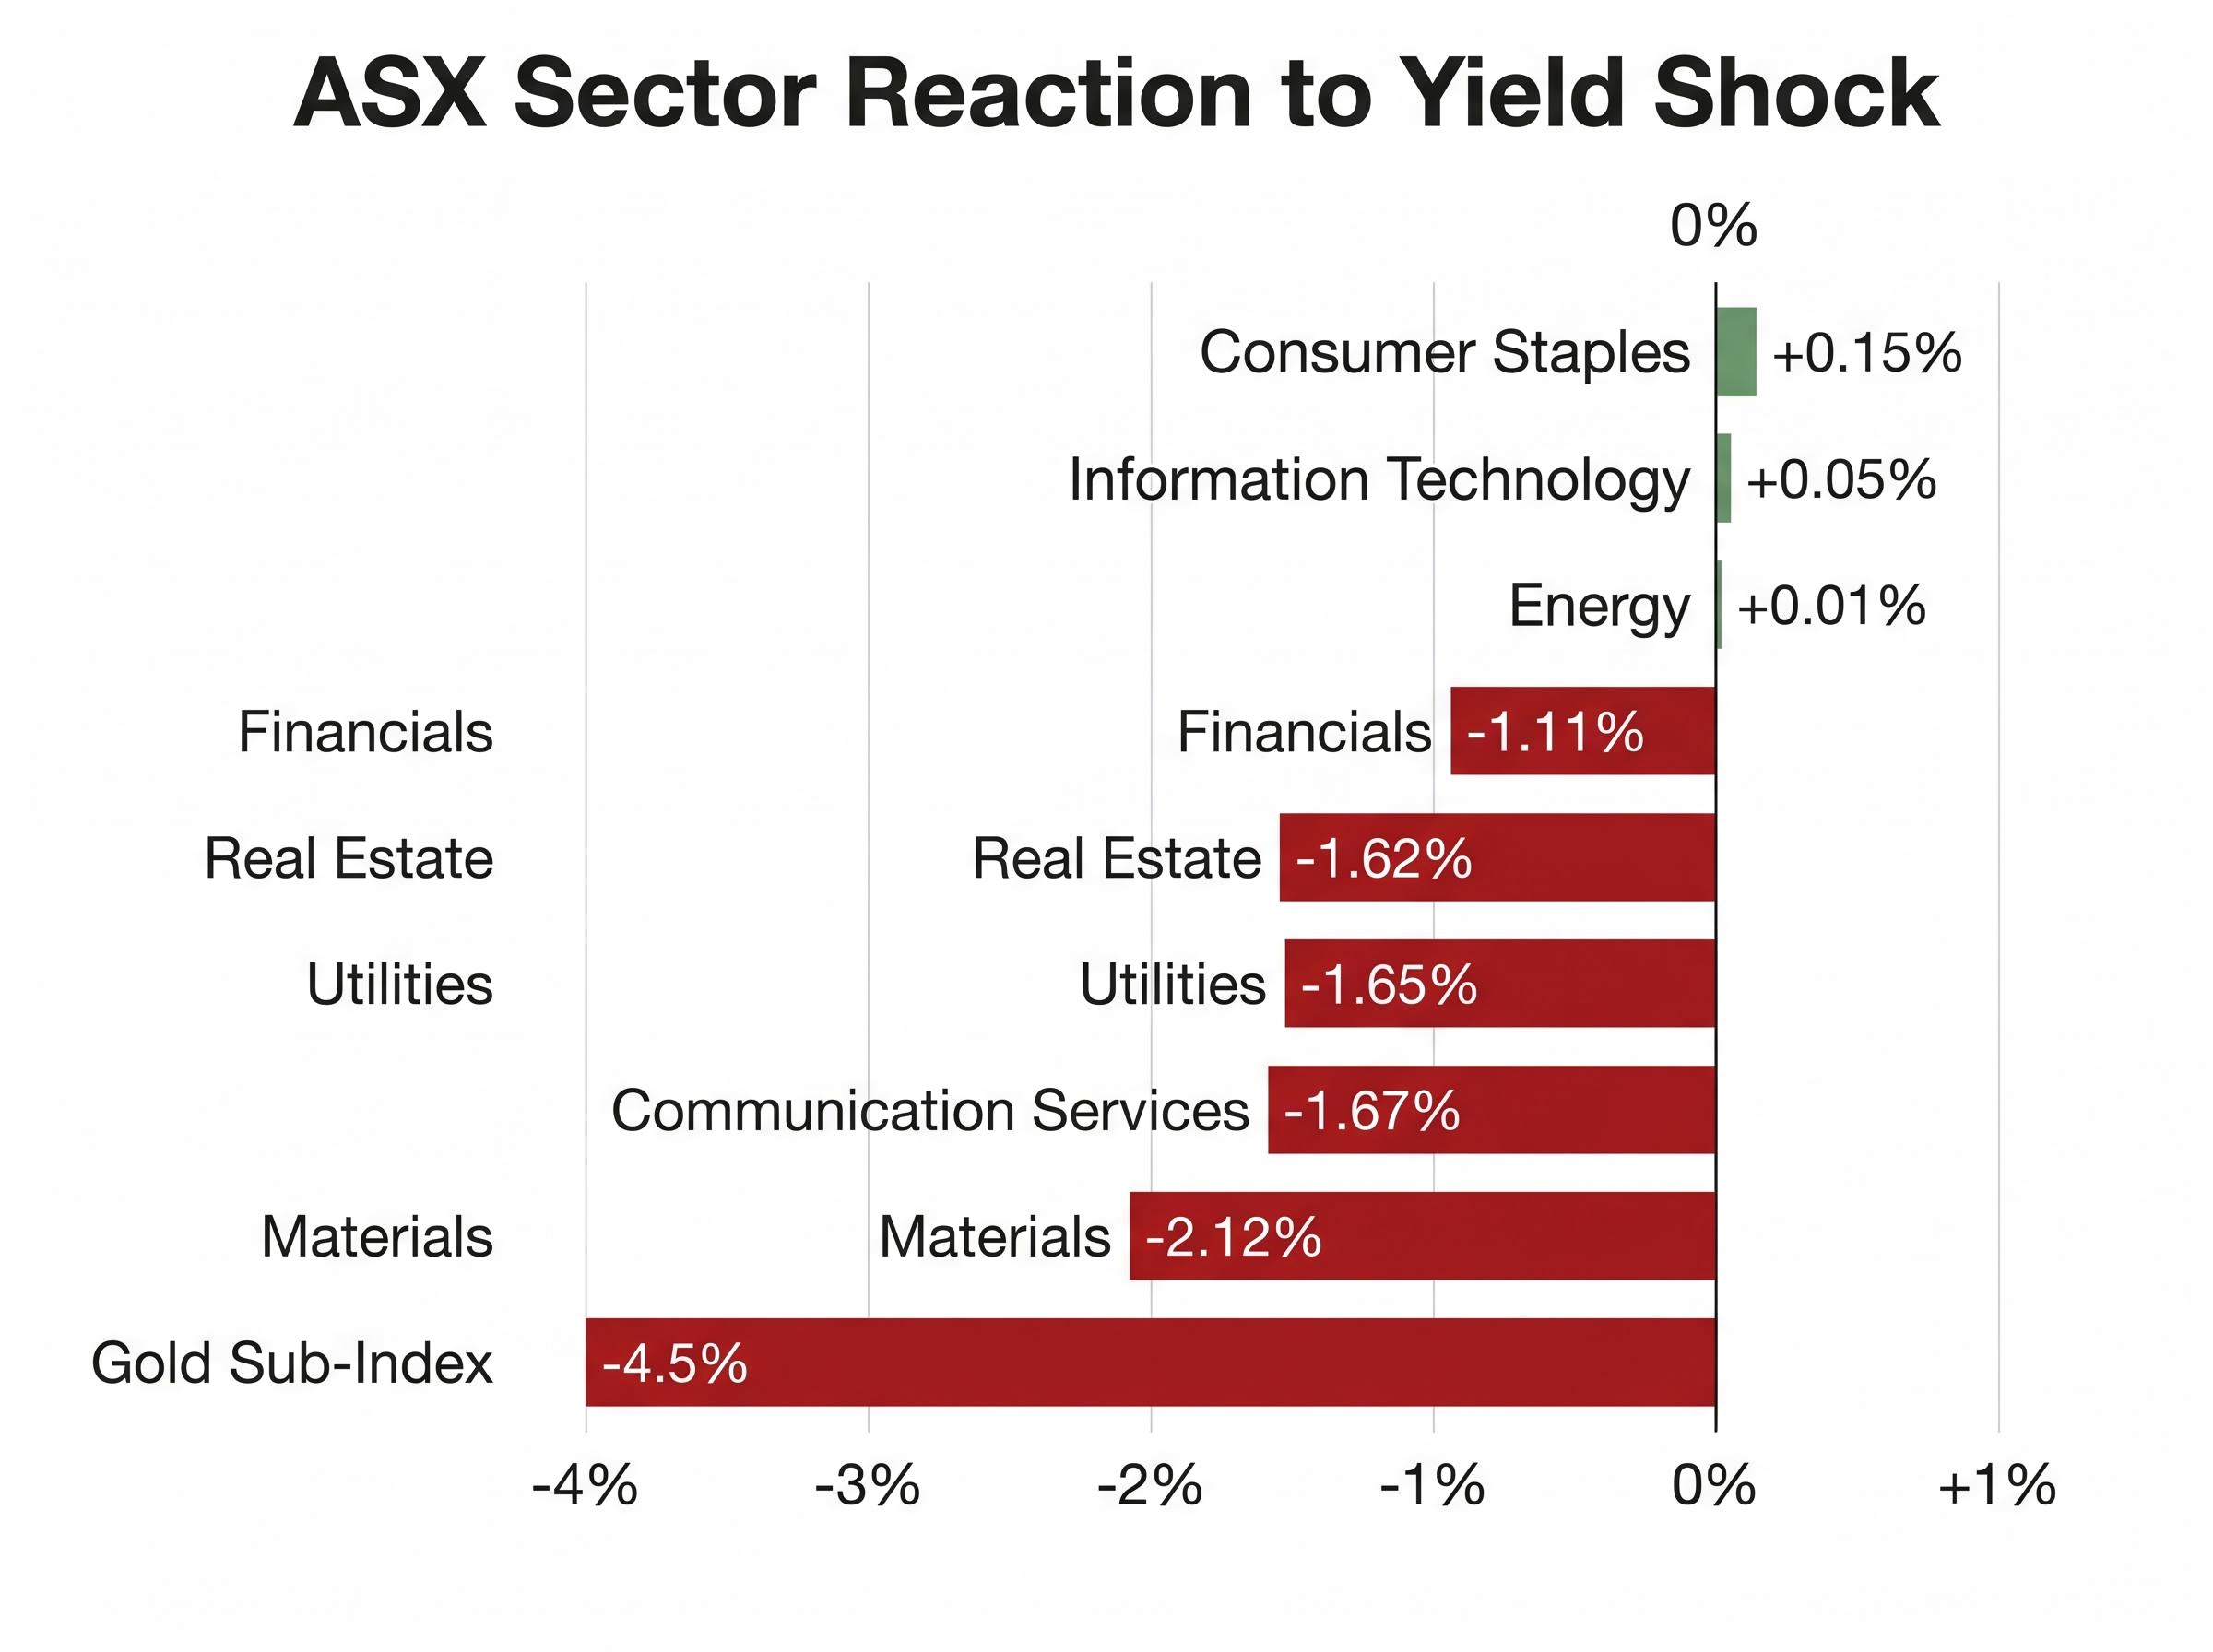
| Sector | Index Code | Session Change (%) | Yield Sensitivity |
|---|---|---|---|
| Materials | XMJ | -2.12% | High |
| Gold Sub-Index | XGD | -4.5% | High |
| Communication Services | XTJ | -1.67% | High |
| Utilities | XUJ | -1.65% | High |
| Real Estate | XPJ | -1.62% | High |
| Financials | XFJ | -1.11% | Medium |
| Consumer Staples | XSJ | +0.15% | Low |
| Information Technology | XIJ | +0.05% | Medium |
| Energy | XEJ | +0.01% | Low |
Materials led the losses. BHP fell 2.3%, Rio Tinto shed 1.5%, and Fortescue dropped 1.2% as SGX iron ore futures declined 0.7% to US$107.20 per tonne, marking a fifth straight session of losses.
Gold miners suffered the sharpest pain. COMEX gold futures fell 1.0% to US$4,467 per ounce as higher real yields reduced gold’s appeal as a non-yielding asset. West African Resources dropped 5.2%, Westgold Resources fell 5.0%, Greatland Gold lost 6.3%, and Evolution Mining declined 4.9%. Producers face a dual squeeze: lower gold revenue alongside rising energy input costs.
Gold’s dual headwind in this environment, stronger US real yields suppressing prices while rising energy input costs compress producer margins, explains why a 1.0% fall in COMEX gold futures produced outsized 5-6% declines in individual ASX gold miners rather than the proportionate moves a simple price-to-revenue model would predict.
Financials present a more complex picture. The sector fell 1.11%, with Westpac down 2.4%, ANZ off 2.1%, and Macquarie losing 2.0%.
Morgan Stanley has warned that the pace of change in operating conditions for Australia’s major banks is the fastest in 25 years, citing the RBA’s rapid policy reversals, potential property tax concession changes, and the global energy shock pushing up inflation and wholesale funding costs.
Consumer Staples was the sole sector to post a gain, rising 0.15%. Woolworths and Coles both edged higher as investors rotated into non-discretionary revenue streams insulated from credit conditions.
The Consumer Staples gain was not an anomaly. Defensive rotation into non-cyclical sectors during bond-yield spikes is a repeating, globally documented pattern.
Woolworths and Coles serve as Australia’s domestic equivalents of global defensive names such as Procter and Gamble and Nestlé. Their revenue base is non-discretionary: households purchase groceries regardless of the interest rate environment. The characteristics that define a defensive sector in this context are consistent:
Health Care (XHJ) reinforced the pattern, falling just 0.23%, the second most resilient sector on the day.
ASX 300 breadth: 239 decliners to 42 advancers.
That ratio confirms this was not a targeted sector rotation. It was broad-based risk-off positioning, with capital concentrating into the narrowest set of defensive names. The ASX 200 closed within 0.1% of its intraday low, meaning selling pressure did not ease at any point during the session. When breadth is this negative and the close is this weak, the movement reflects institutional conviction rather than retail panic.
Three data releases in the coming days will determine whether the yield pressure is peaking or accelerating:
China’s PBOC held both its 1-year (3.0%) and 5-year (3.5%) Loan Prime Rates steady on 20 May 2026, removing one potential additional headwind from Chinese monetary policy tightening.
Supply resistance sits in the 8,678-8,745 range, aligned with short- and long-term downtrend ribbons. Demand support lies in the 8,262-8,379 zone. The index closing near its intraday low signals sellers remain in control entering the next session.
If Thursday’s data confirms persistent US inflation and resilient employment, the yield pressure is unlikely to ease quickly. Rate-sensitive sectors on the ASX would face continued valuation headwinds under that scenario.
The 20 May session is not an exception. It is the transmission mechanism working as designed. US macro data drives yield expectations. Yields drive the US dollar. The dollar drives commodity prices. All three simultaneously feed into the discount rates applied to Australian equity valuations.
This transmission mechanism had already run in an earlier prior ASX selloff episode on 8 May 2026, when a single overnight Strait of Hormuz military exchange erased an estimated $100 billion in Australian market capitalisation through the same two channels operating on 20 May: rising bond yields compressing dividend-paying equity valuations and an oil price spike feeding inflation expectations.
The RBA’s 4.35% cash rate compounds the effect. Three hikes in 2026 mean Australian investors carry a domestic tightening overlay that amplifies every global yield shock in a way that would not apply if rates were accommodative.
When US long-end yields spike, the following checklist applies:
The US 30-year yield at 5.20%, against an RBA cash rate of 4.35%, produced a session where 239 ASX 300 stocks fell and 42 rose. The pattern is structural. It will repeat.
This article is for informational purposes only and should not be considered financial advice. Investors should conduct their own research and consult with financial professionals before making investment decisions.
Past performance does not guarantee future results. Financial projections are subject to market conditions and various risk factors.
The sell off was triggered by the US 30-year Treasury yield reaching 5.20%, its highest level since before the Global Financial Crisis, which collided with Australia's own tightening cycle after the RBA lifted its cash rate to 4.35% in May 2026, leaving investors with no domestic policy cushion.
When bond yields rise, the discount rate used to value future company earnings also rises, reducing the present value of those earnings even if the underlying business has not changed, which mechanically pushes share prices lower.
Materials fell 2.12%, the Gold Sub-Index dropped 4.5%, Communication Services lost 1.67%, Utilities declined 1.65%, and Real Estate fell 1.62%, while Consumer Staples was the only sector to finish in positive territory, rising 0.15%.
A bond proxy is a stock, typically a REIT or utility, bought primarily for its stable dividend income rather than growth; when government bond yields rise, these stocks must re-price their own yields upward (meaning their share prices fall) to remain competitive with risk-free alternatives.
Investors should monitor the US FOMC minutes and Australian April employment data (both due Thursday), where consensus forecasts 15,700 new jobs and unemployment steady at 4.3%, as well as US Flash May PMI figures, since any upside surprises could extend the yield-driven pressure on ASX equities.