Goodman Group’s 18% Pullback: Decoding the Metrics That Matter
8 mins ago
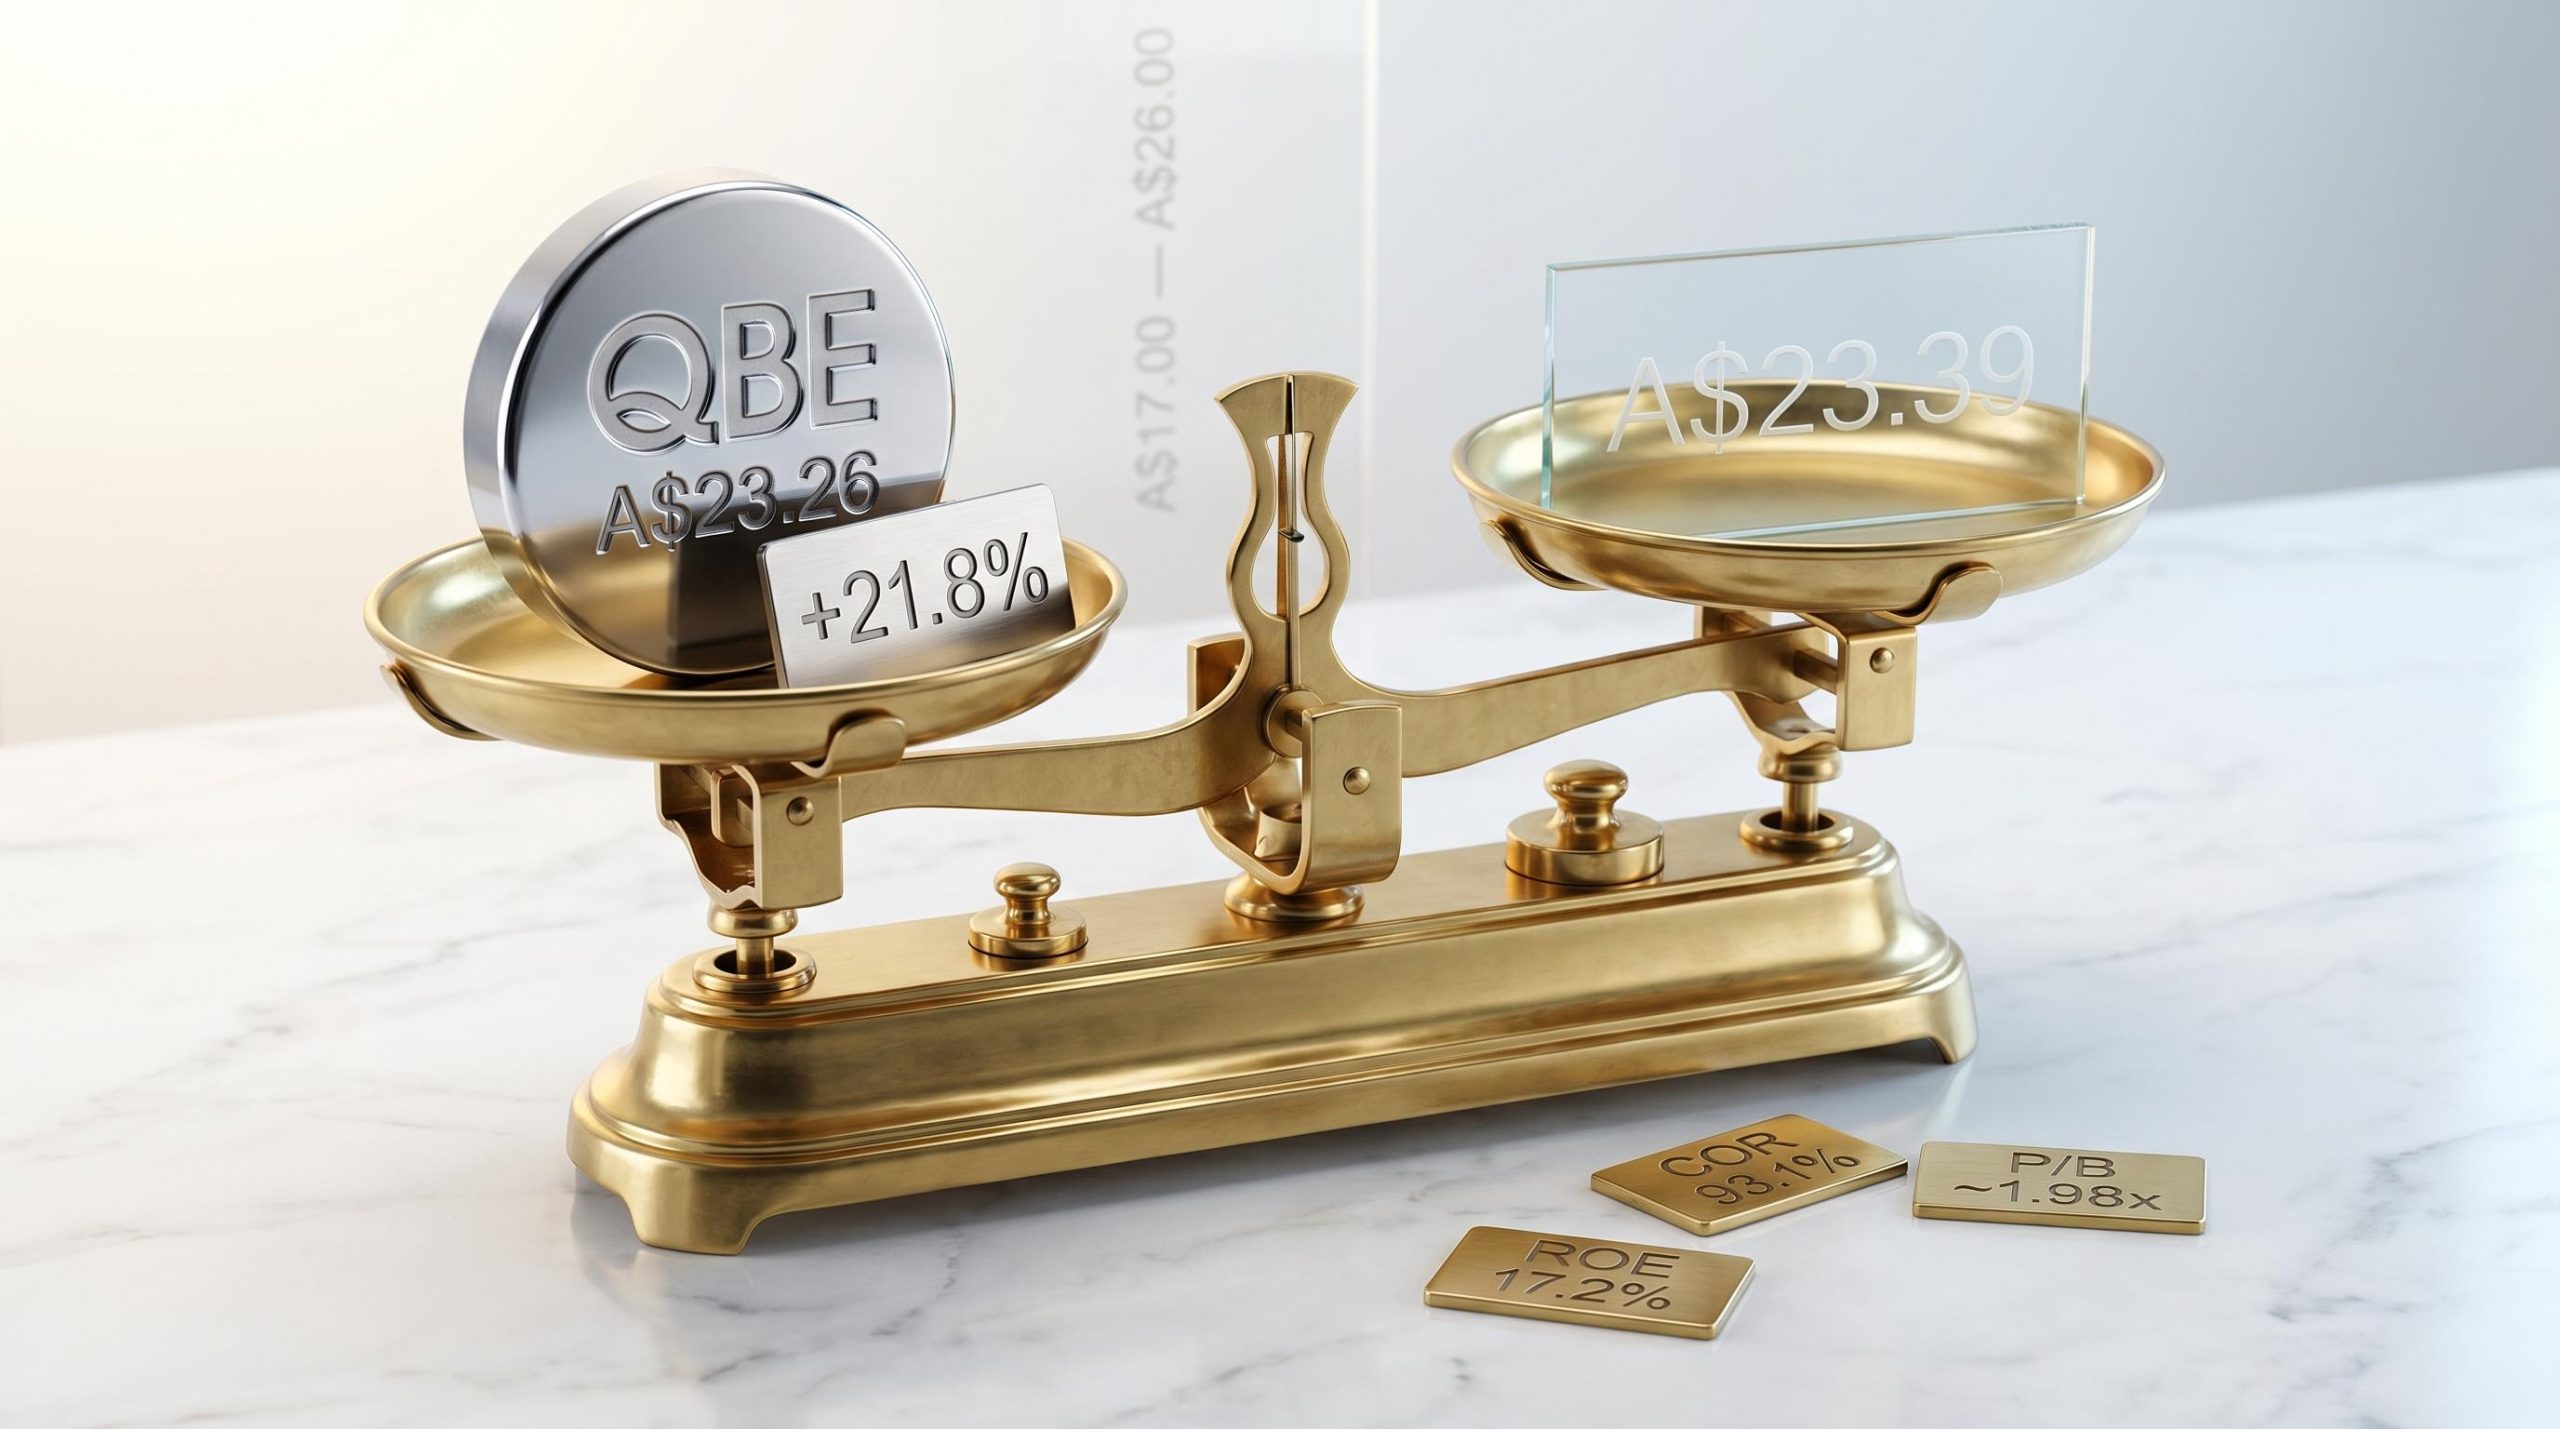
QBE Insurance Group has delivered a 21.8% share price gain since the start of 2025, pushing the stock to approximately A$23.26 as of mid-May 2026. For investors watching that move from the sidelines, the question is no longer whether QBE has run, but whether the fundamentals give it room to keep going.
The rally coincides with QBE’s strongest reported combined operating ratio in recent years (93.1% for FY2025), a reaffirmed 2026 outlook, and continued tailwinds from elevated interest rates. Thirteen analysts currently carry an Outperform or Buy consensus, with an average 12-month price target of A$23.39, suggesting the market has priced in most of the near-term good news.
What follows is a close reading of QBE’s financial metrics, its business structure, the macro forces shaping its earnings, and what the valuation implies for Australian investors deciding whether the stock is still worth owning at current levels.
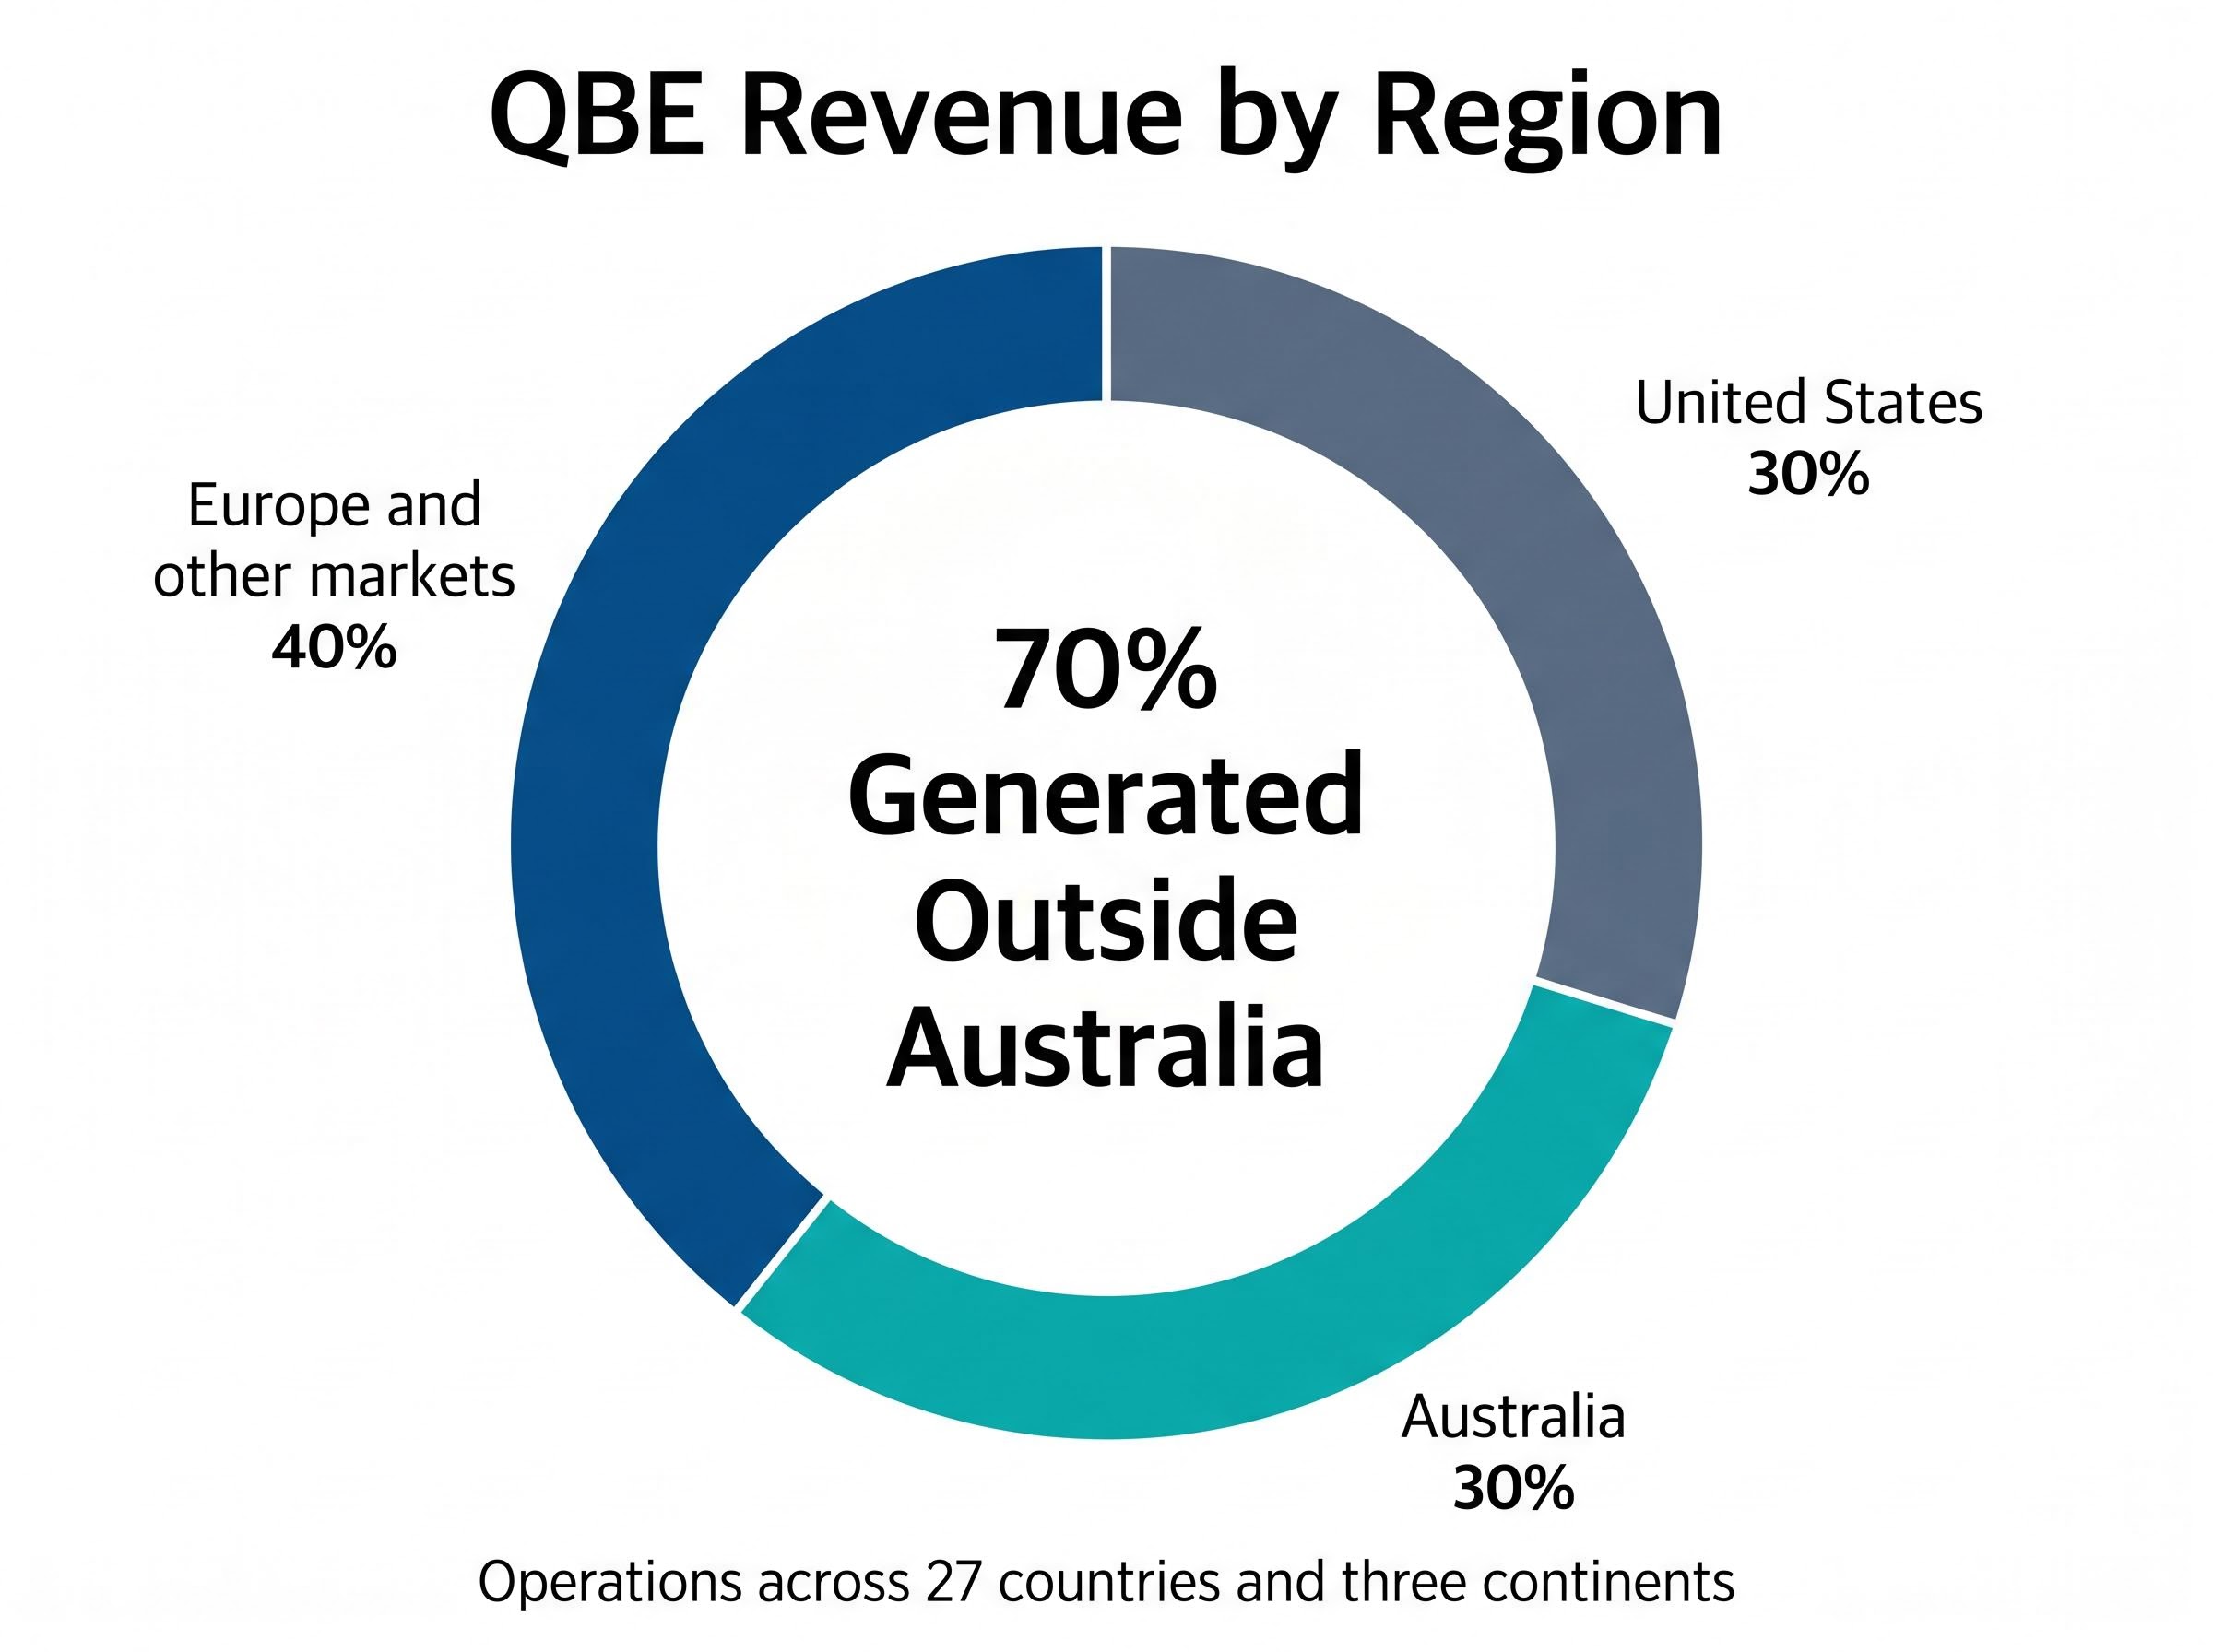
QBE started life as a marine insurer in Townsville in the late 1800s. What sits on the ASX today bears little resemblance to that origin. The company now operates across 27 countries, writing commercial, consumer, reinsurance, and agricultural lines in markets that span three continents.
That geographic breadth is both a competitive moat and a source of complexity. Australian investors who treat QBE as a domestic play are mispricing its risk profile, because the majority of premium income is generated offshore.
The revenue split tells the story:
With roughly 70% of revenue generated outside Australia, QBE shareholders are implicitly taking on material currency risk across the US dollar and the euro, along with regulatory diversity and catastrophe exposure that stretches well beyond domestic natural perils. Every financial metric that follows should be read against this global footprint, not against a purely Australian frame.
The combined operating ratio, or COR, is the single most important number for judging whether an insurer is earning its keep. It measures the proportion of every premium dollar consumed by claims and operating expenses. A COR below 100% means the underwriting business is profitable on its own terms, before a single dollar of investment income is counted.
QBE reported a COR of 93.1% for FY2025 (released 20 February 2026). A COR below 100% means the underwriting operations are profitable on their own terms, before a single dollar of investment income is counted.
That 93.1% figure represents a meaningful improvement and sits comfortably in profitable territory. Management has guided toward a further tightening to approximately 92.5% for 2026, signalling continued underwriting discipline.
The trajectory from 93.1% to 92.5% is where the operational story underpinning the share price rally gains genuine substance. It is also where the uncertainty lives. Three factors can push the COR in either direction:
Three balance sheet and return metrics, taken together, describe the financial character of the business behind the share price rally.
| Metric | CY24 Reported Figure | Context / Benchmark |
|---|---|---|
| Return on Equity (ROE) | 17.2% | Above the 10% threshold commonly cited for mature businesses |
| Debt-to-Equity | 27.0% | Conservative relative to sector; more equity than debt by a wide margin |
| Dividend Yield (5-year avg) | 2.8% | Below ASX income peer average, but forecast to rise to 4.5%-4.9% |
A 17.2% ROE for CY24 comfortably clears the 10% threshold and sits above QBE’s own medium-term target of 15%-plus, which is itself contingent on sustaining 3%-plus investment returns. The figure signals a business generating strong returns without relying on financial leverage to amplify them.
The 27% debt-to-equity ratio reinforces that reading. QBE holds considerably more equity than debt, which limits downside in a stress scenario. The trade-off is that the company is not amplifying returns through leverage, meaning the 17.2% ROE is being produced largely from operational performance rather than balance sheet engineering.
The five-year average yield of 2.8% looks modest relative to ASX income-focused peers. That figure, however, understates the forward income picture.
Analyst forecasts point to a dividend yield of approximately 4.5%-4.9% for the coming period, which would reframe QBE more attractively for yield-seeking investors. This is a forecast, not a guarantee, and depends on QBE delivering on its earnings guidance. Investors relying on the forward yield as a reason to buy should weigh that conditionality carefully.
The tailwinds behind QBE’s 21.8% rally are genuine, but the same conditions that carried the stock higher contain embedded risks.
Tailwinds supporting the current position:
Risk factors that could reverse the trajectory:
The macro environment that carried QBE’s share price higher is not permanent. Whether the current conditions are genuinely durable or cyclical determines whether entry at today’s levels is defensible.
For an insurer, the price-to-book ratio is the most appropriate primary valuation lens. QBE currently trades at a P/B of approximately 1.94-1.98 (as of May 2026), meaning the market is paying nearly twice the book value of equity for the franchise. A P/B approaching 2x implies investors are paying a meaningful premium for QBE’s earnings power and franchise quality.
| Valuation Metric | Current Reading | Implication for Investors |
|---|---|---|
| Price-to-Book | ~1.94-1.98x | Market paying a premium for franchise quality; limited room for further re-rating |
| Average Analyst Target vs Price | A$23.39 vs A$23.26 | Consensus implies approximately flat returns from current levels |
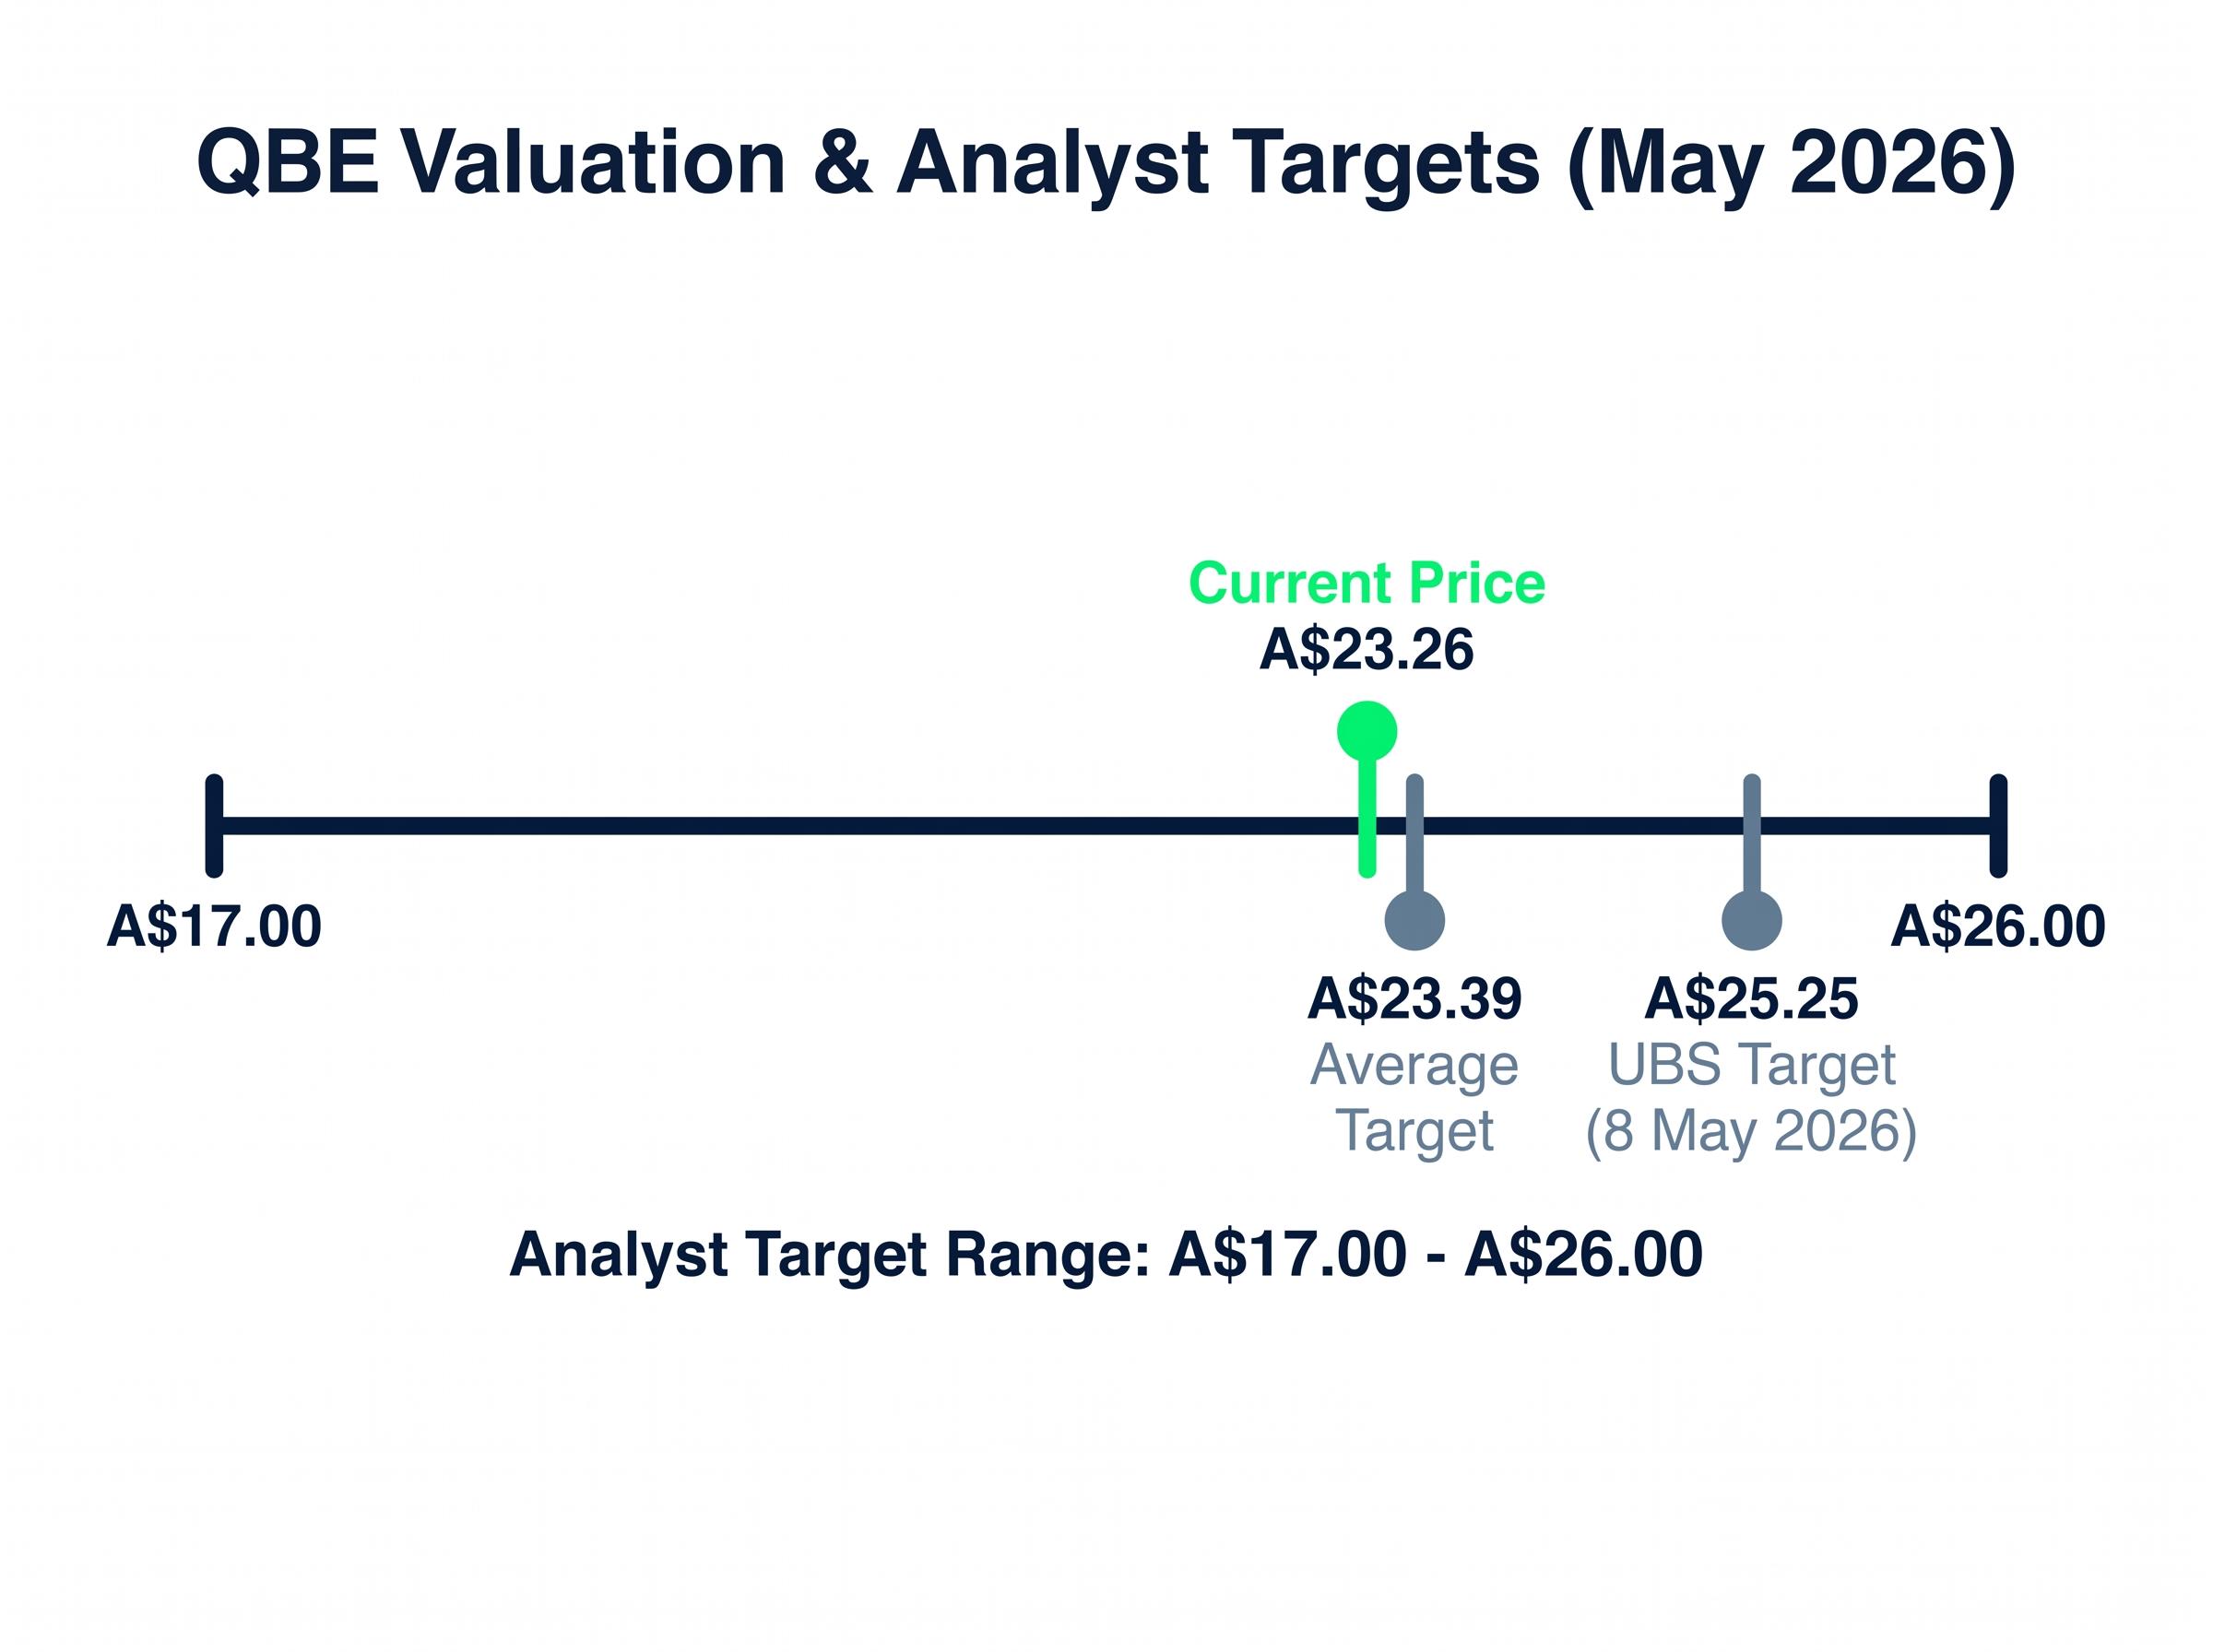
| Analyst Target Range | A$17.00 – A$26.00 | Wide spread signals genuine valuation uncertainty, not consensus certainty |
With 13 analysts at Outperform or Buy, the consensus is constructive. Yet the average 12-month target of A$23.39 sits only marginally above the current price, implying the market has already absorbed the operational improvement story.
UBS issued a Buy rating with a price target of A$25.25 on 8 May 2026, representing the more constructive end of the analyst range and offering approximately 8.5% upside from current levels.
The spread from A$17.00 to A$26.00 across the analyst range reflects genuine uncertainty, not settled conviction. That spread connects directly to the execution risks outlined above: catastrophe exposure, currency, and the durability of the rate environment. At a P/B of roughly 2x with consensus offering marginal upside, QBE is priced for continued operational execution, not for a further re-rating.
The operational improvement is credible. A COR trajectory moving from 93.1% toward 92.5%, a 17.2% ROE on a conservative balance sheet, and macro tailwinds from elevated rates all confirm that QBE’s 21.8% rally since the start of 2025 was not irrational. The business earned the move.
At A$23.26, however, the stock is broadly fairly valued on consensus assumptions. The average analyst target of A$23.39 leaves almost no margin of safety for new entrants. Investors buying today are paying for the improvement that has already occurred, not for incremental upside that the market has yet to recognise.
“QBE’s fundamentals justify the rally. Whether they justify the price today is a narrower question.”
For those already positioned, the forward dividend yield of approximately 4.5%-4.9% and continued operational discipline offer reasons to hold. For new entrants, the limited upside to consensus target, set against execution risks in catastrophe exposure, currency, and the rate environment, warrants caution.
This article is for informational purposes only and should not be considered financial advice. Investors should conduct their own research and consult with financial professionals before making investment decisions. Past performance does not guarantee future results. Financial projections are subject to market conditions and various risk factors.
A combined operating ratio (COR) measures the percentage of premium income consumed by claims and expenses; a COR below 100% means the insurer is profitable from underwriting alone, before investment income. QBE reported a COR of 93.1% for FY2025 and has guided for approximately 92.5% in 2026, signalling continued underwriting discipline.
Approximately 70% of QBE's total revenue is generated outside Australia, split roughly between the United States (30%) and Europe and other markets (40%), meaning shareholders carry material currency risk across the US dollar and the euro.
As of May 2026, QBE trades at a price-to-book ratio of approximately 1.94-1.98x, meaning investors are paying nearly twice the book value of equity; this level suggests the market has already priced in the operational improvement story, leaving limited room for further re-rating.
The three key downside risks are a rate-cutting cycle that compresses investment income (QBE's ROE target assumes 3%-plus investment returns), a severe catastrophe year that breaches the A$1,130 million allowance built into 2026 guidance, and currency volatility given that roughly 70% of revenue is earned outside Australia.
Analyst forecasts point to a forward dividend yield of approximately 4.5%-4.9% for the coming period, a significant step up from QBE's five-year average yield of 2.8%, though this depends on the company delivering on its earnings guidance.