
REA Group’s 42.8% Drop: Macro Selloff or Value Trap?
7 mins ago

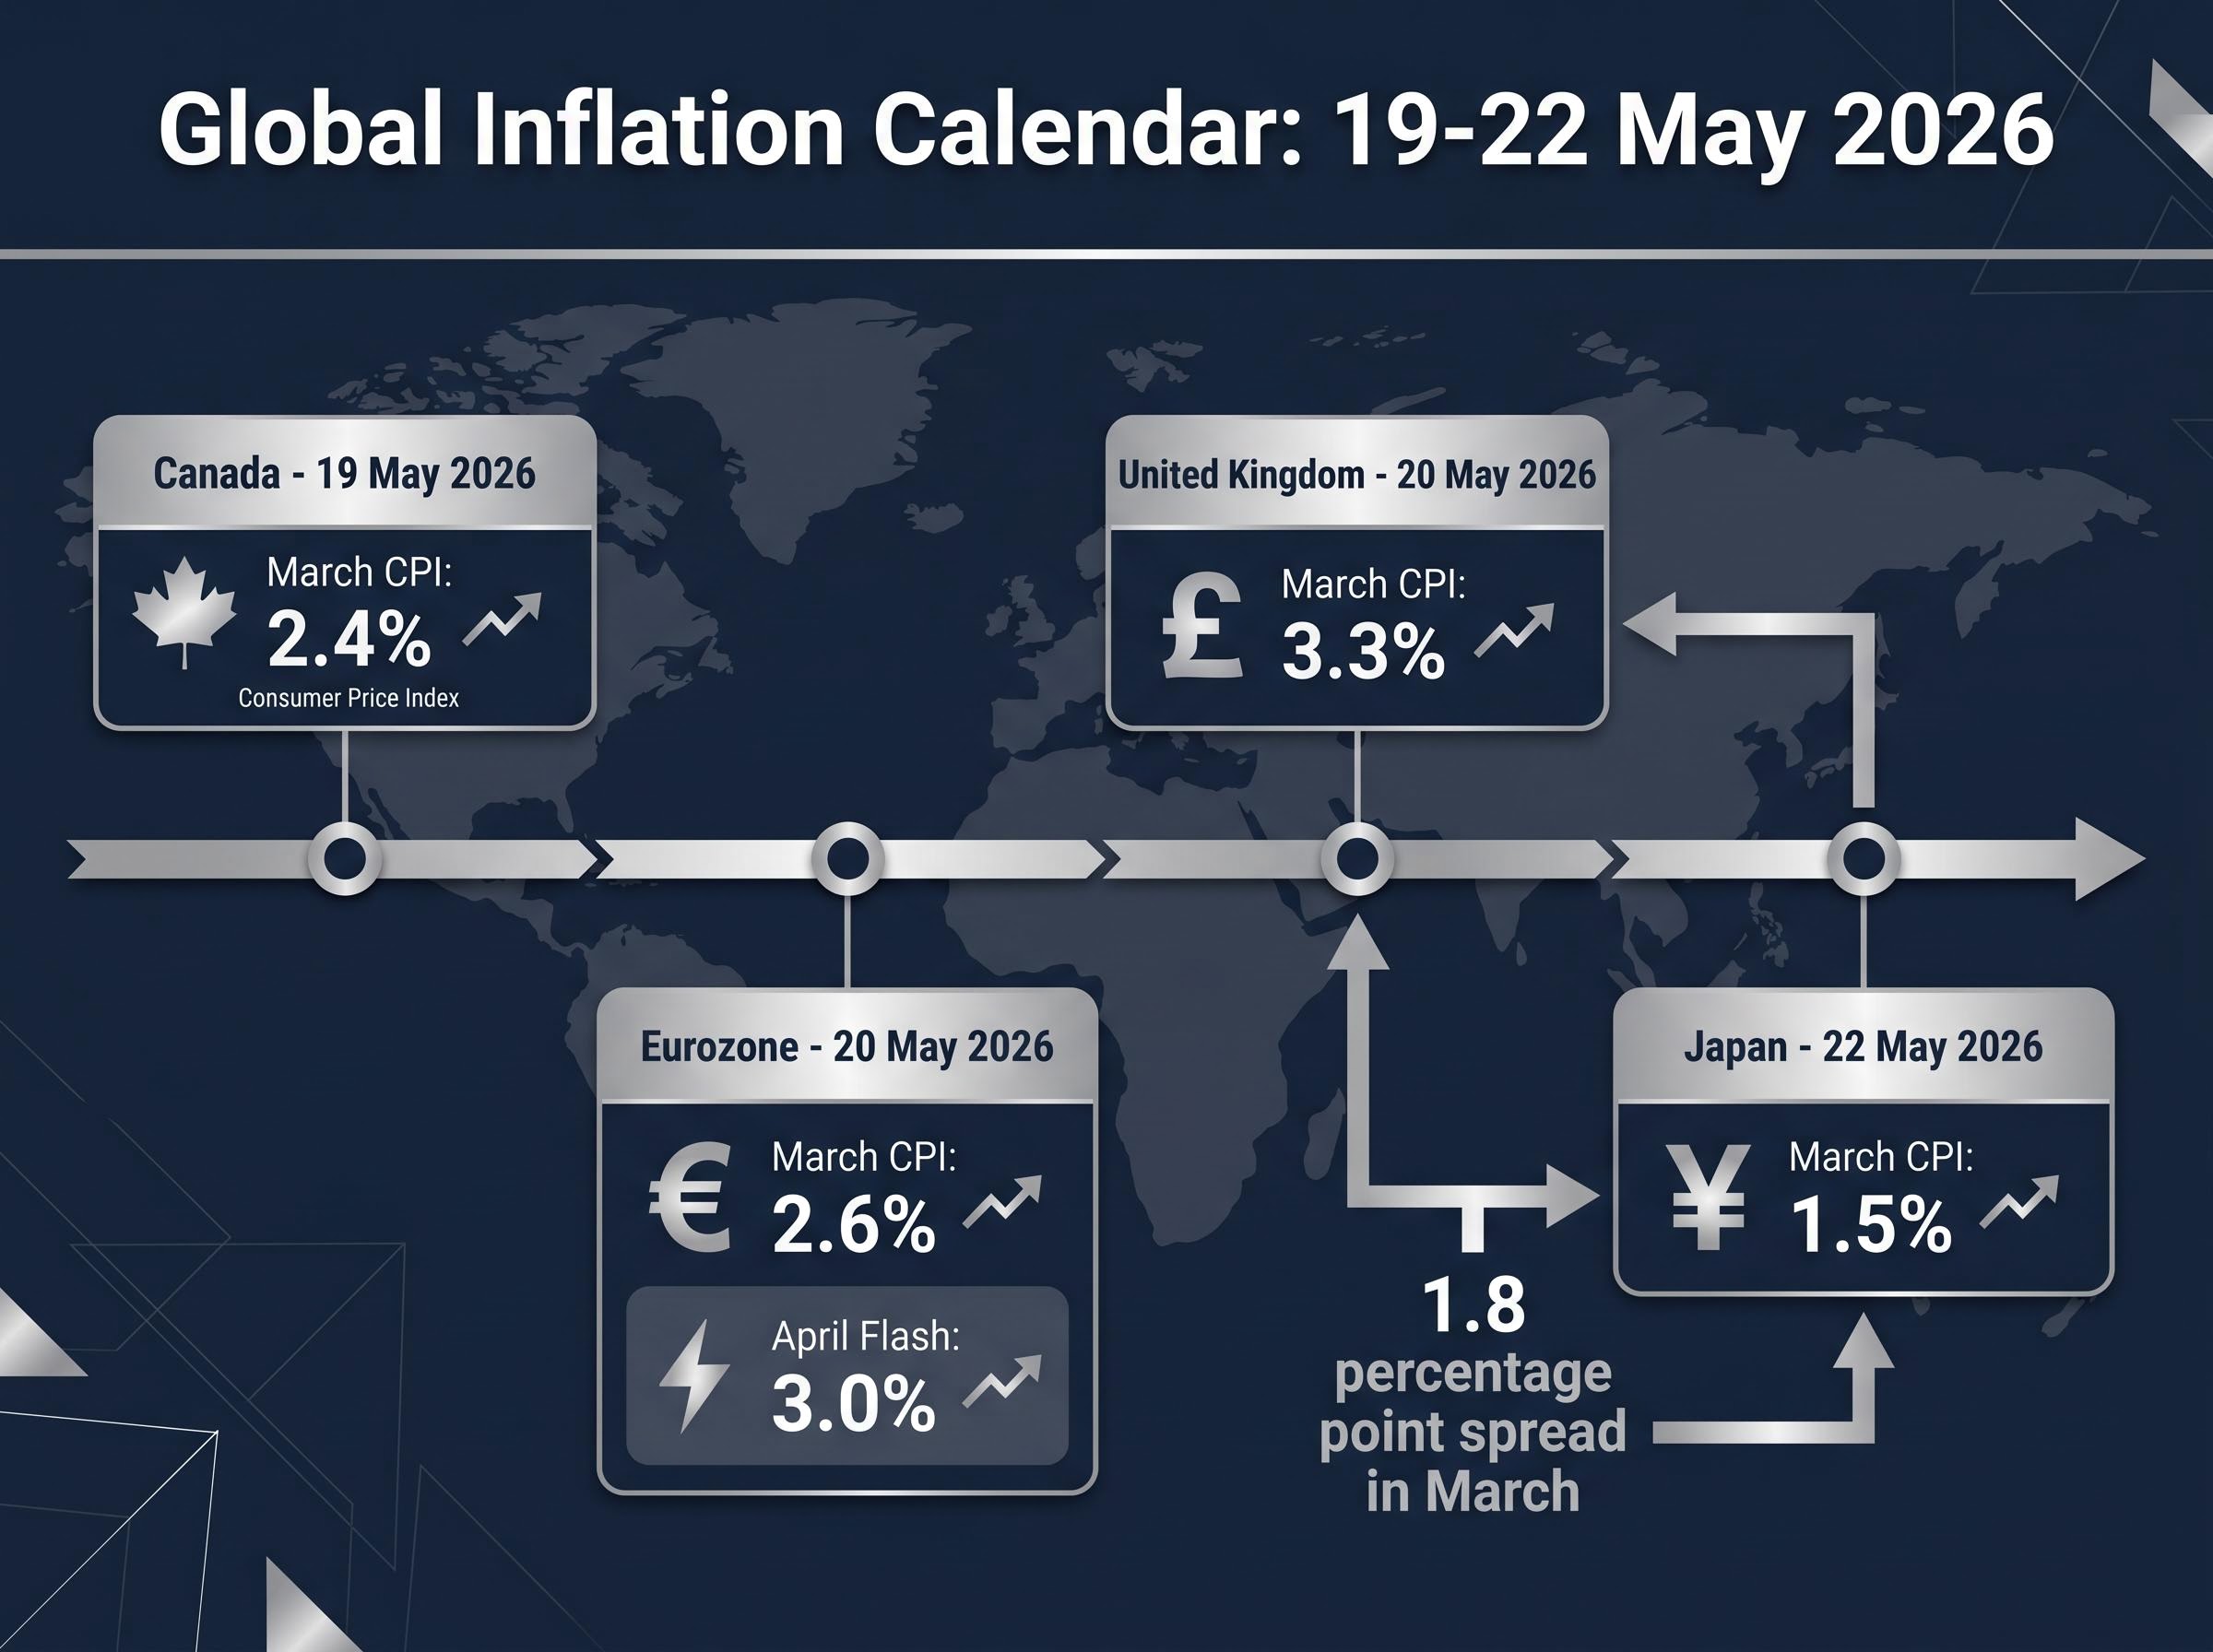
Four of the world’s major economies are releasing April inflation figures within a single week, and for investors tracking global inflation and investing implications, the timing creates a rare opportunity to read price pressures in aggregate. Canada reports on Tuesday 19 May, the eurozone and UK follow on Wednesday 20 May, and Japan closes the week on Friday 22 May. March readings already ranged from 3.3% in the UK to 1.5% in Japan, with the eurozone’s April flash estimate already showing an acceleration to 3.0%. Alongside the inflation calendar, the week delivers Federal Reserve minutes and a final consumer sentiment reading, both of which will generate headlines. What follows is a structured framework for reading the week’s data as a single cross-border picture, grounding it in the durable question of what inflation trends actually mean for equity investors over time.
Two secondary data releases will share the week’s headlines with inflation. Both deserve attention, and both deserve scepticism.
The University of Michigan’s preliminary May consumer sentiment reading came in at 48.2, a record low, down from 49.8 in the April final reading. The final May figure is due 22 May.
The number will attract alarmed coverage. It should not, on its own, attract alarmed portfolio decisions. Consumer sentiment has a structural tendency to track equity market performance and media tone rather than independent economic conditions, making it a reactive and lagging indicator. Periods of negative headlines produce negative sentiment readings, which then get reported as evidence that the economy is deteriorating, a feedback loop that tells investors more about mood than about output.
The minutes from the 28-29 April FOMC meeting are also due this week. The policy decision itself is already known: the committee held the federal funds rate at 3.5%-3.75% for the third consecutive meeting.
Miran’s dissent is the only new signal worth monitoring for shifts in internal committee dynamics. The broader minutes will be parsed for tone, but forecasting Fed moves based on edited deliberation summaries has a poor track record. Investors who understand the structural limitations of both the sentiment data and the Fed minutes are better positioned to avoid reactive decisions when the headlines arrive.
FOMC dissent dynamics in the April meeting went beyond the single Miran vote the committee’s public statement disclosed; with PCE running at 3.5% against a 2% target and unemployment rising simultaneously, the internal split reflected a genuine dual-mandate conflict that the minutes released this week are unlikely to fully resolve in either direction.
The sheer concentration of inflation releases in a five-day window is what makes the week analytically significant. Four major economies, each with distinct monetary policy settings and energy exposure, reporting within days of each other provides a cross-sectional snapshot that no single release can offer.
| Economy | March CPI (YoY) | April reading / status | Release date |
|---|---|---|---|
| Canada | 2.4% | Pending | 19 May 2026 |
| Eurozone | 2.6% | 3.0% (flash estimate, Eurostat) | 20 May 2026 |
| United Kingdom | 3.3% | Pending | 20 May 2026 |
| Japan | 1.5% | Tokyo core CPI: 1.5% | 22 May 2026 |
The eurozone is the only economy with an April number already published. Eurostat’s flash estimate, released 30 April 2026, showed Harmonised Index of Consumer Prices (HICP) jumping to 3.0% from 2.6% in March. That acceleration makes it the early signal for the week: if the remaining three economies print hotter as well, the picture shifts from isolated to coordinated.
Eurostat’s flash estimate, released 30 April 2026, showed Harmonised Index of Consumer Prices (HICP) jumping to 3.0% from 2.6% in March, confirming the eurozone as the first of the four economies to signal a meaningful acceleration in April price pressures.
Canada, with March CPI at 2.4%, and Japan, with national CPI at 1.5%, sit at opposite ends of the range heading into their April readings. Where each lands relative to March baselines will shape rate expectations in their respective economies within hours of release.
The eurozone’s April acceleration did not arrive in a vacuum. The jump from 2.6% to 3.0% was attributed largely to rising energy costs linked to Middle Eastern tensions, according to Eurostat’s flash estimate breakdown. That attribution matters because it points to a specific transmission mechanism rather than broad demand-driven overheating.
Start with the number, then work backward. European gas and oil import costs rose through late March and April as conflict-related disruptions tightened supply expectations. Those costs fed directly into the energy component of HICP. The question is whether the same mechanism is showing up in this week’s remaining releases, particularly in the UK (already printing at 3.3% in March, the highest of the four economies) and Japan, both of which are net energy importers.
The Hormuz risk premium embedded in current Brent crude prices, estimated by J.P. Morgan at roughly $40-50 per barrel above structural supply-demand fundamentals, is the specific mechanism feeding energy cost increases into eurozone and UK consumer price indices; without that premium resolving, the energy component of both economies’ inflation readings is unlikely to retreat quickly.
Energy-driven inflation spikes linked to geopolitical events have historically tended to be short-lived rather than persistent. The distinction between a transitory supply shock and a durable reacceleration in underlying prices carries material implications for central bank response, and by extension, for rate expectations and equity valuations.
That distinction is the analytical frame worth carrying into each release this week. If the UK’s April print holds near 3.3% or rises further, the question becomes whether the increase reflects energy pass-through (likely temporary) or broadening domestic price pressures (likely sticky). The same logic applies in reverse for Japan, where subdued demand has kept inflation anchored at 1.5% even as energy costs have risen elsewhere.
An investor watching only the UK’s April reading, or only Japan’s, sees a domestic data point. An investor watching all four in the same week sees something structurally different: a real-time map of whether price pressures are converging or diverging across major economies.
Cross-border capital mobility is the mechanism that makes this distinction matter. Global money flows respond to worldwide inflation conditions, not solely domestic ones. A bond investor in London reprices gilt yields based partly on where eurozone and US rates are heading. An equity fund manager in Tokyo weights global allocation decisions against relative real return expectations across regions.
The March baselines show meaningful divergence:
That is a 1.8 percentage point spread across four major economies. If April readings narrow the gap, it may signal that a common driver (energy costs, in this case) is synchronising inflation trajectories. If the spread widens, it suggests domestic factors are dominating, a scenario that implies more divergent central bank paths and, consequently, more divergent equity and currency market conditions.
Investors who anchor solely to one country’s inflation print risk misreading the broader conditions shaping bond yields, equity valuations, and currency movements in globally integrated portfolios. The aggregate view is not an abstraction; it is how capital actually moves.
Before the week’s data generates a fresh cycle of rate speculation and equity market anxiety, one historical relationship is worth anchoring to.
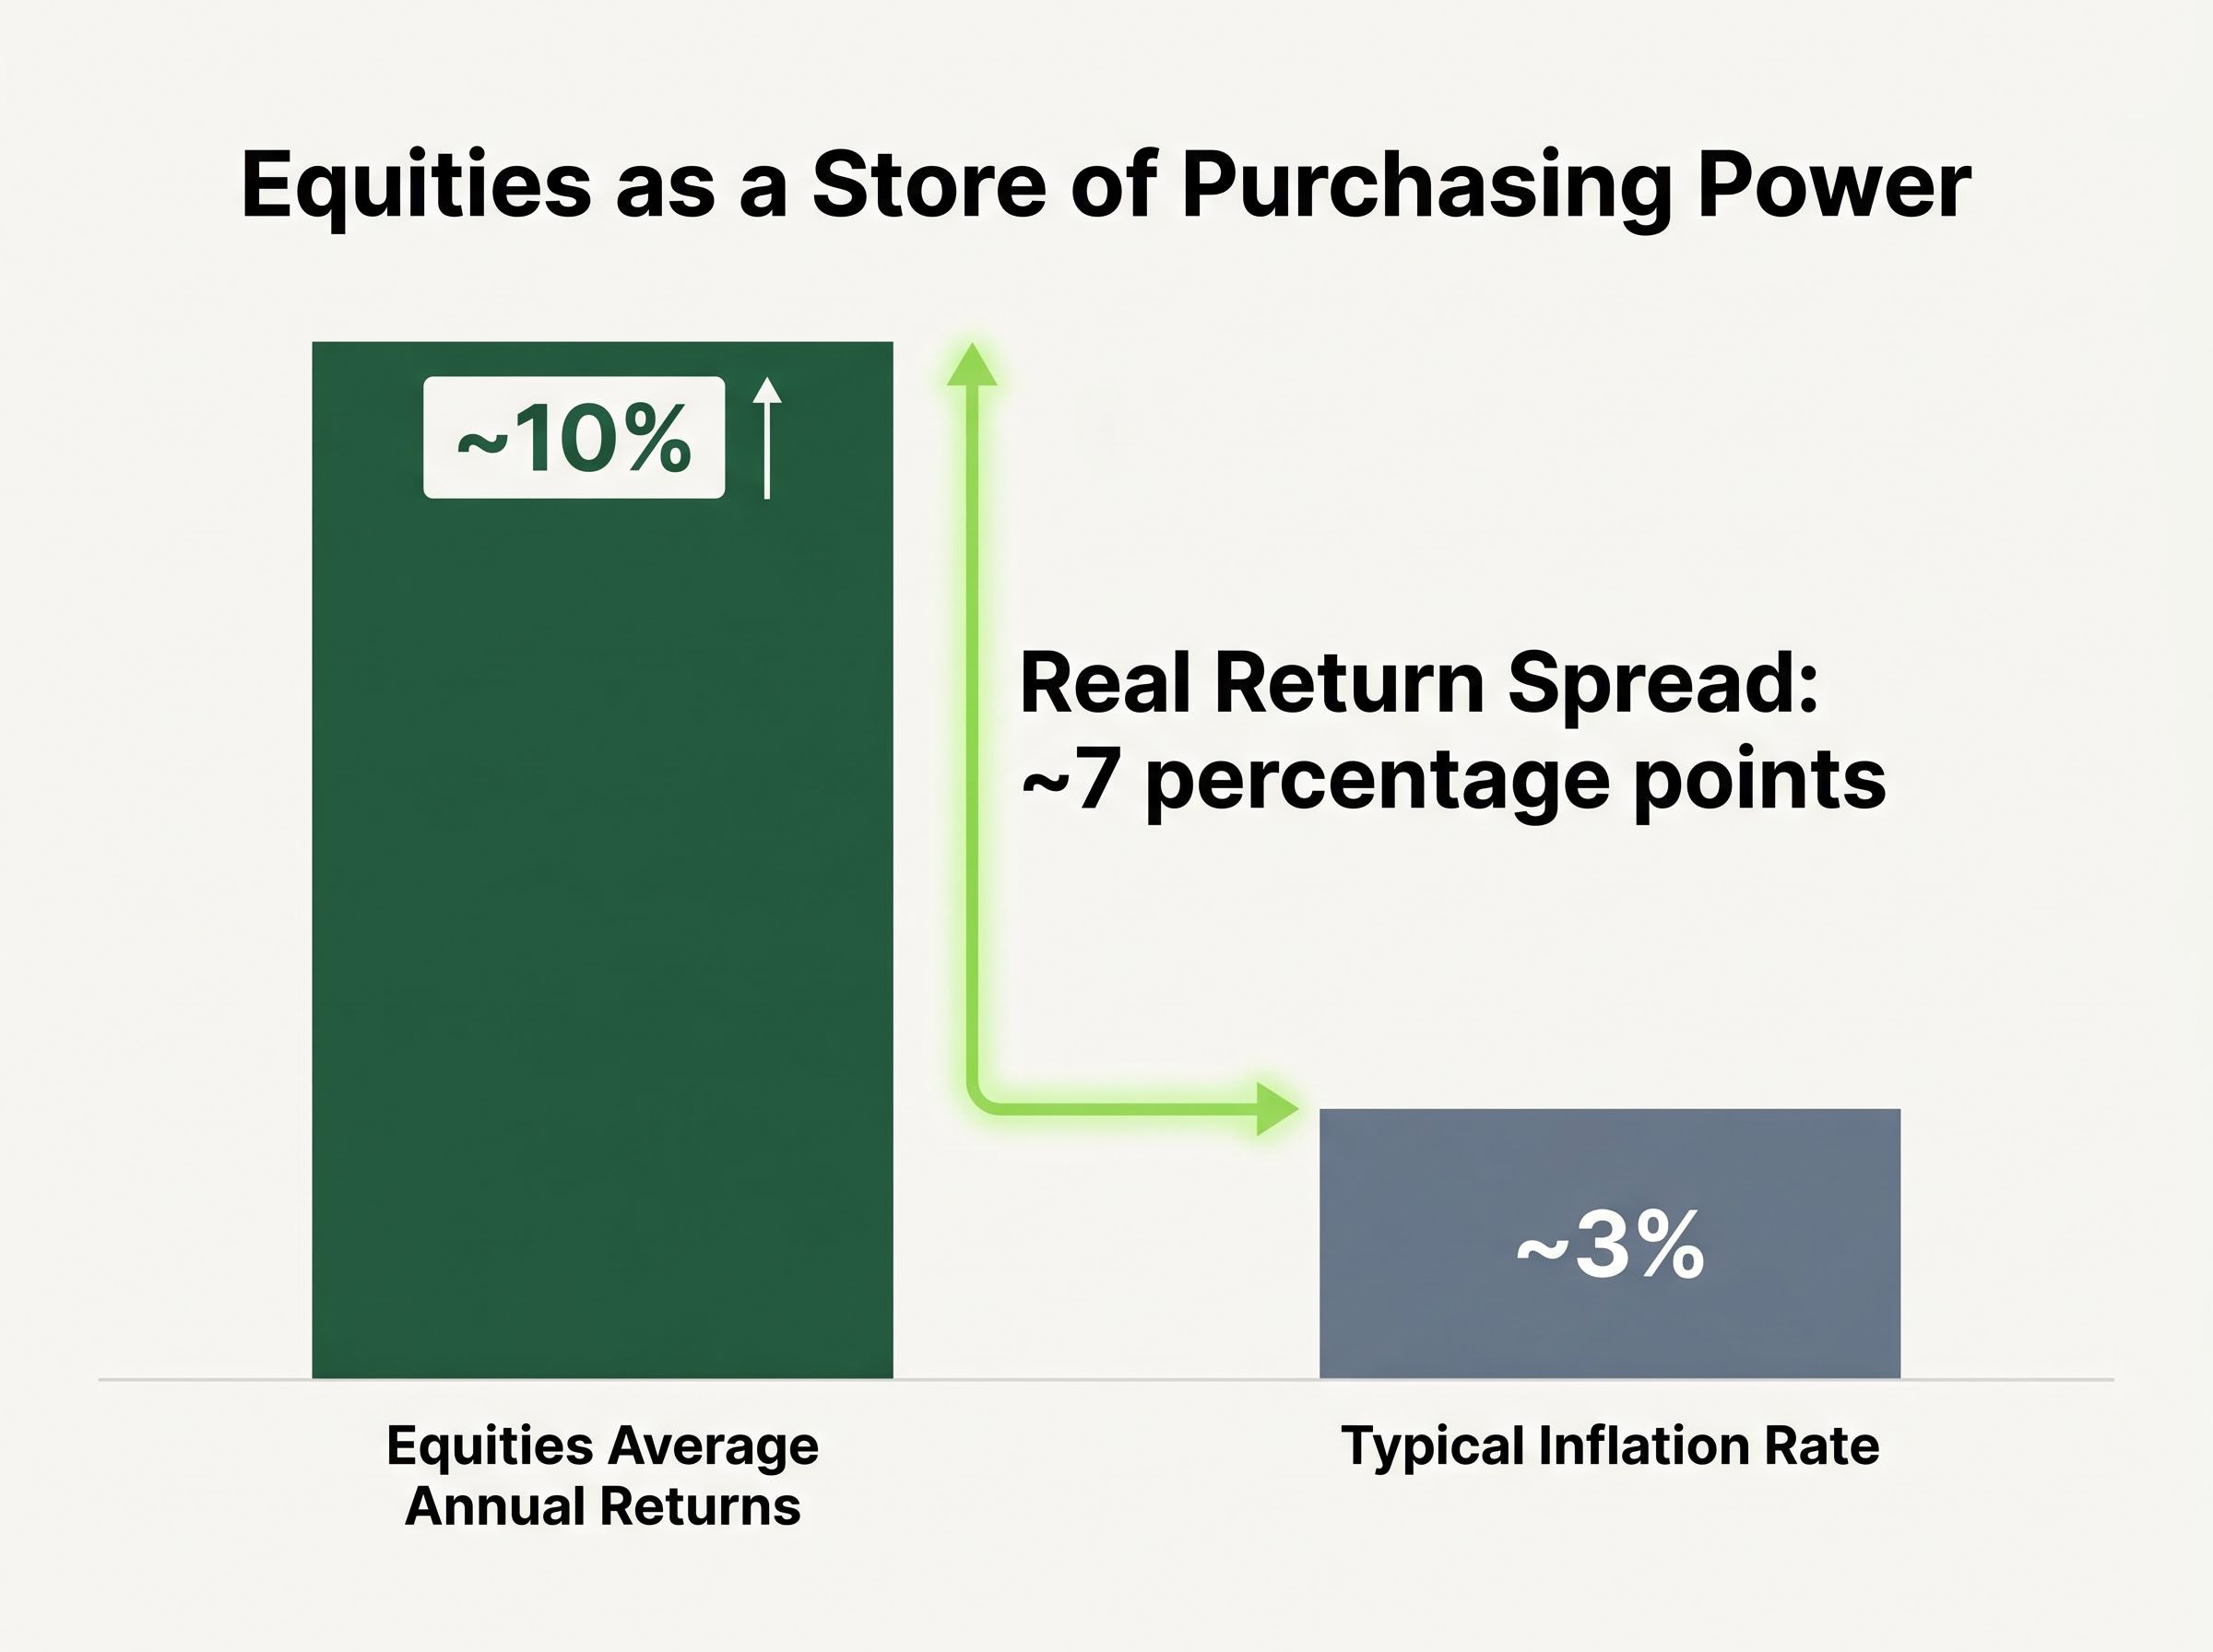
Equities have historically delivered average annual returns of approximately 10%, substantially outpacing the typical inflation rate of approximately 3%. The resulting spread of roughly 7 percentage points represents the real return investors have historically captured by holding equities through inflationary environments.
That figure, drawn from long-run market data spanning decades, is the structural case for equities as a store of purchasing power. It does not mean equities rise in every inflationary month, quarter, or even year. Short-term equity performance can diverge sharply from inflation trends in either direction. A single hot CPI print can trigger a sell-off; a cooler-than-expected reading can spark a rally. Neither response changes the long-run arithmetic.
Earnings multiple compression is the specific mechanical sequence through which persistently elevated CPI damages equity valuations: high inflation forces the Fed to hold real rates elevated, raising the discount rate applied to future earnings streams, which systematically reduces price-to-earnings multiples even when underlying corporate earnings remain intact.
This distinction between long-run hedging capacity and short-run correlation noise is where many investors lose discipline. The question this week is not whether inflation is 2.4% in Canada or 3.0% in the eurozone. The question is whether equities remain the structurally superior long-run asset class for preserving purchasing power. Decades of data suggest they do, which positions this week’s releases as inputs for updating a macro view rather than triggers for portfolio repositioning.
Past performance does not guarantee future results. Financial projections are subject to market conditions and various risk factors.
The week of 18 May 2026 delivers an unusually concentrated set of signals: inflation readings from four major economies, Federal Reserve minutes from the April meeting, and a final consumer sentiment figure. Taken together, they form a snapshot of prevailing expectations, not a verdict on market direction.
The analytical frame that holds across all of these releases is straightforward. Markets are driven by the gap between expectations and reality. The significance of any single data point this week depends on how far it lands from what is already priced in. A eurozone final reading that confirms the 3.0% flash estimate moves markets less than a UK print that overshoots or undershoots consensus by a meaningful margin.
For equity investors with long time horizons, the historical record offers a durable anchor: approximately 10% average annual returns through decades that included inflationary surges, rate hiking cycles, and geopolitical shocks. That track record does not counsel ignoring this week’s data. It counsels using the data to update understanding of the macro environment, not to time trades around individual prints.
This article is for informational purposes only and should not be considered financial advice. Investors should conduct their own research and consult with financial professionals before making investment decisions.
Global inflation refers to rising price levels across multiple major economies simultaneously. It matters for equity investors because elevated inflation forces central banks to hold real interest rates higher, which increases the discount rate applied to future earnings and compresses price-to-earnings multiples even when corporate earnings remain intact.
Canada reports on 19 May, the eurozone and UK both report on 20 May, and Japan closes the week on 22 May, creating an unusually concentrated cross-border inflation snapshot within a single five-day window.
Over the long run, equities have delivered average annual returns of approximately 10%, substantially outpacing the typical inflation rate of around 3%, producing a real return spread of roughly 7 percentage points for investors who held through inflationary environments.
Eurostat's flash estimate attributed the jump from 2.6% in March to 3.0% in April largely to rising energy costs linked to Middle Eastern geopolitical tensions, which tightened supply expectations and fed directly into the energy component of the Harmonised Index of Consumer Prices.
Consumer sentiment readings, such as the University of Michigan's record-low preliminary May figure of 48.2, tend to track equity market performance and media tone rather than independent economic conditions, making them a reactive and lagging indicator that reflects mood more than output.