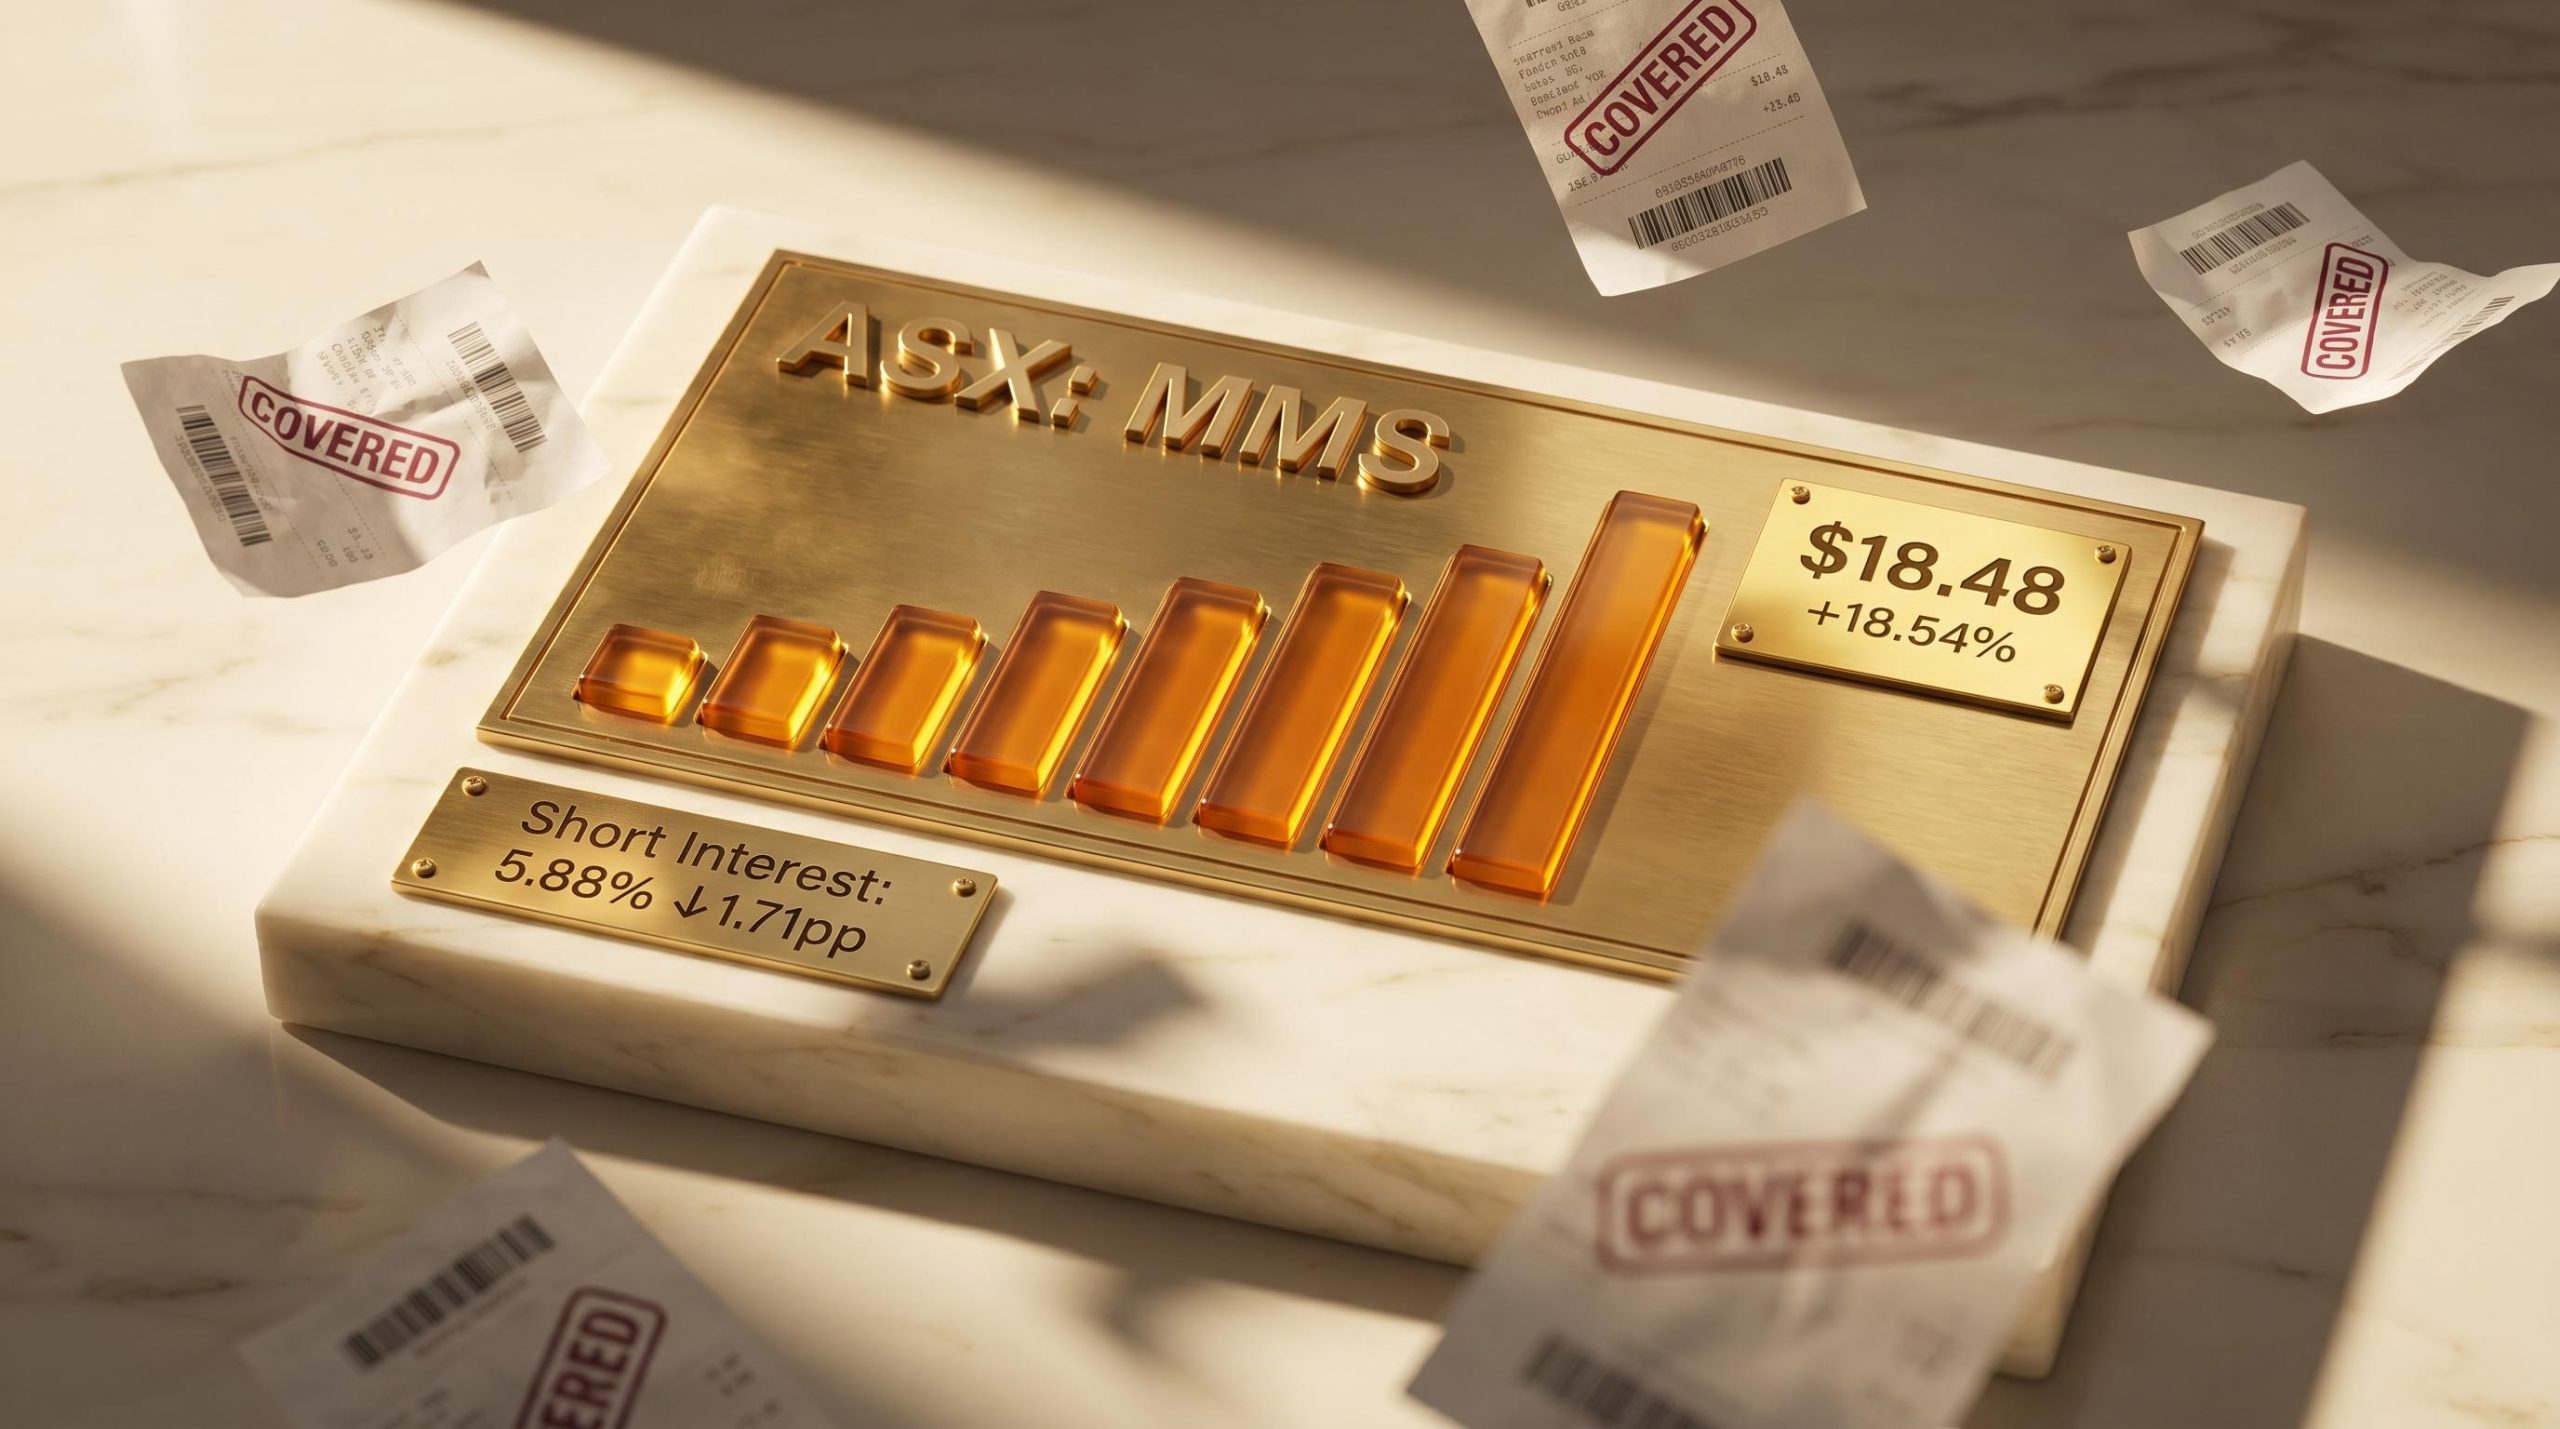
McMillan Shakespeare gained 18.5% over eight consecutive trading days without a single market-sensitive announcement. The explanation lies not in what the company did, but in what its short sellers stopped doing.
Short covering sits on the overlooked side of the most shorted ASX stocks conversation. Retail investors routinely track which names carry the highest short interest, but the week-on-week reductions in those positions carry their own signal: institutional bears are stepping back, and the mechanics of their exit can amplify price moves sharply. The week ending 12 May 2026 produced a cluster of notable short-covering episodes across financials, resources, and data-centre infrastructure.
What follows explains what short covering is, why it matters, and what the current data from MMS, DigiCo Infrastructure REIT, Mineral Resources, and the broader covered-shorts list reveals about where institutional sentiment may be shifting right now.
McMillan Shakespeare’s eight-day sprint and what drove it
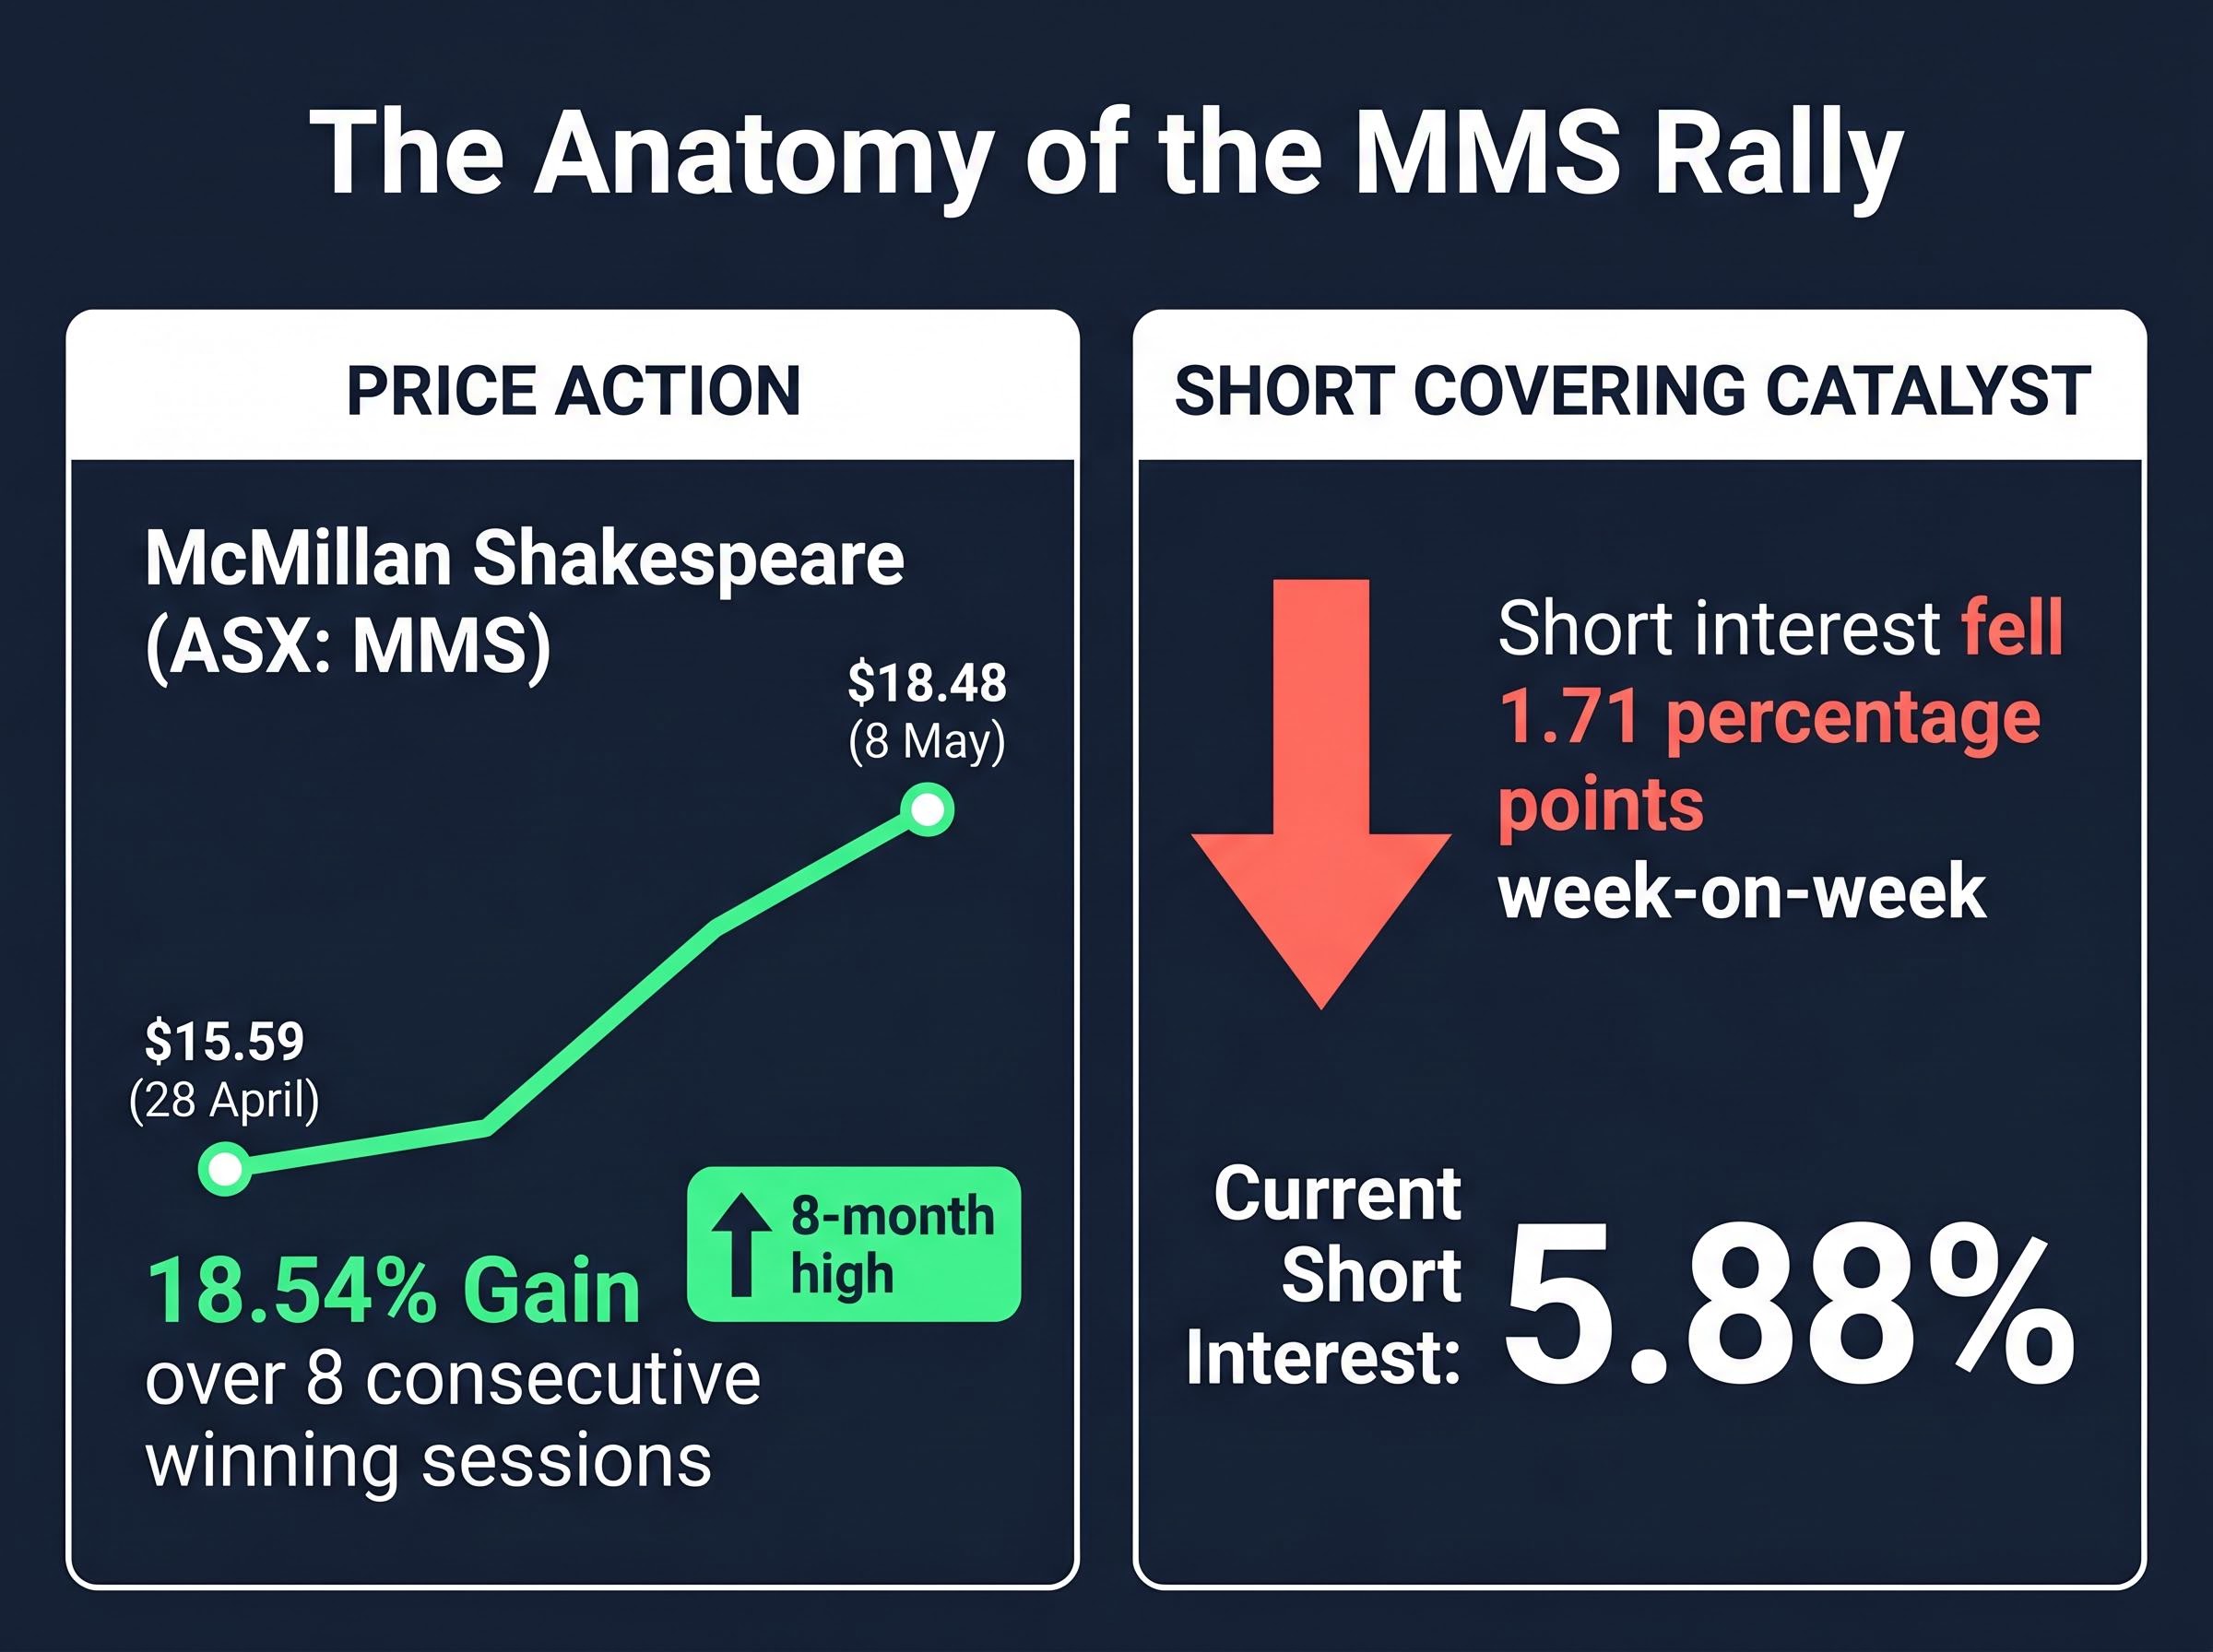
McMillan Shakespeare (ASX: MMS) closed at $15.59 on 28 April and at $18.48 by 8 May, a gain of 18.54% that pushed the stock to an eight-month high. Eight consecutive winning sessions produced one of the ASX’s most striking rallies of the period.
No price-sensitive announcement explains the move. A review of MMS’s recent ASX releases shows only routine items: dividend notices, DRP documentation, and director dealings. Nothing in the filings describes an earnings upgrade, buyback, or material transaction within that window.
The Market Index Short Seller Series, compiled by Kerry Sun, attributes the rally to short-covering mechanics. Short interest fell approximately 1.71 percentage points week-on-week to 5.88%, and is down 2.66 percentage points over the month. That pace of reduction points to sustained bearish capitulation in a previously crowded short trade on salary packaging and novated leasing names.
Three components combined to produce the rally:
- Elevated prior short positioning, which created a large pool of shares that needed to be bought back
- Absence of a new fundamental catalyst, meaning no fresh sellers arrived to absorb the demand
- The resulting price amplification as multiple short sellers competed to close positions simultaneously
McMillan Shakespeare gained 18.5% over eight consecutive trading days, reaching an eight-month high, as short interest fell 1.71 percentage points in a single week.
The MMS case illustrates a dynamic retail investors rarely anticipate: a stock can rise sharply without new fundamental information simply because short sellers are forced to buy back stock at the same time.
When big ASX news breaks, our subscribers know first
What short covering actually means and why the data has limits
Short interest figures appear in weekly round-ups across Australian financial media, yet directional changes in those figures receive far less attention than the absolute levels. Understanding what a reduction actually signals, and where the data falls short, is the interpretive framework the rest of this analysis depends on.
How short covering works mechanically
A short seller borrows shares and sells them on market, betting the price will fall. To close the position, the short seller must buy back the same number of shares and return them to the lender. That buy-back injects demand into the order book.
When multiple short sellers cover at the same time, the demand compounds. The process follows three steps:
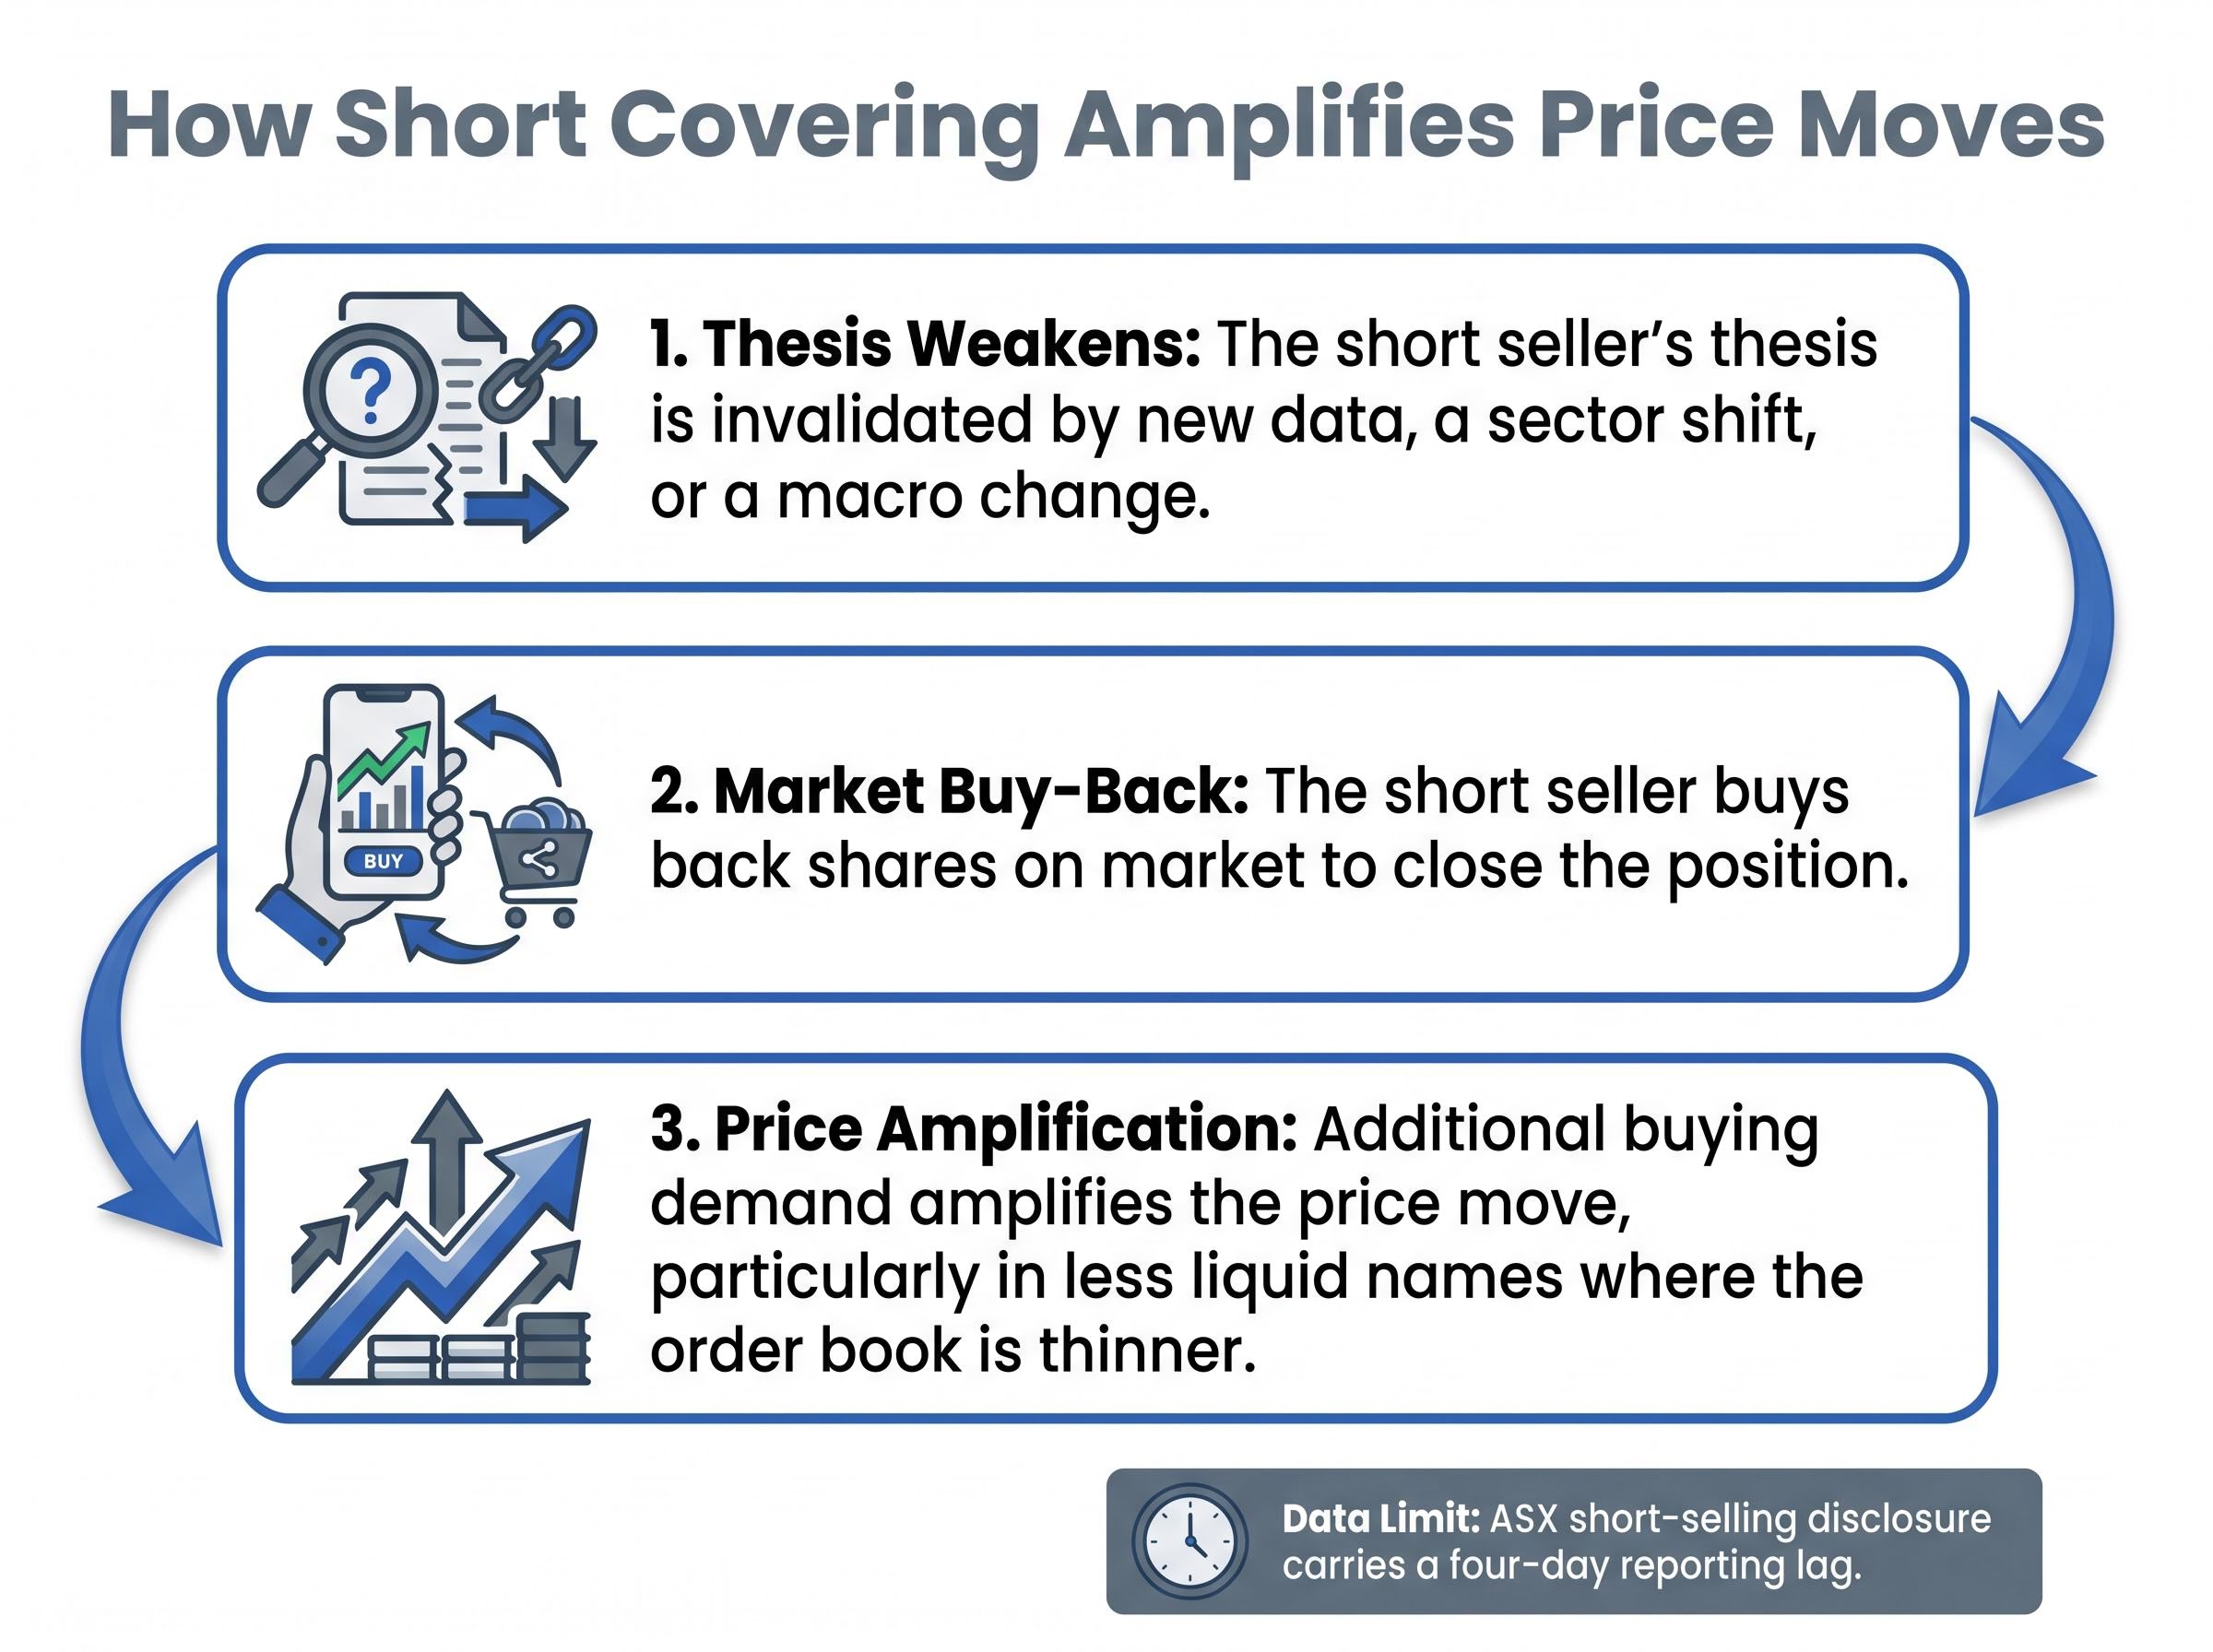
- The short seller’s thesis weakens or is invalidated by new data, a sector shift, or a macro change
- The short seller buys back shares on market to close the position
- The additional buying demand amplifies the price move, particularly in less liquid names where the order book is thinner
What the data cannot tell you
ASX short-selling disclosure carries a four-day reporting lag. Positions are not required to be reported until three business days after the transaction, meaning the data published on 18 May 2026 reflects trades completed up to 12 May 2026. Conditions may have shifted since.
ASIC’s short position reporting requirements mandate that short positions be reported three business days after the transaction date, with public disclosure following one day later, meaning the figures published on 18 May 2026 reflect trades completed no later than 12 May 2026.
A reduction in short interest signals that institutional bears are becoming less confident in their negative thesis. It does not automatically constitute a buy signal. As Livewire Markets contributors have noted, investors should verify whether a stock has simply bounced to fair value or whether new fundamental information supports the move. Short covering is best understood as a sentiment shift, not a fundamental endorsement.
For readers who want to understand the regulatory scaffolding before diving into the data, our full explainer on short selling and ASIC reporting covers how Australia’s covered short framework operates, why naked short selling is prohibited, and what the Macquarie Securities $35 million penalty in March 2026 reveals about the reliability of the short interest figures that investors use every week.
DigiCo and Mineral Resources: sector forces doing the heavy lifting
Where MMS rallied without an identifiable macro or company catalyst, DigiCo Infrastructure REIT (ASX: DGT) and Mineral Resources (ASX: MIN) tell a different story. Both experienced notable short covering in the week ending 12 May 2026, but in each case, a clear sector-level driver was doing the work.
| Stock | Short Interest (12 May) | Week-on-Week Change | Primary Covering Catalyst |
|---|---|---|---|
| DGT | 6.39% | -0.82% | Falling bond yields; improved sentiment toward rate-sensitive data-centre REITs |
| MIN | 4.72% | -0.59% | Stabilising lithium prices; firm iron ore on Chinese policy support |
DGT, a data-centre REIT with approximately 172 MW of planned IT capacity across Australia and North America, saw short interest fall 0.82 percentage points week-on-week, though it remains up 0.28 percentage points on a monthly basis. Market Index and The Market Herald link the move to easing Australian bond yields and a broader re-rating of “bond proxy” sectors, including REITs and infrastructure names, that had been punished during the prior rate-hike cycle. No discrete company announcement triggered the shift.
MIN recorded a 0.59 percentage point weekly reduction in short interest to 4.72%, down 1.54 percentage points month-on-month. The driver, according to AFR resources commentary and Market Index sector notes, is the combination of stabilising lithium prices after a prolonged slump and firm iron ore supported by Chinese restocking expectations. No single MIN-specific announcement has been identified as the trigger.
“When everyone is on one side of the boat, the smallest positive surprise can trigger a sharp short-covering rally.”
AFR market commentary, April-May 2026
The contrast with MMS is instructive. Recognising that macro forces, not company press releases, drove short covering in DGT and MIN allows an investor to assess whether those macro forces are likely to persist, a more durable basis for evaluating the signal.
The full covered-shorts picture: 12 other names where bears are stepping back
The MMS, DGT, and MIN cases sit within a broader pattern. The Market Index Short Seller Series for the week ending 12 May 2026 records short-interest reductions across 12 additional ASX-listed names, spanning financials, consumer goods, resources, technology, and infrastructure.
| Stock (ASX Code) | Sector | Short Interest (12 May 2026) | Week-on-Week Change | Month-on-Month Change |
|---|---|---|---|---|
| MMS | Financials | 5.88% | -1.71% | -2.66% |
| IPD | Healthcare | 0.47% | -1.17% | -0.11% |
| BRG | Consumer Discretionary | 8.64% | -0.85% | -0.73% |
| DGT | Infrastructure REIT | 6.39% | -0.82% | +0.28% |
| IPH | Professional Services | 8.96% | -0.80% | -0.32% |
| BOQ | Financials | 4.48% | -0.80% | +1.16% |
| GDG | Financials | 9.32% | -0.62% | +3.34% |
| DYL | Resources | 5.87% | -0.60% | -0.02% |
| MIN | Resources | 4.72% | -0.59% | -1.54% |
| TNE | Technology | 2.15% | -0.59% | -0.13% |
| GNC | Consumer Staples | 2.93% | -0.55% | +0.94% |
| BGA | Consumer Staples | 1.19% | -0.50% | -0.42% |
The breadth of the list is itself a signal. Several names within it carry nuances that the headline figures alone do not capture:
- Breville Group (BRG) saw a 0.85 percentage point weekly reduction, but absolute short interest remains elevated at 8.64%, suggesting the bearish thesis has eased rather than been abandoned
- IPH still carries 8.96% short interest despite the weekly covering, one of the highest levels on the list, indicating continued institutional scepticism toward the intellectual property services sector
- Generation Development Group (GDG) recorded a weekly reduction of 0.62 percentage points, yet month-on-month short interest is up 3.34%, meaning the weekly covering occurred within a larger trend of bears building positions
- Bank of Queensland (BOQ) saw short interest fall 0.80 percentage points week-on-week but rise 1.16 percentage points month-on-month, illustrating that weekly covering can occur within a broader bearish trend
At the lower end of the spectrum, Technology One (TNE) and Bega Cheese (BGA) carry relatively modest short interest, where weekly reductions are smaller in magnitude but may still reflect the same broad sentiment shift visible across the rest of the list.
The macro tide lifting all covered boats: rates, commodities, and risk appetite
The diversity of sectors on the covered-shorts list points toward a common driver. When short covering spans financials, consumer discretionary, resources, technology, and infrastructure in the same week, stock-specific explanations are insufficient. The macro backdrop tells the broader story.
Domestic drivers: rates and commodities
Three forces operated simultaneously in the week ending 12 May 2026:
- Interest rates near peak: The RBA’s tightening cycle appears at or near its end, with markets pricing potential rate cuts for 2026-27. Australian bond yields drifted lower through early to mid-May, directly benefiting rate-sensitive names such as DGT and supporting the broader re-rating of duration-exposed sectors
- Iron ore holding firm: Chinese policy support and restocking expectations kept iron ore prices above recent lows, reducing downside risk for MIN and other resource names that shorts had positioned against
- Lithium stabilisation: After a prolonged slump, lithium prices showed signs of finding a floor in late April and early May, sparking renewed interest in beaten-down lithium equities and weakening the bearish thesis on lithium-exposed producers
RBA monetary policy decisions through the current tightening cycle have been a dominant influence on rate-sensitive ASX sectors, with the Board’s stated focus on returning inflation to the 2-3% target band shaping market expectations around the timing and pace of any future easing.
Global backdrop: US markets and risk appetite
Internationally, resilient US equity markets and subdued volatility supported global risk assets. Expectations that the US Federal Reserve is near its own peak tightening cycle contributed to a risk-on environment that extended to the ASX. According to Livewire Markets, the S&P/ASX Emerging Companies Index (XEC) outperformed the ASX 200 by approximately 35% over the prior year, reflecting a sustained bid for smaller, higher-beta names, many of which had been heavily shorted.
When macro forces remove multiple pillars of the bearish thesis simultaneously, the result is broad-based short covering rather than isolated stock-specific events. That breadth is itself a signal worth tracking.
What the covered-shorts data means for investors watching the ASX this week
The week’s data tells a coherent story: a broad reduction in short positions across diverse ASX sectors, led by an 18.5% price rally in MMS, represents a measurable shift in institutional sentiment from decidedly bearish toward neutral or cautiously constructive. Three anchor cases illustrate three different types of short-covering catalyst: MMS (no identifiable trigger), DGT (rate-sensitive sector re-rating), and MIN (commodity stabilisation).
Before treating any short-covering signal as a basis for action, two questions apply:
- Has the macro or sector catalyst driving the covering persisted or strengthened? If Australian bond yields resume climbing or lithium prices reverse, the thesis behind the covering weakens
- Has the stock’s short interest fallen enough to reduce squeeze risk, or does substantial short interest remain? Names such as GDG at 9.32% and IPH at 8.96% still carry high absolute short interest even after weekly reductions, meaning the institutional bearish thesis has not been fully abandoned
Short covering signals a shift from decisively bearish toward neutral or less bearish. It does not automatically constitute a new bull case.
Short-covering data is best used as a secondary signal alongside fundamental analysis, not as a standalone indicator. For an investor tracking these figures week to week, understanding whether the macro backdrop is durable or fleeting is the difference between spotting a genuine sentiment shift and mistaking a temporary squeeze for a fundamental re-rating.
Investors wanting to track how the May 2026 institutional repositioning evolved will find our detailed coverage of the prior week’s short positioning, which documents the oil, gas, gold, and lithium covering that preceded the broader cross-sector unwind, alongside Telix Pharmaceuticals holding the highest short interest on the ASX at 16.10% and GDG’s short interest surging from 4% to 9.40% in under six weeks.
Short interest as an early warning signal cuts in both directions: the same institutional positioning that predicts coming price weakness when bears are building can reveal potential covering rallies when those positions begin unwinding, a dynamic that played out in Lotus Resources and Generation Development Group in the weeks before both stocks moved sharply.
This article is for informational purposes only and should not be considered financial advice. Investors should conduct their own research and consult with financial professionals before making investment decisions. Past performance does not guarantee future results.