Hundreds of US ETFs carry labels like “quality,” “momentum,” and “value,” collectively managing hundreds of billions of dollars. Most investors who own them have never read the academic papers that gave those words meaning. Factor investing, the practice of targeting specific stock characteristics that academic research links to higher long-term returns, is one of the more consequential ideas to travel from university finance departments into retail portfolios over the past three decades. The core claim is straightforward: certain measurable traits of stocks, such as cheapness relative to fundamentals or recent price strength, have reliably predicted returns across decades and geographies. Yet the gap between how factors are marketed and what the evidence actually says is wide enough to cost investors real money. What follows traces the intellectual origins of factor investing, explains the mechanics of the major factors in plain language, examines what recent market cycles reveal about their limits, and gives retail investors a framework for evaluating factor-based products critically rather than accepting backtested claims at face value.
From beta to a zoo: how academic research built the factor framework
The story begins with a single variable. The Capital Asset Pricing Model (CAPM) proposed that market beta, a stock’s sensitivity to overall market movements, was the sole driver of expected returns. It was elegant. It was also empirically fragile; too much return variation across stocks went unexplained.
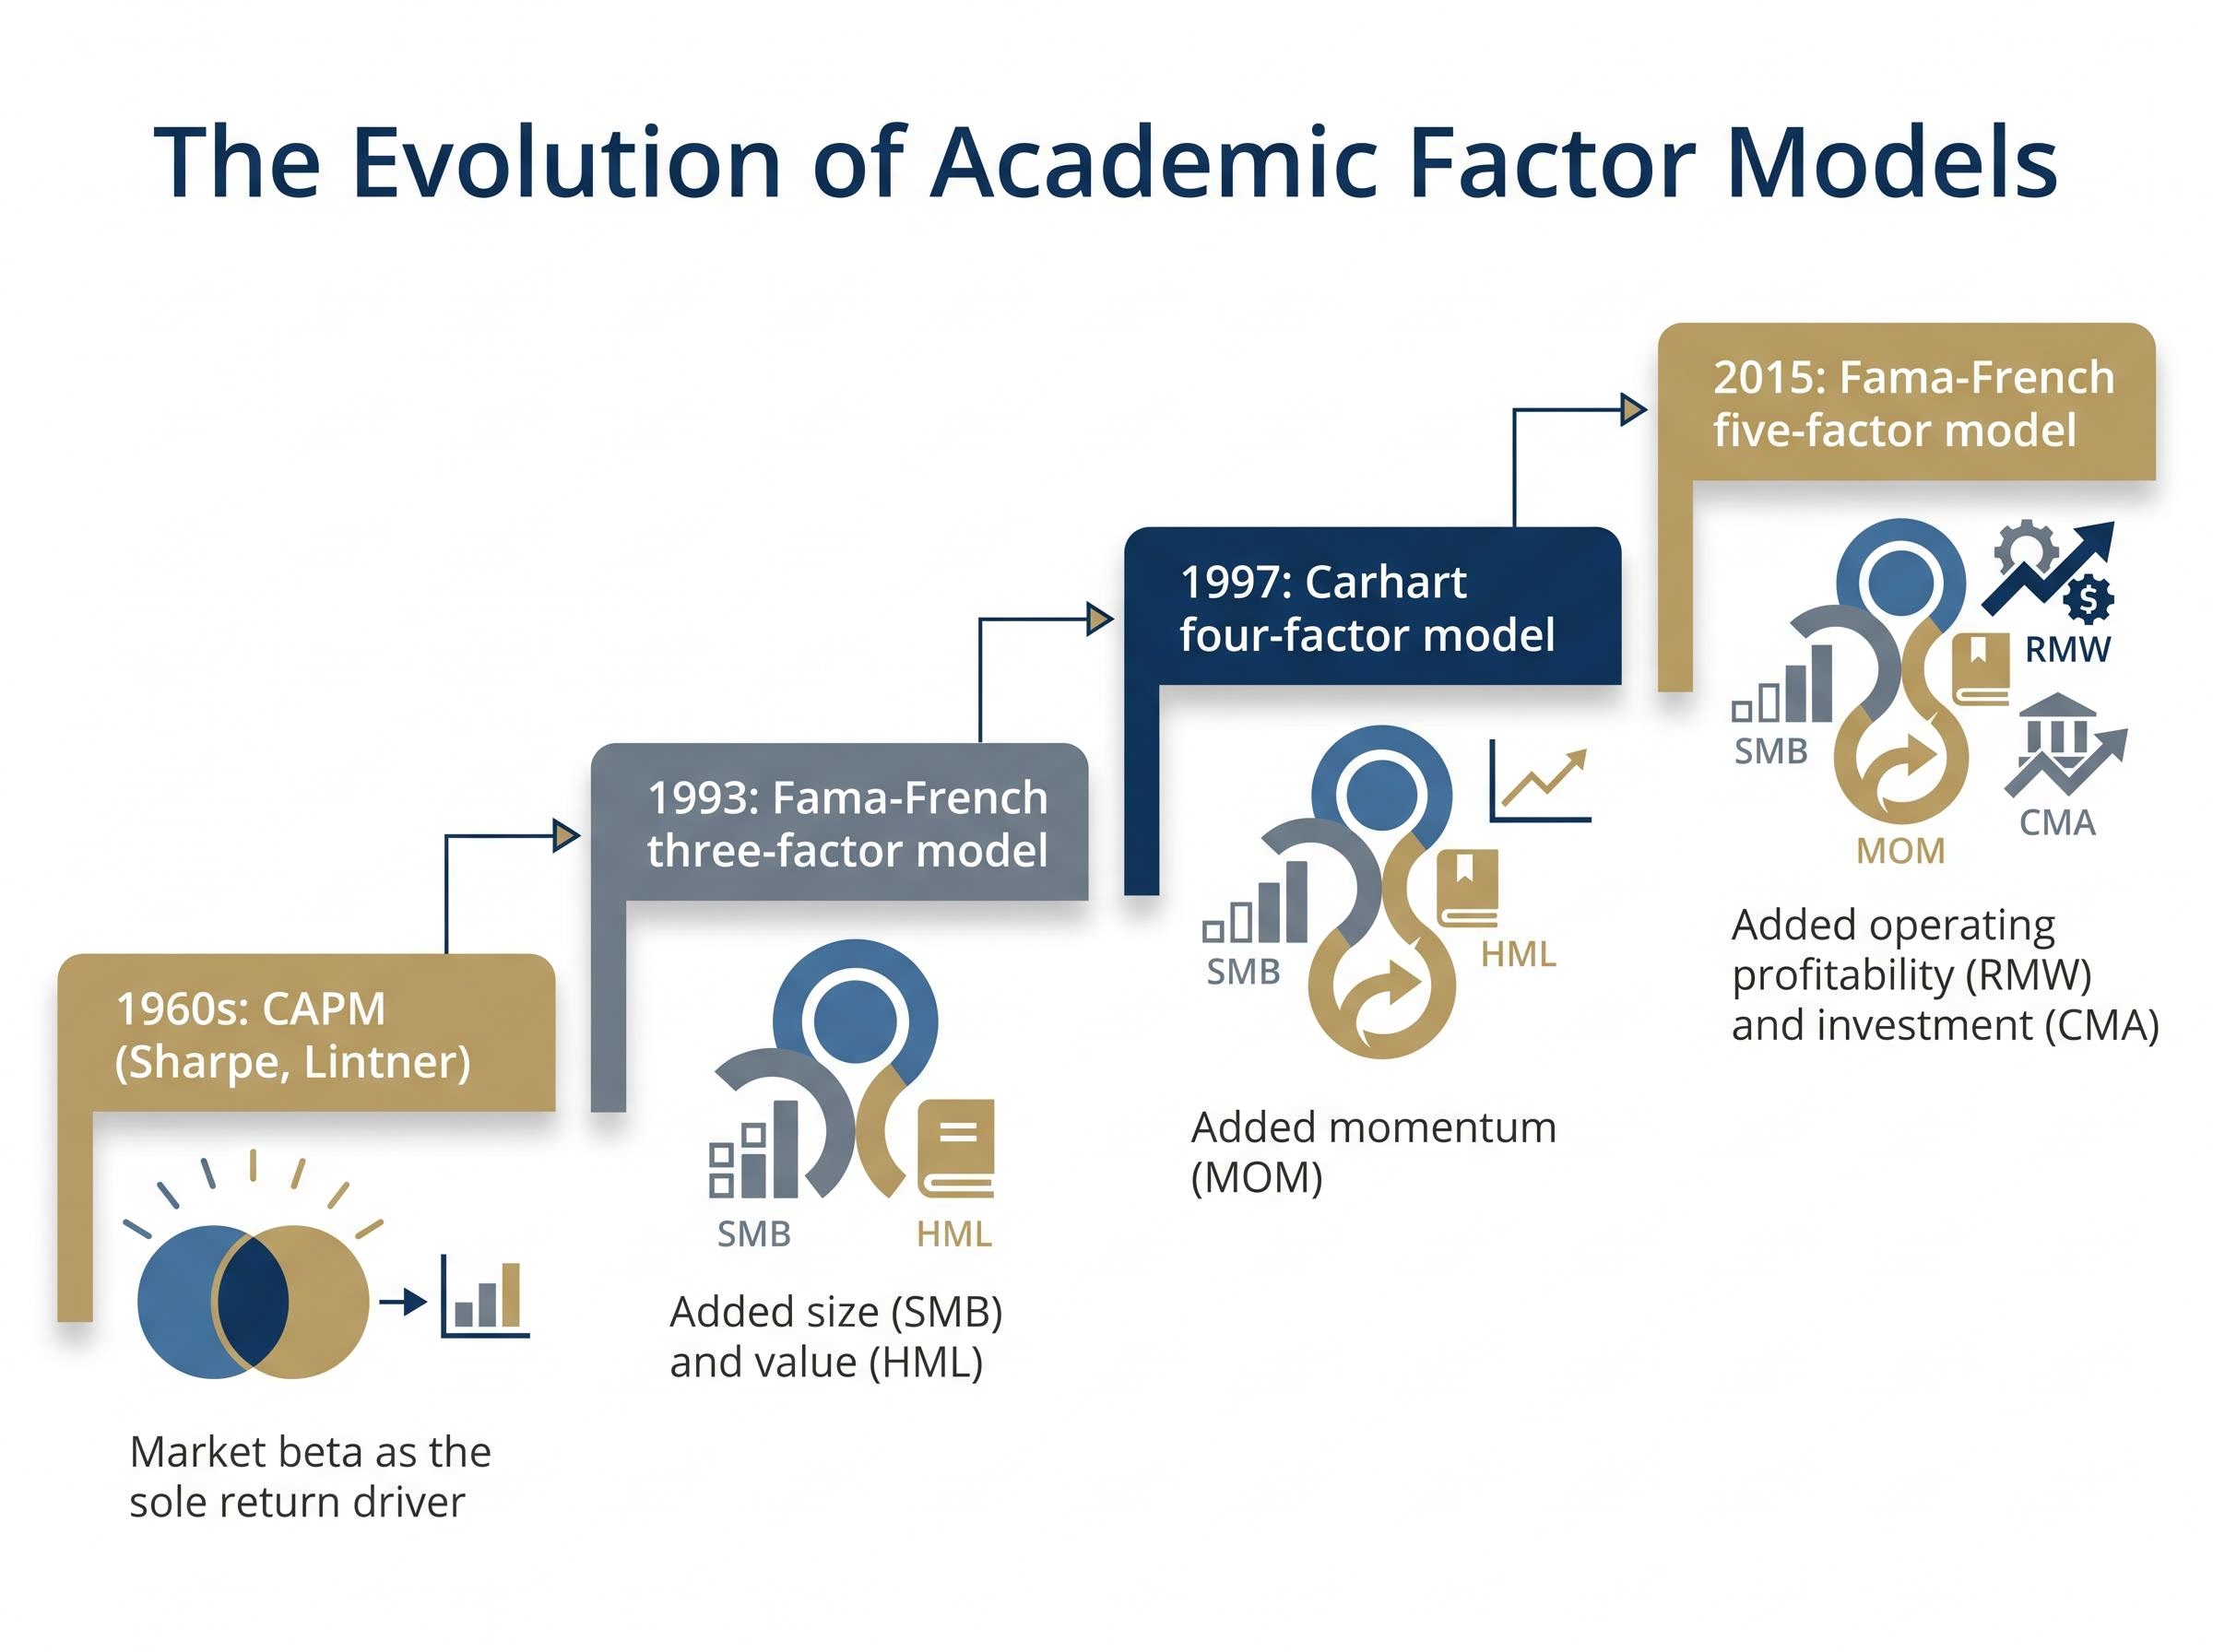
In 1993, Eugene Fama and Kenneth French published their three-factor model, adding two new variables to market beta. The first was size (SMB, or “small minus big”), capturing the tendency of smaller companies to outperform larger ones. The second was value (HML, or “high minus low”), capturing the tendency of cheap stocks, measured by book-to-market ratios, to outperform expensive ones. The model explained far more of the variation in stock returns than CAPM alone.
Each subsequent model emerged because the prior one left anomalies on the table:
- CAPM (Sharpe, Lintner, 1960s): market beta as the sole return driver
- Fama-French three-factor model (1993): added size (SMB) and value (HML) to market beta
- Carhart four-factor model (1997): added momentum (MOM), the tendency of recent winners to keep winning temporarily
- Fama-French five-factor model (2015): added operating profitability (RMW) and investment (CMA), capturing the outperformance of firms with stronger profitability and more conservative capital spending
Each addition was not arbitrary. Each addressed a persistent pattern the prior model could not explain away.
The factor zoo problem
The five or six factors above are not the end of the story. Academic researchers, armed with computing power and expanding datasets, published hundreds of candidate factors over the following decade. Harvey, Liu, and Zhu documented this proliferation, arguing that most of these published factors are statistical artefacts of data mining rather than genuine economic mechanisms.
Statistical significance in a historical dataset does not equal an exploitable return premium. The criteria that separate a real factor from noise are demanding: a plausible economic rationale for why the premium exists, successful out-of-sample replication across different geographies and time periods, and survival after realistic transaction cost modelling. Most published factors fail at least one of these tests. The major five or six factors that underpin the US ETF market passed them, which is why they persist in both academic literature and investable products.
When big ASX news breaks, our subscribers know first
What the major factors actually are, and why they are supposed to work
Each factor begins with a measurable characteristic. Value targets stocks trading at low prices relative to fundamentals (price-to-book, price-to-earnings, or cash-flow yield ratios). Size targets smaller companies by market capitalisation. Momentum targets stocks with strong recent price performance. Quality (or profitability) targets firms with high operating profitability and conservative capital deployment. Low volatility targets stocks with below-average price fluctuation.
The debate over why these premiums exist is unresolved, and the resolution matters. Two competing explanations run through the academic literature for each factor. The risk-based view holds that investors earn a premium for bearing a systematic risk the market cannot diversify away; value stocks, for instance, may be cheap because they are genuinely riskier businesses. The behavioural view holds that investors systematically misprice certain characteristics due to cognitive biases; momentum, for example, may persist because investors underreact to new information.
The size premium itself has been complicated by a structural quality deficit embedded in broad small-cap indexes: AQR research confirms the premium is real but concentrated in higher-quality small-cap stocks, meaning passive broad index exposure systematically dilutes the premium by including unprofitable and speculative names that private capital has been unwilling to absorb.
The distinction is practical. If a premium is compensation for risk, it should persist indefinitely. If it is a behavioural mispricing, it could shrink as more investors learn to exploit it. No single factor outperforms the broad market every calendar year, and long-term commitment to a factor strategy is not optional but structural.
| Factor | What it measures | Typical explanation for persistence | Known weakness |
|---|---|---|---|
| Value | Low price relative to fundamentals (P/B, P/E, cash-flow yield) | Compensation for distress risk; behavioural overreaction to bad news | Extended drawdowns lasting a decade or more |
| Size | Smaller companies by market capitalisation | Illiquidity premium; less analyst coverage leads to mispricing | Premium has weakened in recent decades in US data |
| Momentum | Strong recent price performance (typically 6-12 months) | Investor underreaction to new information; herding effects | Prone to sharp reversals (“momentum crashes”) |
| Quality / Profitability | High operating profitability, conservative investment | Market undervalues earnings persistence; lower bankruptcy risk | Narrow sector concentration (often technology-heavy) |
| Low Volatility | Below-market price fluctuation | Lottery preference bias; leverage constraints for institutions | Lags materially in speculative, high-beta bull markets |
Two ETFs carrying the same factor label can behave very differently if their definitions of that characteristic diverge from the academic benchmark. Understanding the signal behind the label is the first step toward evaluating whether a product delivers genuine factor exposure.
How factor portfolios are actually built
The distance between an academic paper and a rules-based ETF is larger than most investors realise. An academic factor model identifies a characteristic that predicts returns. A fund manager must then translate that signal into a portfolio that can be bought, held, rebalanced, and taxed, and every step in that translation involves tradeoffs.
The typical construction process follows a sequence:
- Define the investable universe (e.g., the S&P 500 or Russell 1000)
- Rank stocks by the target factor signal (e.g., price-to-book for value, trailing 12-month returns for momentum)
- Normalise scores to remove distortions from outliers or sector clustering
- Apply portfolio constraints such as sector caps or single-stock concentration limits
- Select a weighting method (equal weight, inverse-volatility, risk parity, or optimisation-based)
- Set rebalancing frequency and rules for ongoing monitoring
Constraints matter more than investors typically appreciate. A quality screen applied without sector controls can inadvertently concentrate the portfolio in technology stocks, turning a factor bet into a sector bet. A momentum screen without volatility limits can become a high-beta position that amplifies drawdowns.
Rebalancing frequency creates its own tradeoff. Slow-moving factors like value and quality need less frequent rebalancing than faster signals like momentum. Higher turnover directly increases trading costs and tax drag, particularly in taxable accounts. Momentum and multi-factor strategies can generate substantially higher turnover than broad market index funds.
Long-run construction quality matters. S&P Dow Jones Indices data covering approximately 15 years through April 2026 shows that both the Quality and Quality FCF Aristocrats indices outperformed the S&P 500 on both return and volatility measures. These results reflect the compounding benefit of well-constructed, rules-based factor methodologies applied consistently over full market cycles.
What recent market cycles reveal about factor performance in practice
2022 was the year factor investors had been waiting for. Rising interest rates punished high-multiple growth stocks and rewarded the cheap, defensive names that populate value and low-volatility portfolios. Both factors outperformed the S&P 500.
Then 2023 arrived and reversed nearly everything. A small group of mega-cap technology companies, widely referred to as the Magnificent 7, dominated S&P 500 returns. Factor indices, which by construction underweight these names relative to a capitalisation-weighted benchmark, lagged across the board.
Cap-weighted concentration amplifies factor underperformance in both directions: when five mega-cap technology stocks drove more than 70% of the S&P 500’s first-quarter 2026 decline and then delivered more than half of April’s recovery, every factor portfolio that underweighted those names by construction experienced a structural headwind that had nothing to do with whether its underlying factor signal was working.
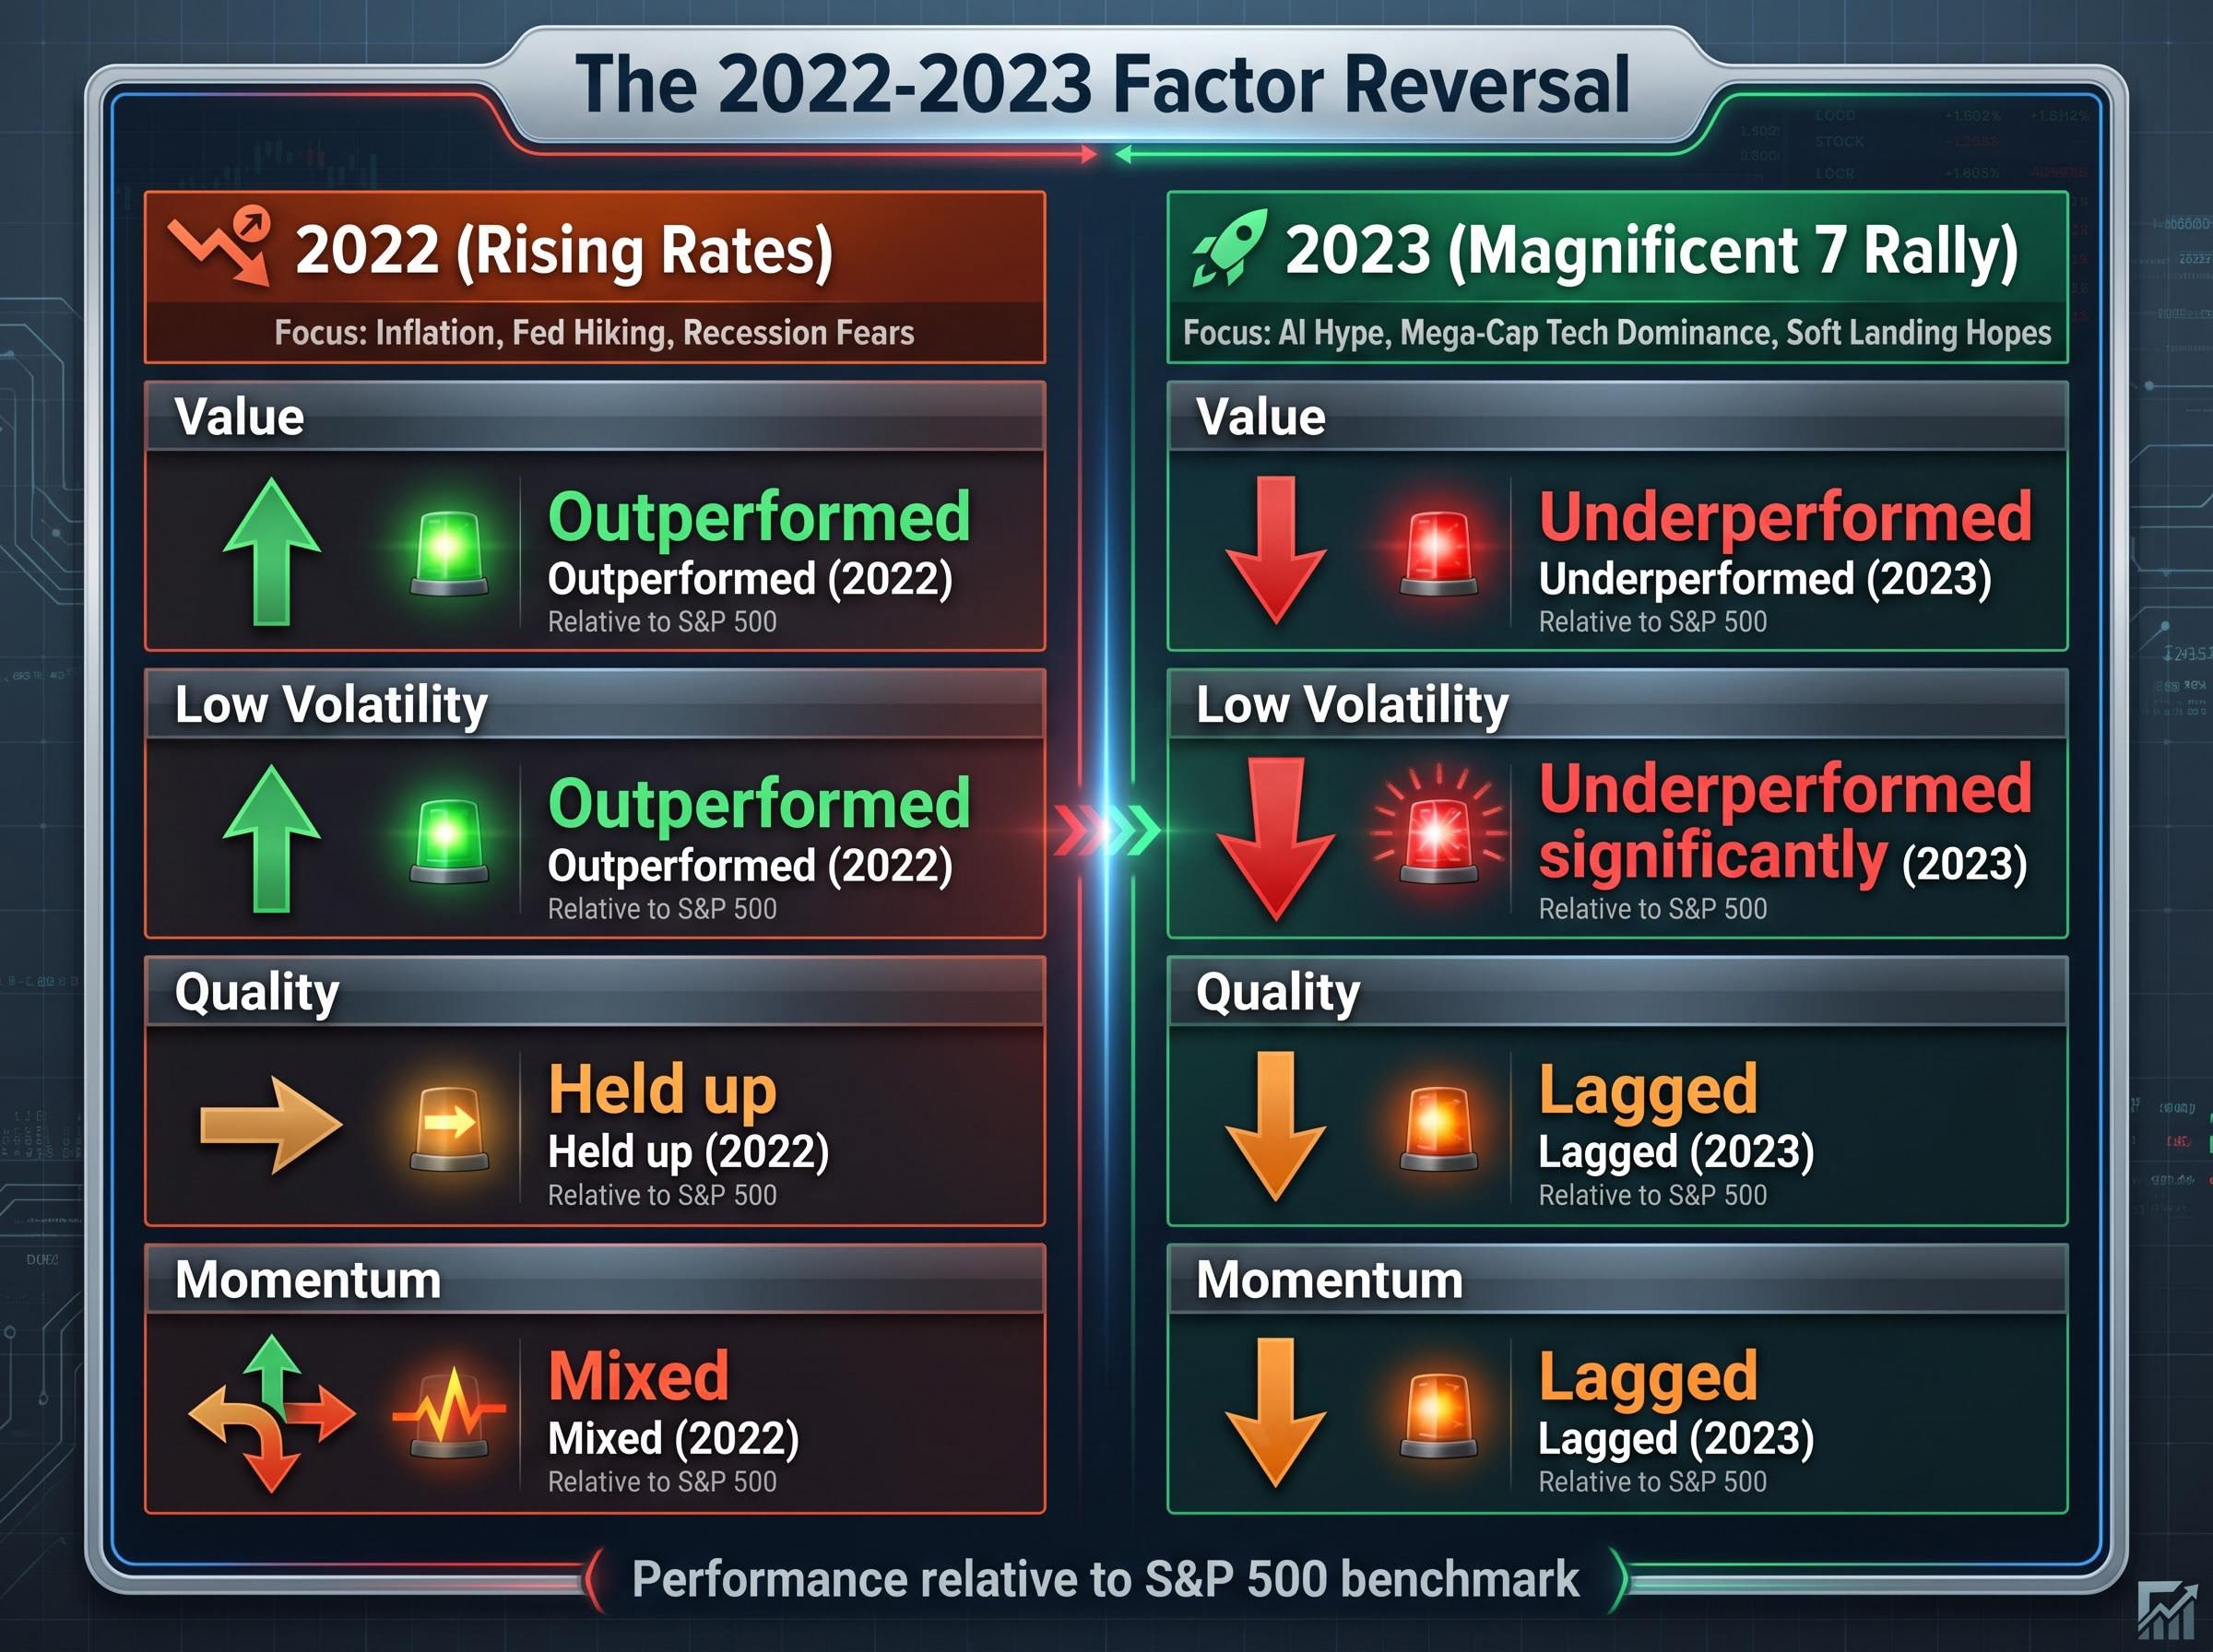
| Factor | 2022 vs. S&P 500 | 2023 vs. S&P 500 | Key driver |
|---|---|---|---|
| Value | Outperformed | Underperformed | Mega-cap growth rally concentrated gains |
| Momentum | Mixed | Lagged (rebalancing timing effects) | Rebalancing schedules missed early Magnificent 7 move |
| Quality | Held up | Lagged (but best among factors) | Defensive earnings quality vs. growth concentration |
| Low Volatility | Outperformed | Underperformed significantly | Capital rotated away from defensive sectors into high-beta names |
Note: Performance commentary is directional and consistent with publicly available MSCI and S&P Dow Jones Indices factor index materials. Detailed data runs through approximately late 2023 to early 2024.
Low volatility’s 2023 underperformance was not a failure. The strategy is designed to protect capital in risk-off environments and lag in speculative rallies. It behaved exactly as expected. The surprise was not the underperformance itself but how many investors treated it as a reason to abandon the strategy.
Momentum’s struggle was more mechanical. Rules-based US momentum ETFs rebalance on fixed schedules; by the time those schedules rotated into the Magnificent 7, much of the move had already occurred. Globally, momentum delivered positive active returns for much of 2023, but the specific US implementation lagged the cap-weighted benchmark.
Why cyclicality is a feature, not a flaw
Factor premiums exist partly because they are uncomfortable to hold through drawdowns. If value delivered smooth, consistent outperformance every year, the risk-adjusted return would attract enough capital to arbitrage the premium away entirely. The discomfort is the price of admission.
Extended underperformance periods of a decade or more are documented in value’s historical record. Investor commitment to a factor strategy cannot be conditional on short-run results. The 2022-2023 cycle is not an anomaly; it is a compressed illustration of the patience problem every factor investor faces.
The honest accounting: crowding, backtests, and what retail investors should expect
Factor crowding is real. As more capital flows into rules-based factor strategies, the expected premium for widely adopted factors, particularly low volatility and quality, is likely compressed. Research from Robeco has argued that crowded factors can become more vulnerable to sharp reversals when sentiment shifts. The mechanism is straightforward: when too much money chases the same signal, the stocks that signal selects become expensive relative to their risk, and future returns shrink.
The dominant expert view, however, is that premiums are reduced, not eliminated. AQR has argued across multiple papers that value, momentum, and quality premiums are “alive and well,” framing recent underperformance as cyclical rather than permanent. AQR tracks valuation spreads between cheap and expensive stocks and has noted these spreads remained historically elevated in recent years, implying higher expected forward returns for value. MSCI research in 2023-2024 reached a similar conclusion: wide valuation spreads persist despite years of smart beta inflows.
Vanguard’s research has emphasised that factor premiums are likely to persist but that expected returns are probably lower than historical backtests indicate. BlackRock’s factor investing team similarly stresses diversification across multiple factors as a mitigation for crowding risk.
Active fund underperformance in concentrated markets is partly structural rather than a reflection of manager skill: Investment Company Act position limits cap individual fund holdings at 5% of assets, making it mathematically impossible for most active funds to match benchmark weights when single S&P 500 constituents exceed 6-7% of index weight, a constraint that factor ETFs share in a different form when their construction rules systematically underweight the dominant names.
Backtests themselves deserve scrutiny. They are constructed using survivorship-free data, minimal assumed transaction costs, no capacity constraints, and the freedom to optimise over the most favourable historical period. All of these flatter performance relative to what a live investor would experience.
If a fund’s marketing shows long-run alpha of 3-4% annually over 30 years, plan emotionally for meaningfully less, and prepare for multi-year stretches of trailing the S&P 500.
The SEC’s Names Rule reform adds a layer of consumer protection. Factor ETFs face increasing pressure to hold portfolios consistent with their labels, which benefits investors who want to verify that a “value” ETF actually holds cheap stocks by a documented, quantitative definition.
When evaluating a factor ETF methodology, look for:
- A clear, rule-based definition of how the factor is measured
- Disclosure of rebalancing frequency, weighting method, and concentration limits
- A meaningful live track record for the ETF itself, not just the backtested index
- Transparent sector exposure that does not inadvertently create an unintended bet
For investors who want a structured framework for applying these criteria before selecting a specific product, our dedicated guide to evaluating ETF true exposure and hidden costs walks through the full due diligence sequence, including how to audit actual underlying holdings, calculate total cost of ownership beyond the headline management expense ratio, and identify concentration risks that fund names alone do not disclose.
What it actually takes to capture a factor premium as a retail investor
Factor investing is not a passive decision. It is an active commitment to a strategy that will regularly feel wrong, and the gap between the theoretical premium and the investor’s realised return is almost entirely a function of behaviour and cost.
Independent advisor commentary consistently recommends modest, diversified allocations across multiple factors rather than concentrated single-factor bets. A reasonable range cited in that commentary is 10-30% of equity exposure devoted to factor tilts. Diversification across factors reduces dependence on any single premium’s timing.
The behavioural risk is specific and well-documented: rotating into a factor after a strong 3-5 year run historically coincides with subsequent mean reversion. Performance chasing is the primary source of poor realised returns for retail factor investors. Writing a clear investment policy statement for the factor allocation, and committing to it through inevitable bad stretches, is the single most effective mitigation.
- Prioritise factors with a clear economic rationale, not just a compelling backtest
- Examine a fund’s actual holdings, not just its label
- Manage rebalancing costs by using trading bands rather than rigid calendar rebalancing
- Hold a written investment policy that specifies factor allocation and rebalancing rules
- Avoid timing rotations based on recent performance
Costs and tax efficiency: the silent return reducers
Factor ETFs are typically significantly more expensive than broad market index funds. That cost differential comes directly out of any premium captured. Comparing net-of-cost, after-tax returns, rather than gross backtested index performance, is the relevant standard.
High-turnover factor products, particularly momentum and multi-factor strategies, can generate capital gain distributions that make them substantially less tax-efficient than low-turnover broad market funds in taxable accounts. For investors in taxable portfolios, this drag compounds over time and can materially erode the theoretical premium.
Factor investing earns its place only if you understand what you are buying
The academic evidence for major factor premiums spans decades and survives rigorous scrutiny. That evidence is real. The path to realising those premiums, however, includes extended underperformance, behavioural pressure to abandon the strategy at the worst possible moment, and a live return that will likely fall short of the backtest.
The framework this article has built applies to any factor product: ask whether its construction methodology genuinely captures the premium its label claims, whether its costs are justified relative to a broad market alternative, and whether the investor, not in theory but in practice, can commit to it through inevitable bad stretches. Factor investing continues to evolve, with institutional approaches increasingly incorporating macroeconomic regime awareness and machine learning. The foundational academic insights that justify the major factors remain intact for investors willing to apply them patiently and cheaply.
This article is for informational purposes only and should not be considered financial advice. Investors should conduct their own research and consult with financial professionals before making investment decisions. Past performance does not guarantee future results. Financial projections are subject to market conditions and various risk factors.