More than three-quarters of Australian equity fund managers fail to beat their benchmark after fees over a decade. That figure, drawn from the most recent complete SPIVA Australia Scorecard, is not an outlier finding or a one-cycle anomaly. It is the headline result of a body of research that has been building for years, and the consistency of the evidence points to a single variable as the most reliable explanation: the fee itself. In May 2026, Morningstar updated its Medalist Rating methodology to include an explicit pricing score, an institutional acknowledgement that cost has graduated from useful heuristic to structural performance predictor. For Australian retail investors, 38% of whom do not know exactly what fees they are paying, the evidence arrives at a moment when the cost gap between active and passive options has never been more visible. What follows unpacks the empirical case connecting fund expense ratios to long-term investor outcomes in the Australian market, explains the mechanical reason fees operate as a compounding headwind, and identifies where the relationship holds most powerfully and where it carries meaningful exceptions.
The data connecting fund fees to performance is not a hypothesis anymore
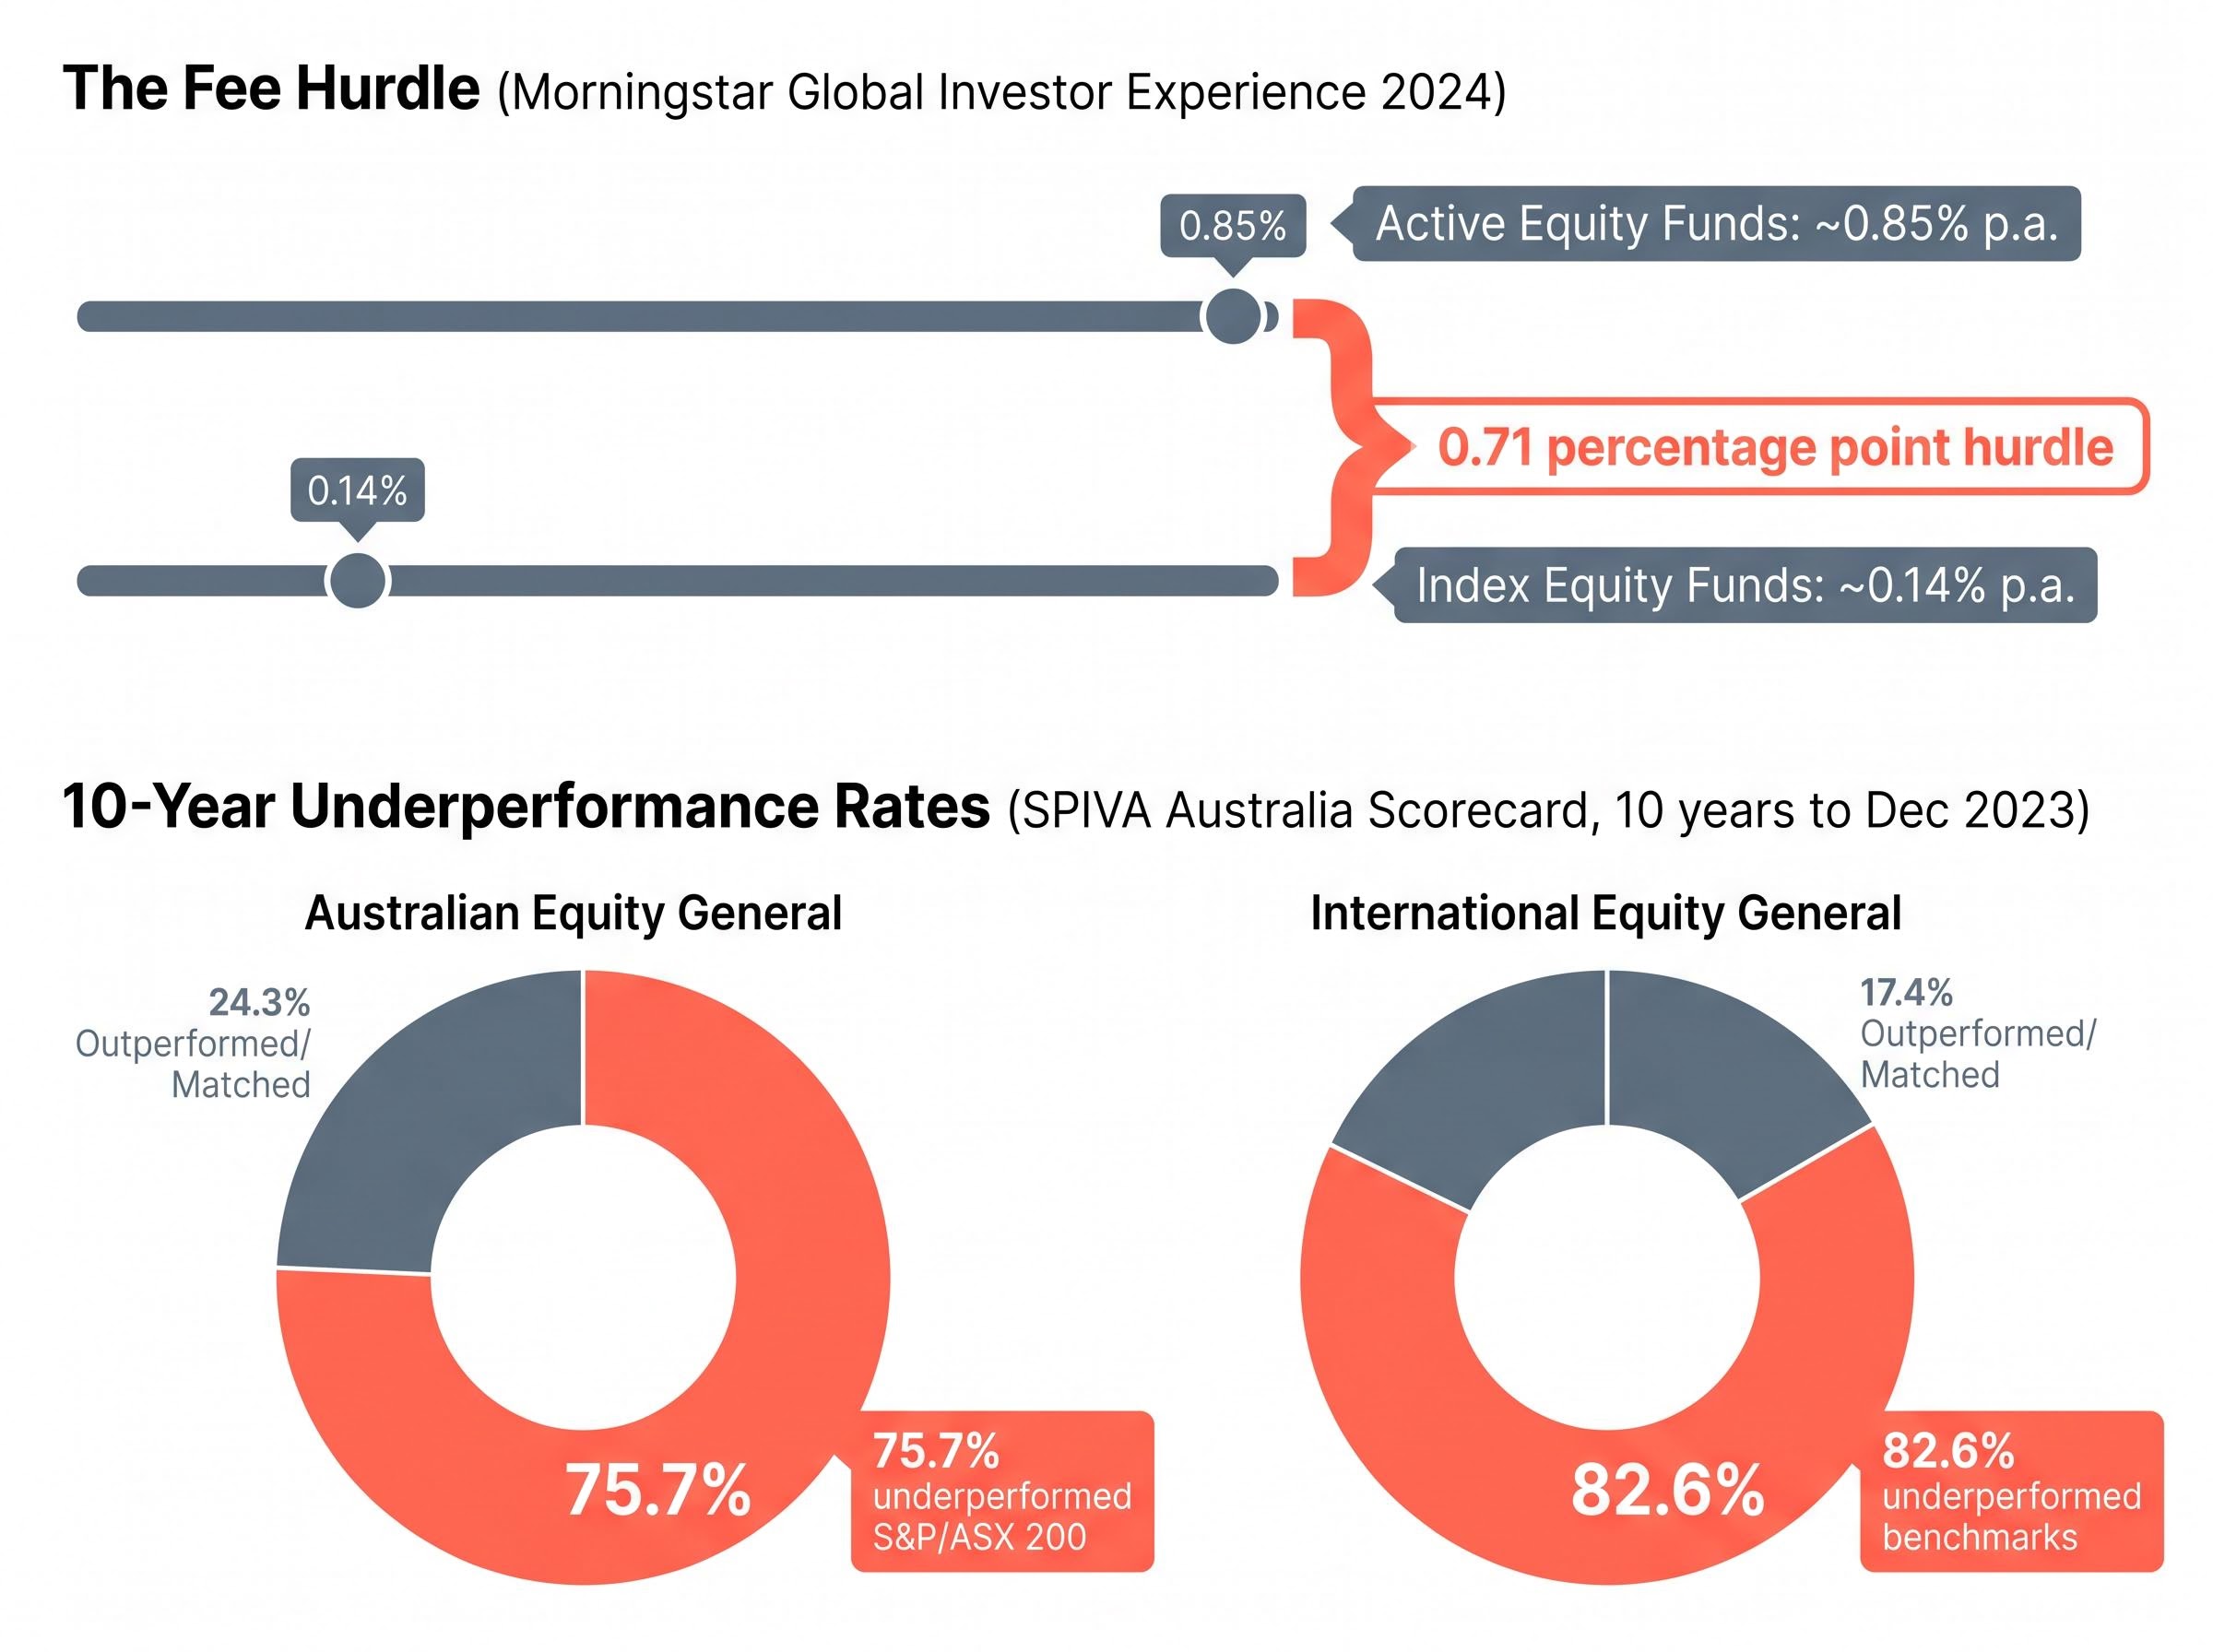
The SPIVA Australia Scorecard, covering the 10 years to December 2023, provides the broadest measure of active fund underperformance in the local market. The results are unambiguous:
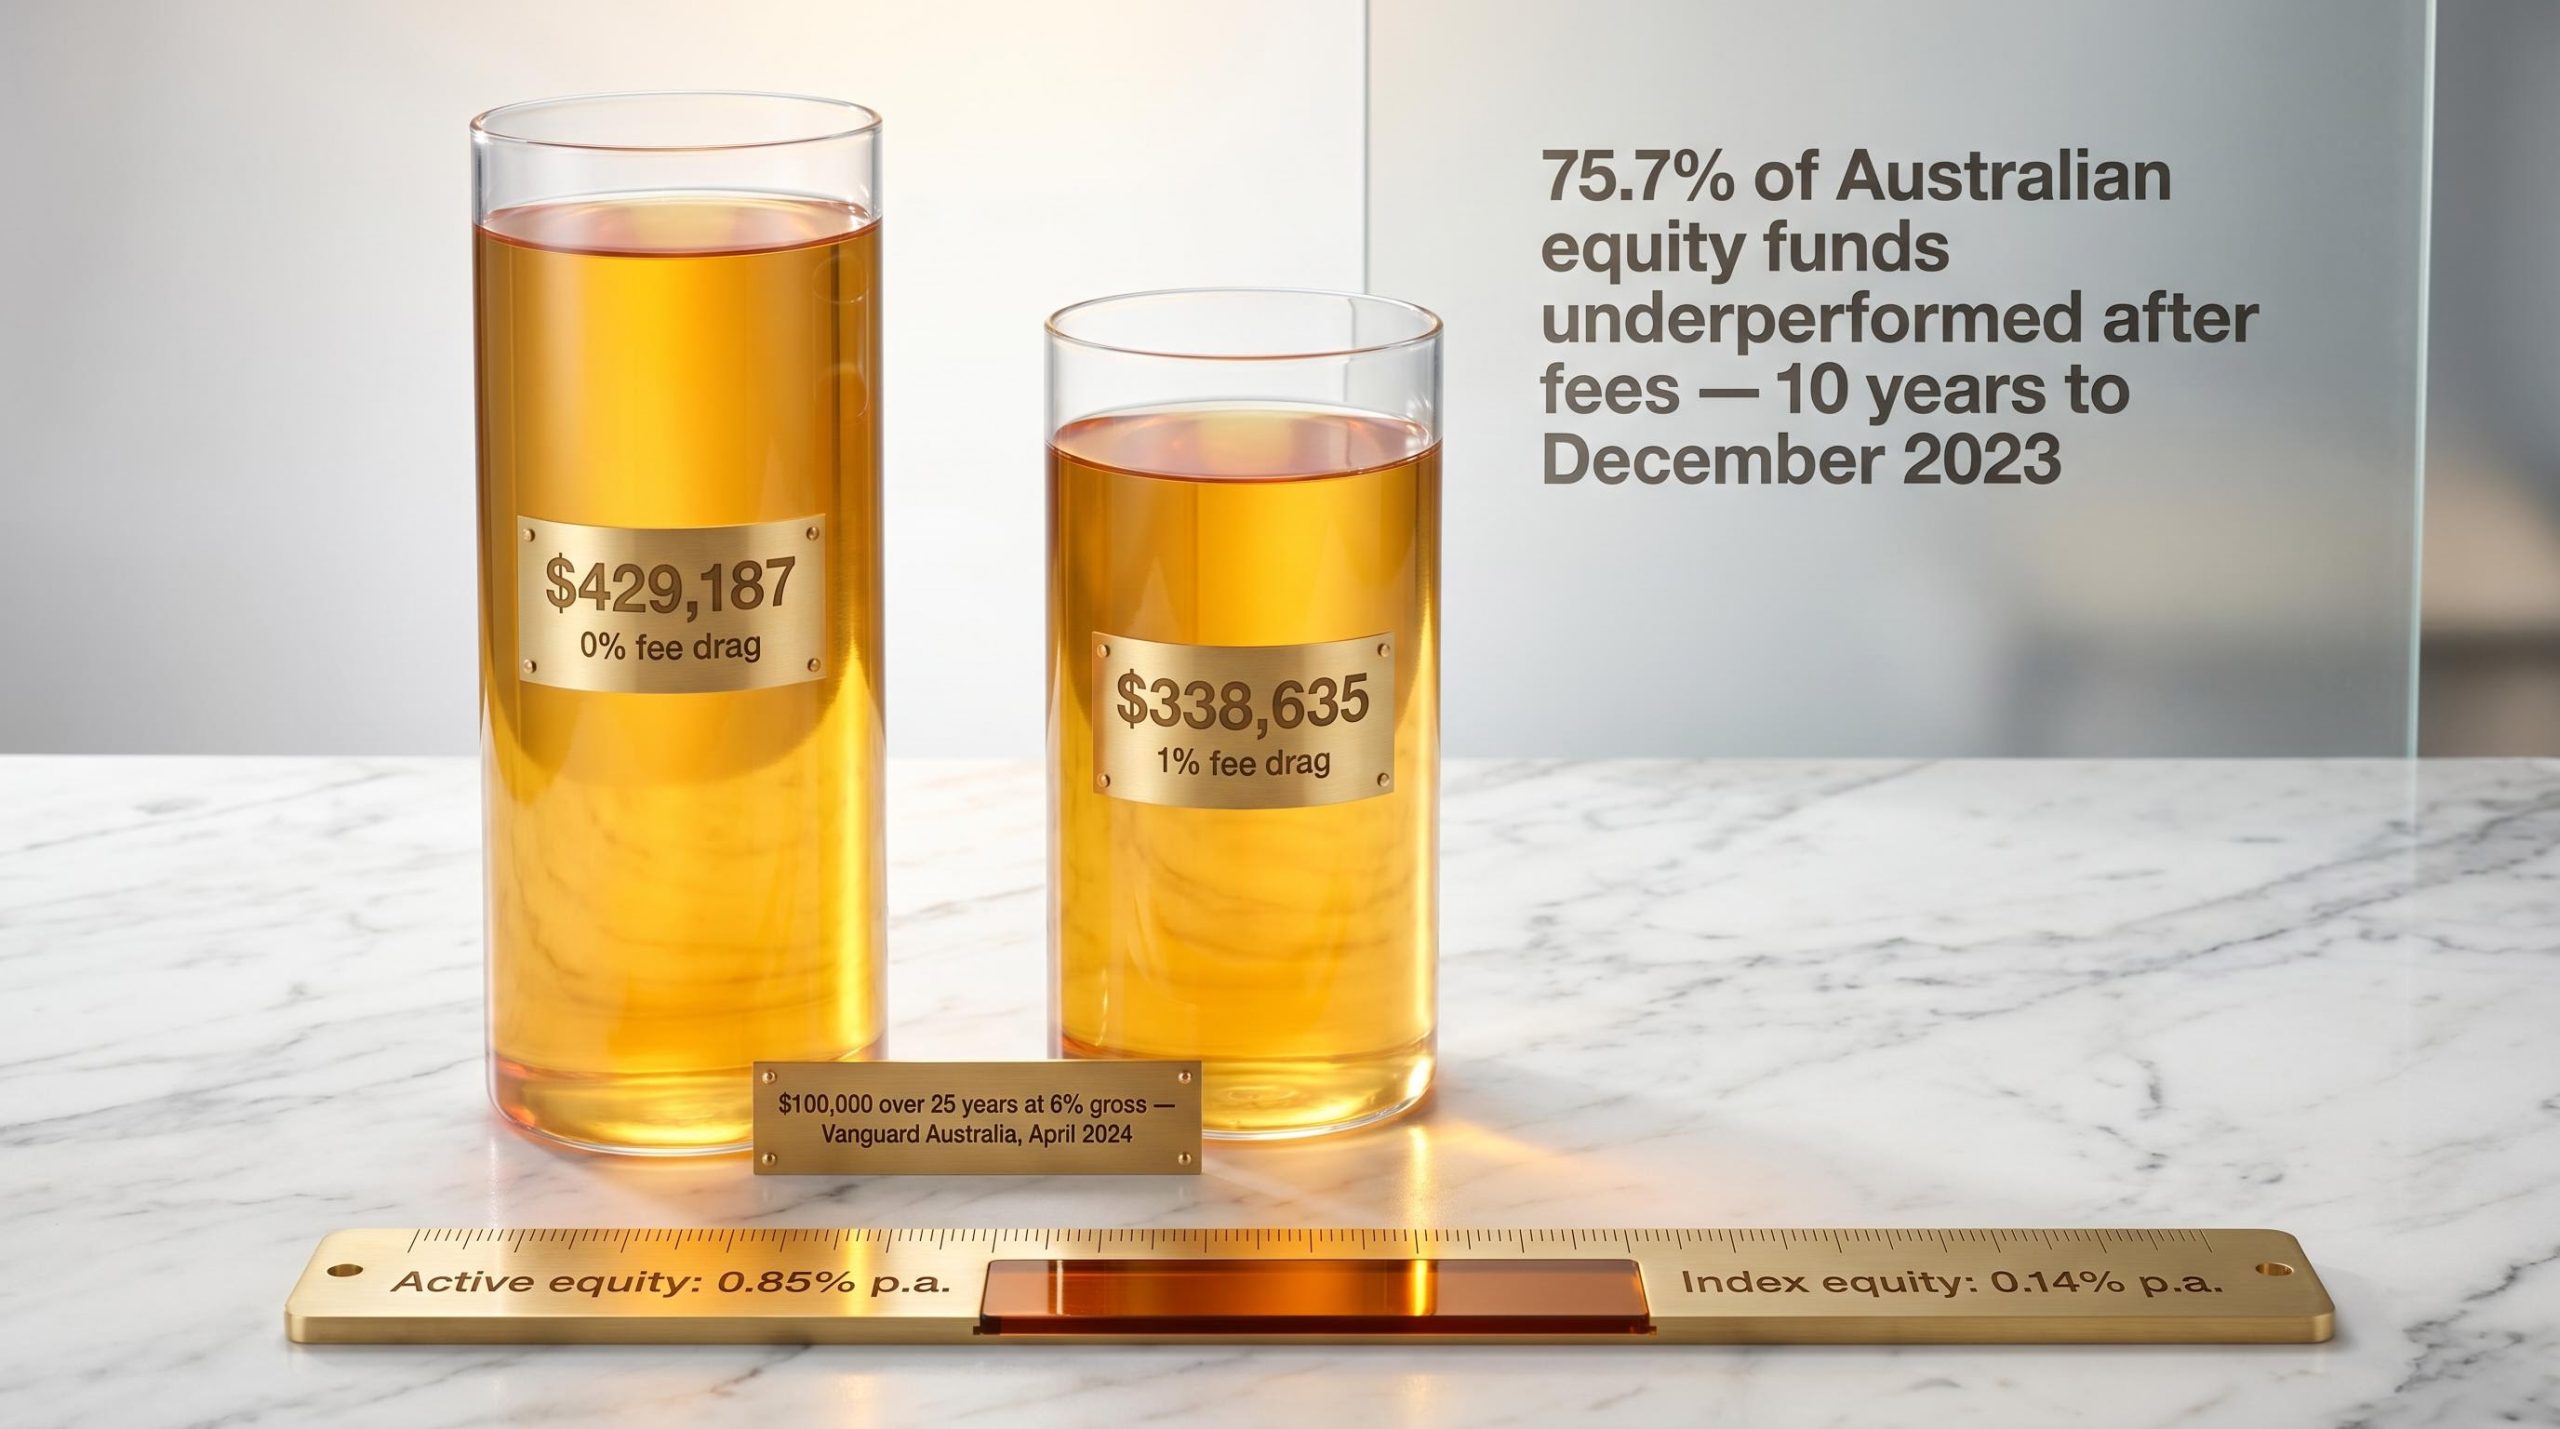
- 75.7% of Australian Equity General funds underperformed the S&P/ASX 200 after fees.
- 82.6% of International Equity General funds underperformed their benchmarks over the same period.
S&P Dow Jones Indices, which produces the scorecard, attributes a significant portion of that underperformance to the drag from management fees and other costs.
The SPIVA Australia Year-End 2023 Scorecard is the primary source for the underperformance statistics cited throughout this analysis, measuring results across Australian Equity General, International Equity General, and other major active fund categories against their respective S&P benchmarks after fees over one, five, and ten-year periods.
Morningstar’s analysis of the Australian fund universe, using data through December 2025, arrives at the same conclusion from a different angle. Rather than measuring aggregate underperformance, Morningstar ranked funds into fee quintiles and measured success ratios within each. Across nearly all major Australian fund categories, the lowest-cost quintile delivered both superior success ratios and stronger average total returns relative to the highest-cost quintile. In Australian large-cap equity, success ratios declined progressively as fees rose.
Two independent datasets, produced by different institutions using different methodologies, converge on the same directional finding. The April 2026 Morningstar Medalist Rating update formalised this. Low-cost funds now receive a structural rating advantage through an explicit pricing score.
Morningstar’s research describes fees as “among the most reliable predictors of future after-fee performance” in the Australian fund universe.
For investors evaluating fund choices, the implication is direct: cost is not a tiebreaker between otherwise equal options. It is a primary screen.
When big ASX news breaks, our subscribers know first
Why fees compound against investors with mathematical certainty
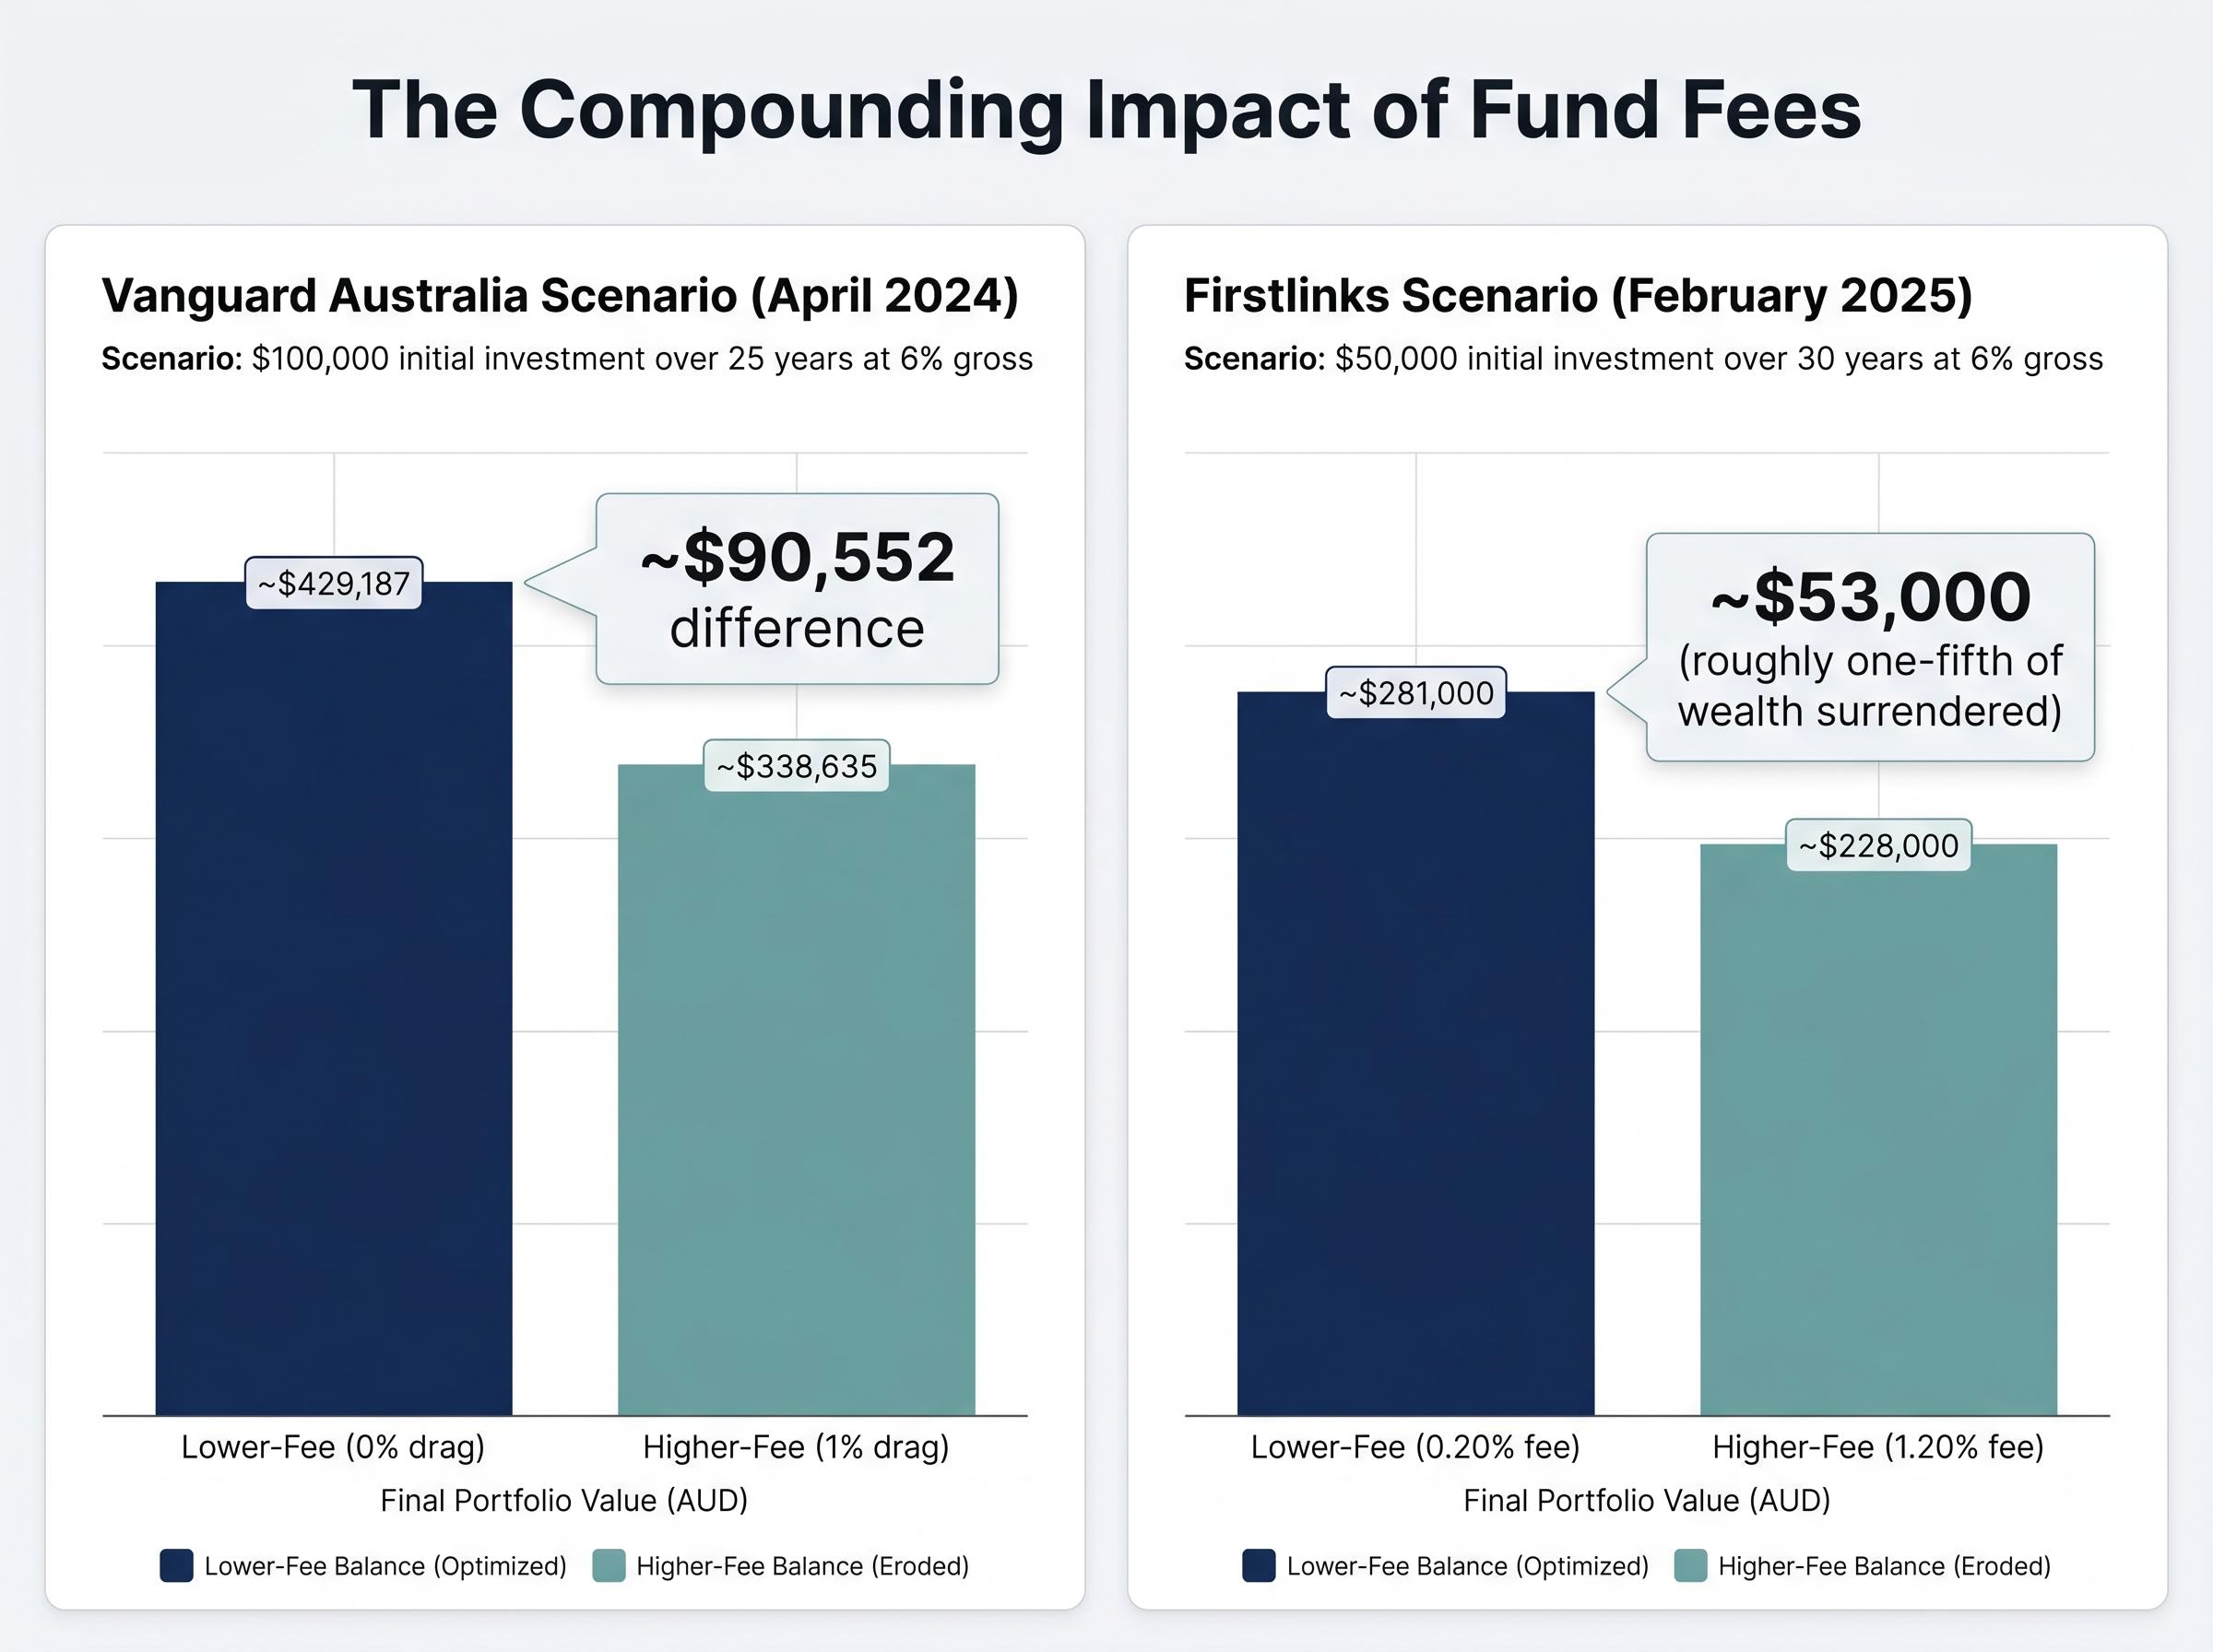
A management fee does not simply reduce a single year’s return. It is subtracted from the gross return before compounding occurs, meaning the investor loses not only the fee amount but all future growth that amount would have generated. Over decades, this creates a gap that widens with every passing year.
The following examples, drawn from Australian industry sources, illustrate the scale of that gap.
| Source | Initial Investment | Time Horizon | Lower-Fee Balance | Higher-Fee Balance |
|---|---|---|---|---|
| Vanguard Australia (April 2024) | $100,000 | 25 years at 6% gross | ~$429,187 (0% fee drag) | ~$338,635 (1% fee drag) |
| Firstlinks (February 2025) | $50,000 | 30 years at 6% gross | ~$281,000 (0.20% fee) | ~$228,000 (1.20% fee) |
In the Vanguard example, a 1% annual fee difference erodes approximately $90,552 over 25 years. In the Firstlinks example, the investor at the higher fee level surrenders roughly one-fifth of potential wealth to costs over 30 years, a gap of approximately $53,000.
These are not extreme scenarios. They use modest return assumptions and fee levels that sit squarely within the range Australian investors encounter in practice.
What the fee gap means for active managers seeking to add value
The fee gap between active and passive options creates a hurdle that must be cleared before a single cent of net advantage reaches the investor. According to the Morningstar Global Investor Experience 2024 report, the asset-weighted median fee for active equity funds in Australia sits at approximately 0.85% per annum, against approximately 0.14% for index equity funds.
That 0.71 percentage point difference is the minimum gross outperformance an active manager must deliver annually just to break even with a passive alternative, net of costs. The hurdle must be cleared not once but consistently, year after year. The SPIVA data shows the majority of managers fail to do so over a decade.
The fee is certain. The outperformance is not. That asymmetry is the core of the cost-predictability argument.
Where the fee effect is most powerful and where it has nuance
The broadest finding, that low-cost funds outperform high-cost funds on average, holds across most Australian fund categories. The strength of that relationship, however, varies by asset class.
Multisector growth funds present the most extreme case. Morningstar’s analysis (data through December 2025) found that the cheapest fee quintile delivered an 87% success ratio, while the most expensive quintile managed just 14%, a 73-percentage-point gap.
In multisector growth, the cheapest quintile delivered an 87% success ratio versus 14% in the most expensive quintile, a gap that reflects the documented difficulty active managers face with dynamic asset allocation and market-regime timing.
Australian large-cap equity followed the expected pattern: success ratios declined progressively as fees rose across quintiles, consistent with the broader SPIVA findings for this category.
Fixed income is the one area where the relationship showed meaningful nuance. During the study period, the three middle expense quintiles, composed largely of active strategies with competitive pricing, outperformed the lowest-cost quintile. This outcome is attributed to difficult market conditions for passive fixed income strategies during the period studied, rather than a structural invalidation of the cost-predictability relationship.
Fixed income active management benefits from structural features of bond markets, including over-the-counter trading, debt-weighted index construction, and episodic liquidity, that create exploitable opportunities not present in equity markets where passive capital competes most aggressively.
| Asset Class | Cheapest Quintile Success Ratio | Most Expensive Quintile Success Ratio |
|---|---|---|
| Australian Large-Cap Equity | Progressive decline as fees rise | Lowest success ratio |
| Multisector Growth | 87% | 14% |
| Fixed Income | Below mid-quintile active strategies | Below mid-quintile active strategies |
The fixed income exception sharpens rather than undermines the broader argument. It suggests that competitively priced active strategies can add value in segments where passive alternatives face structural limitations, while reinforcing that in equity and multisector categories, cost discipline remains the single most predictive variable.
What fund expense ratios actually are and how Australian investors can find them
A management expense ratio (MER) is the annual percentage deducted from a fund’s assets to cover management and operating costs. It is expressed as a proportion of the fund’s net asset value and is deducted before the return an investor sees. A fund reporting a 7% return after an 0.85% MER generated approximately 7.85% gross.
ETF management fees are deducted daily from a fund’s net asset value rather than appearing as a separate charge, a structural feature that makes their cumulative drag easy to underestimate even when investors know the headline MER figure.
The MER is the primary cost measure, but not always the only one. Some funds carry additional transaction costs or performance fees that sit outside the headline MER. These appear in the Product Disclosure Statement (PDS) under the indirect cost ratio.
For context, current Australian fee benchmarks sit at approximately 0.85% per annum for active equity funds, approximately 0.14% for index equity funds, and 0.07-0.10% for the lowest-cost broad market ETFs listed on the ASX, according to Morningstar and Vanguard Australia data.
Despite the significance of these figures, the ASX Australian Investor Study 2023 found that 38% of investors do not know the fees they pay, and only 31% report knowing exactly what they are charged. ASIC MoneySmart notes that “seemingly small differences in fees (e.g. 0.5% vs 1.5%) can reduce your final balance by up to 30% over several decades.”
Locating fee information is straightforward:
- Find the Product Disclosure Statement (PDS) on the fund manager’s website or through ASIC’s Moneysmart Register.
- Navigate to the Management Costs or Fees and Costs section within the PDS.
- Compare the total annual cost including the indirect cost ratio, not just the headline management fee.
- Active equity funds: approximately 0.85% p.a.
- Index equity funds: approximately 0.14% p.a.
- Lowest-cost broad market ETFs: 0.07-0.10% p.a.
Closing that awareness gap is the practical precondition for applying the cost-predictability evidence in real portfolio decisions.
How Morningstar’s methodology change signals a shift in how funds will be rated
When Morningstar introduced its updated Medalist Rating in April 2026, the change carried an explicit message about what the accumulated evidence now demands. The new framework includes a pricing score that gives low-cost funds a structural advantage and applies a ratings reduction to high-cost funds.
The Morningstar Medalist Rating Price Score is weighted at 40% for passive funds and 30% for active funds under the April 2026 methodology, meaning a fund with a fee significantly above its category median now faces a structural ratings headwind that qualitative pillar scores for people, process, and parent cannot fully offset.
“Our research shows that over the long term, price is a powerful driver of investor outcomes.” — Morningstar, Medalist Rating Methodology Update, April 2026
Qualitative factors, including the investment team, process, and parent organisation, remain inputs to the rating. The pricing score, however, acts as a structural modifier that cannot be overcome by qualitative strengths alone at extreme cost levels. A fund charging significantly above its category median now faces a ratings headwind that is built into the methodology itself.
This is not an administrative adjustment. It is the institutional conclusion drawn from the same body of cost-predictability research described throughout this article, embedded into the infrastructure that financial professionals and retail investors use to evaluate funds.
How the advice industry is responding to fee scrutiny
The professional advice channel has already been moving in this direction. According to the Vanguard/ASX ETF Report 2024, 78% of financial advisers cite lower management costs as a key ETF advantage over unlisted managed funds. Licensee research teams are increasingly applying fee screens, with some excluding funds above 1.0% MER without strong risk-adjusted track records, according to Professional Planner (May 2024).
The growing use of core-satellite portfolios reflects this shift in practice: index funds serve as the low-cost core, with select active strategies as satellites justified by net-of-fee alpha evidence. As Firstlinks noted in August 2024, advisers must now articulate why they recommend active strategies with fees 80-100 basis points higher when index options are available at under 20 basis points.
The active manager counter-argument deserves acknowledgement. Averages obscure dispersion, and less efficient segments such as small caps, credit, and alternatives may warrant competitively priced active strategies where net outperformance evidence exists. The question is whether the evidence supports the specific fee being charged, not whether active management itself has value.
The case for cost discipline is the most actionable finding in Australian fund research
Among the variables that predict fund performance, fees occupy a unique position. They are knowable in advance, persistent over time, and directly subtracted from returns. No other single input carries that combination of certainty and predictive power across the Australian fund research literature.
The fee-success relationship holds across Australian large-cap equity, global equity, and multisector growth, with the fixed income exception noted. APRA’s 2024 MySuper performance test reinforced the point at the superannuation level: high-fee, underperforming products were required to notify members, with some members shown to be thousands of dollars worse off over 7-8 years compared with those in low-fee products. At the retail investor level, the BetaShares year-end 2024 ETF review found that 83% of ETF investors cite low management fees as an important selection criterion, suggesting fee awareness is already translating into product choice at the leading edge of investor behaviour.
Superannuation fee structures carry an additional layer of cost complexity beyond the headline MER, including CGT drag transferred from exiting members to remaining members and swap-based index costs embedded in some low-fee options, none of which appear as line items in standard fee disclosure documents.
The practical principles the evidence supports are straightforward:
- Apply a cost screen as a primary filter before evaluating manager quality.
- Require evidence of persistent net-of-fee outperformance before paying a fee premium in any asset class.
- Use the PDS indirect cost ratio, not just the headline MER, as the total cost basis for comparison.
Investors who apply a consistent cost screen are not sacrificing sophistication for simplicity. They are applying the most robustly validated predictor available in the Australian fund research literature.
This article is for informational purposes only and should not be considered financial advice. Investors should conduct their own research and consult with financial professionals before making investment decisions. Past performance does not guarantee future results.
The evidence is in, and it points in one direction
Across the Australian fund universe, fund expense ratios are among the most reliable forward-looking predictors of investor outcomes. SPIVA, Morningstar, and a decade of adviser and media commentary arrive at the same conclusion from different directions: lower fees are consistently associated with higher probabilities of investment success after costs.
The 38% of Australian investors who do not know their exact fund fees face a quantifiable cost for that gap in awareness. Closing it requires no specialised knowledge, only a willingness to locate the PDS, compare total costs, and apply the most actionable finding in the research.
ASIC MoneySmart’s fee calculator and PDS fee disclosure sections provide the practical starting point. The evidence has been clear for years. The infrastructure of fund evaluation has now caught up.
—