Finfluencer Rules Won’t Work Until the Penalty Beats the Profit
1 hr ago

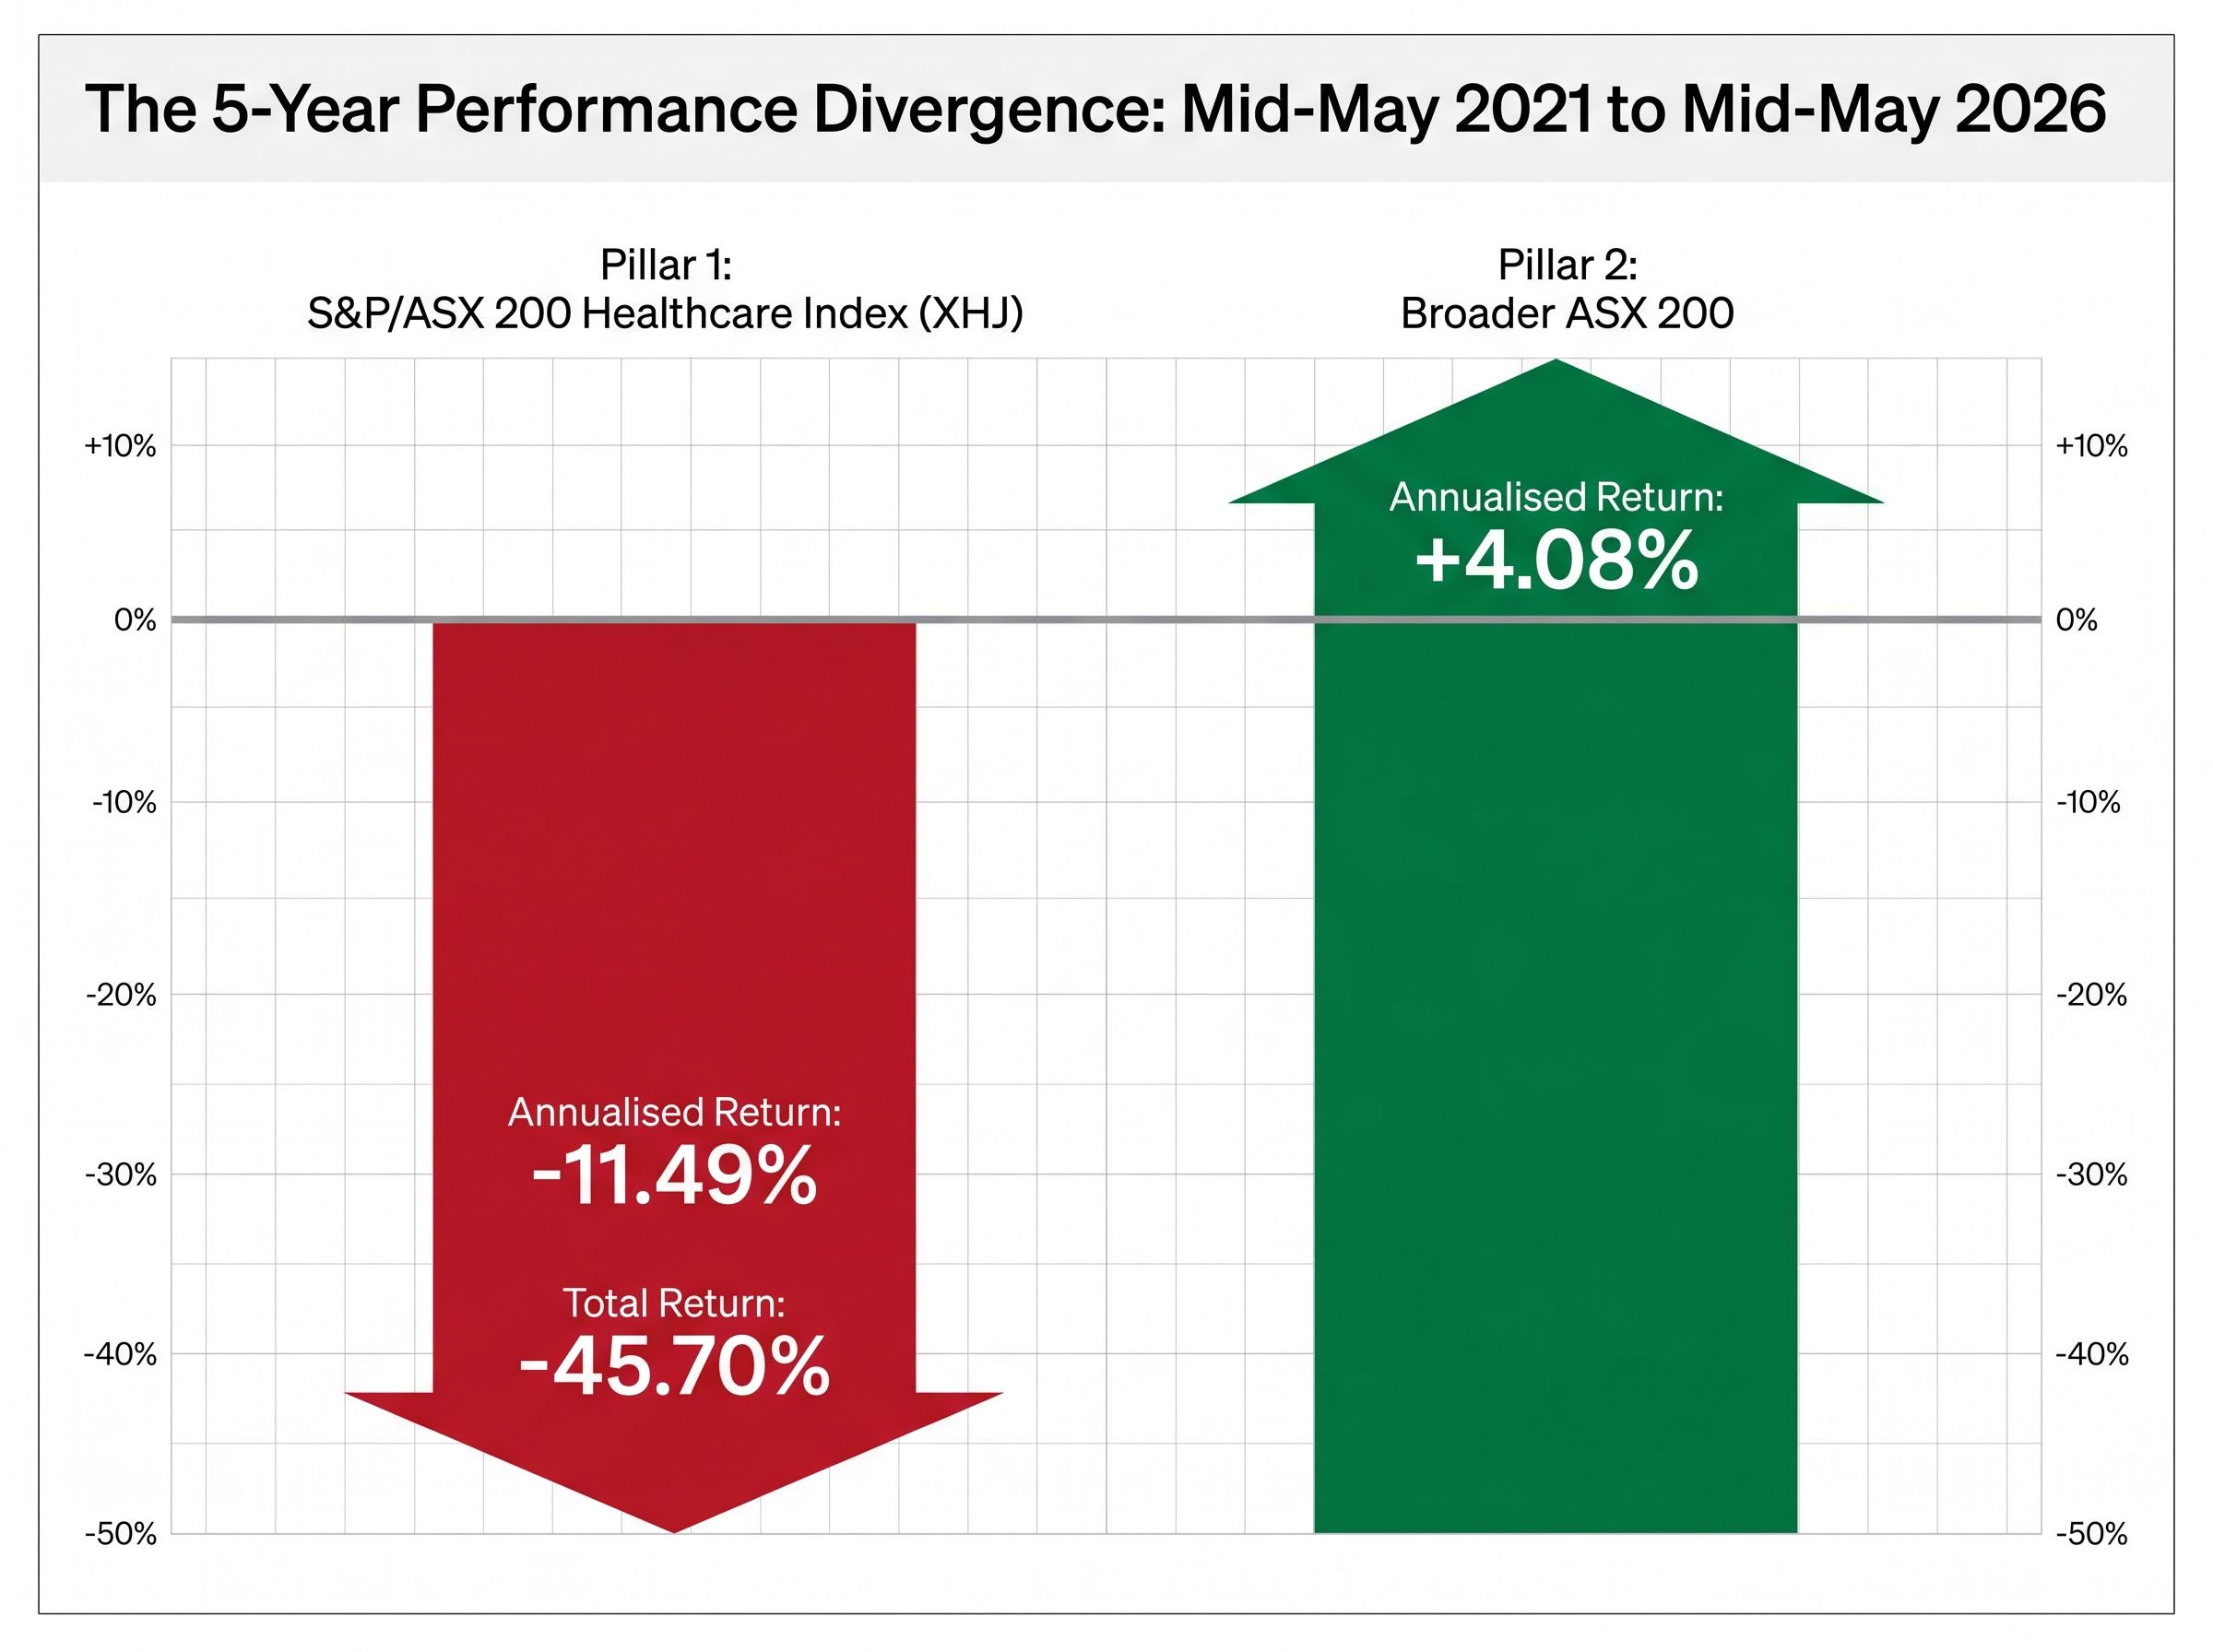
The S&P/ASX 200 Healthcare Index has delivered an annualised return of -11.49% over five years. Over the same period, the structural case for healthcare spending strengthened. US healthcare profit pools climbed toward projections of US$819 billion. Healthcare IT growth forecasts exceeded 15% annually. Institutional ESG allocations continued to rise.
For Australian investors evaluating ASX healthcare shares, this divergence between price action and underlying fundamentals raises a question worth examining carefully: does the sector’s sustained underperformance signal structural impairment, or does it reflect a valuation dislocation driven by macro forces that may now be fading? What follows is an analytical framework built across five distinct layers, from the mechanics of the sell-off through sub-sector growth dynamics, individual stock valuations, ESG capital flows, and a forward-looking decision framework, designed to help investors form their own assessment with specific evidence rather than headline sentiment.
The scale of the damage needs to be stated plainly before any opportunity case can be evaluated.
The S&P/ASX 200 Healthcare Index (XHJ) delivered an annualised return of -11.49% over the five years to mid-May 2026, representing a total return of approximately -45.70%. Over the same period, the broader ASX 200 returned approximately +4.08% per annum.
That divergence demands explanation. And when the layers are separated, the picture that emerges is more precise than a blanket “healthcare sold off” narrative suggests.
The dominant driver was valuation compression. As bond yields rose and the “higher for longer” rate environment took hold, high-multiple healthcare names, including CSL, Cochlear, and ResMed, experienced significant derating. Several of these businesses delivered mid-teens earnings growth through the period. The share prices fell anyway, because the market recalibrated the multiple it was willing to pay for that growth.
Secondary drivers compounded the pressure:
The distinction matters. What broke was primarily the pricing architecture, not the underlying business performance of quality names. Investors who conflate a deteriorating price chart with a deteriorating business thesis risk framing the decision incorrectly from the outset.
CSL index weighting mechanics amplify how idiosyncratic shocks propagate across the XHJ, with CSL carrying approximately 45% of the index, meaning a single stock’s currency headwinds and governance events can mechanically drag headline index returns well below what the median constituent is delivering.
Healthcare expenditure behaves differently from discretionary consumption, and the difference is structural rather than cyclical. Patients do not defer chemotherapy because consumer confidence has weakened. Governments do not cut hospital funding at the same rate they reduce infrastructure spending during downturns.
The most recent large-scale stress test supports this. During the Global Financial Crisis, the ASX healthcare sector was the top-performing sector on the Australian market. While banks, resources, and consumer discretionary names suffered severe drawdowns, healthcare revenues held because the demand was driven by medical necessity rather than consumer sentiment.
This non-discretionary demand floor has not deteriorated during the period of XHJ share price weakness. If anything, the ageing demographic profile across developed markets has intensified the structural need.
The non-discretionary demand floor argument has historically supported the sector’s defensive label, but Cochlear’s April 2026 guidance reset, cutting FY26 profit forecasts by 30-35% in a single announcement, demonstrates that elective healthcare demand carries meaningful consumer-confidence sensitivity that the label routinely obscures.
The US accounts for over 40% of total worldwide healthcare expenditure, making it the single most important market for global healthcare companies, including those listed on the ASX. US national health expenditure continues to grow in the mid-single-digit percentage range annually, measured in the multi-trillion-dollar range.
Within that total expenditure figure sits a more specific metric.
According to McKinsey analysis (referenced via HIT Consultant, January 2024), US healthcare profit pools are projected to reach US$819 billion by 2027.
The profit pool concept captures the addressable economic profit available across healthcare subsectors, distinct from the total spending figure. For ASX-listed healthcare companies with US revenue exposure, this projection represents the expanding commercial opportunity their businesses are positioned against, an opportunity that continued to grow through the same five-year period that produced deeply negative index returns.
The XHJ is not a monolithic block. Within the index and the broader ASX healthcare universe, a digital sub-theme has been compounding at rates that make the headline index return an inadequate lens for evaluating certain companies.
Industry consensus across multiple 2024-2025 consultancy reports projects global healthcare IT, data, and SaaS segments to achieve 15%-plus annual revenue growth from 2024 through to 2030. That growth rate reflects the structural digitisation of clinical workflows, from imaging and diagnostics through to patient-flow management and connected care platforms.
Pro Medicus (ASX: PME) is the clearest ASX example of software-style economics operating within healthcare. The company provides enterprise imaging and radiology software, with a business model characterised by high margins and long-dated contracts with major hospital networks across the US and Europe. Its revenue profile resembles enterprise SaaS more than traditional medical devices.
Several other ASX names occupy adjacent territory in this space.
| Company | ASX Code | Core Product | Key Revenue Characteristic |
|---|---|---|---|
| Pro Medicus | PME | Enterprise imaging and radiology software | High-margin, long-dated hospital contracts |
| Alcidion | ALC | Clinical decision support and patient-flow software | Recurring SaaS revenue from hospital networks |
| Mach7 Technologies | M7T | Enterprise imaging platform | Multi-year enterprise contracts |
| ResMed | RMD | Sleep apnoea devices with connected health software | Growing software and data component alongside device sales |
The valuation tension is real. These names experienced derating alongside broader healthcare during the rate-rise cycle, compressing multiples despite their structural growth profiles. That compression creates the same question facing the broader sector: whether the discount reflects a repriced opportunity or a rational reassessment of what investors should pay for growth in a higher-rate world.
Abstract discussions of “valuation dislocation” become concrete when measured against a specific company. Cochlear (ASX: COH) provides one of the clearest case studies on the ASX.
The stock declined -63.1% from the start of 2025 through to May 2026. Alongside the price decline, the price-to-sales ratio compressed dramatically.
Cochlear’s P/S ratio compressed from a five-year average of approximately 9.18x to approximately 2.82x as of May 2026, representing a repricing of more than two-thirds from its historical average.
The structural growth thesis, meanwhile, has not been dismantled. Three drivers remain intact:
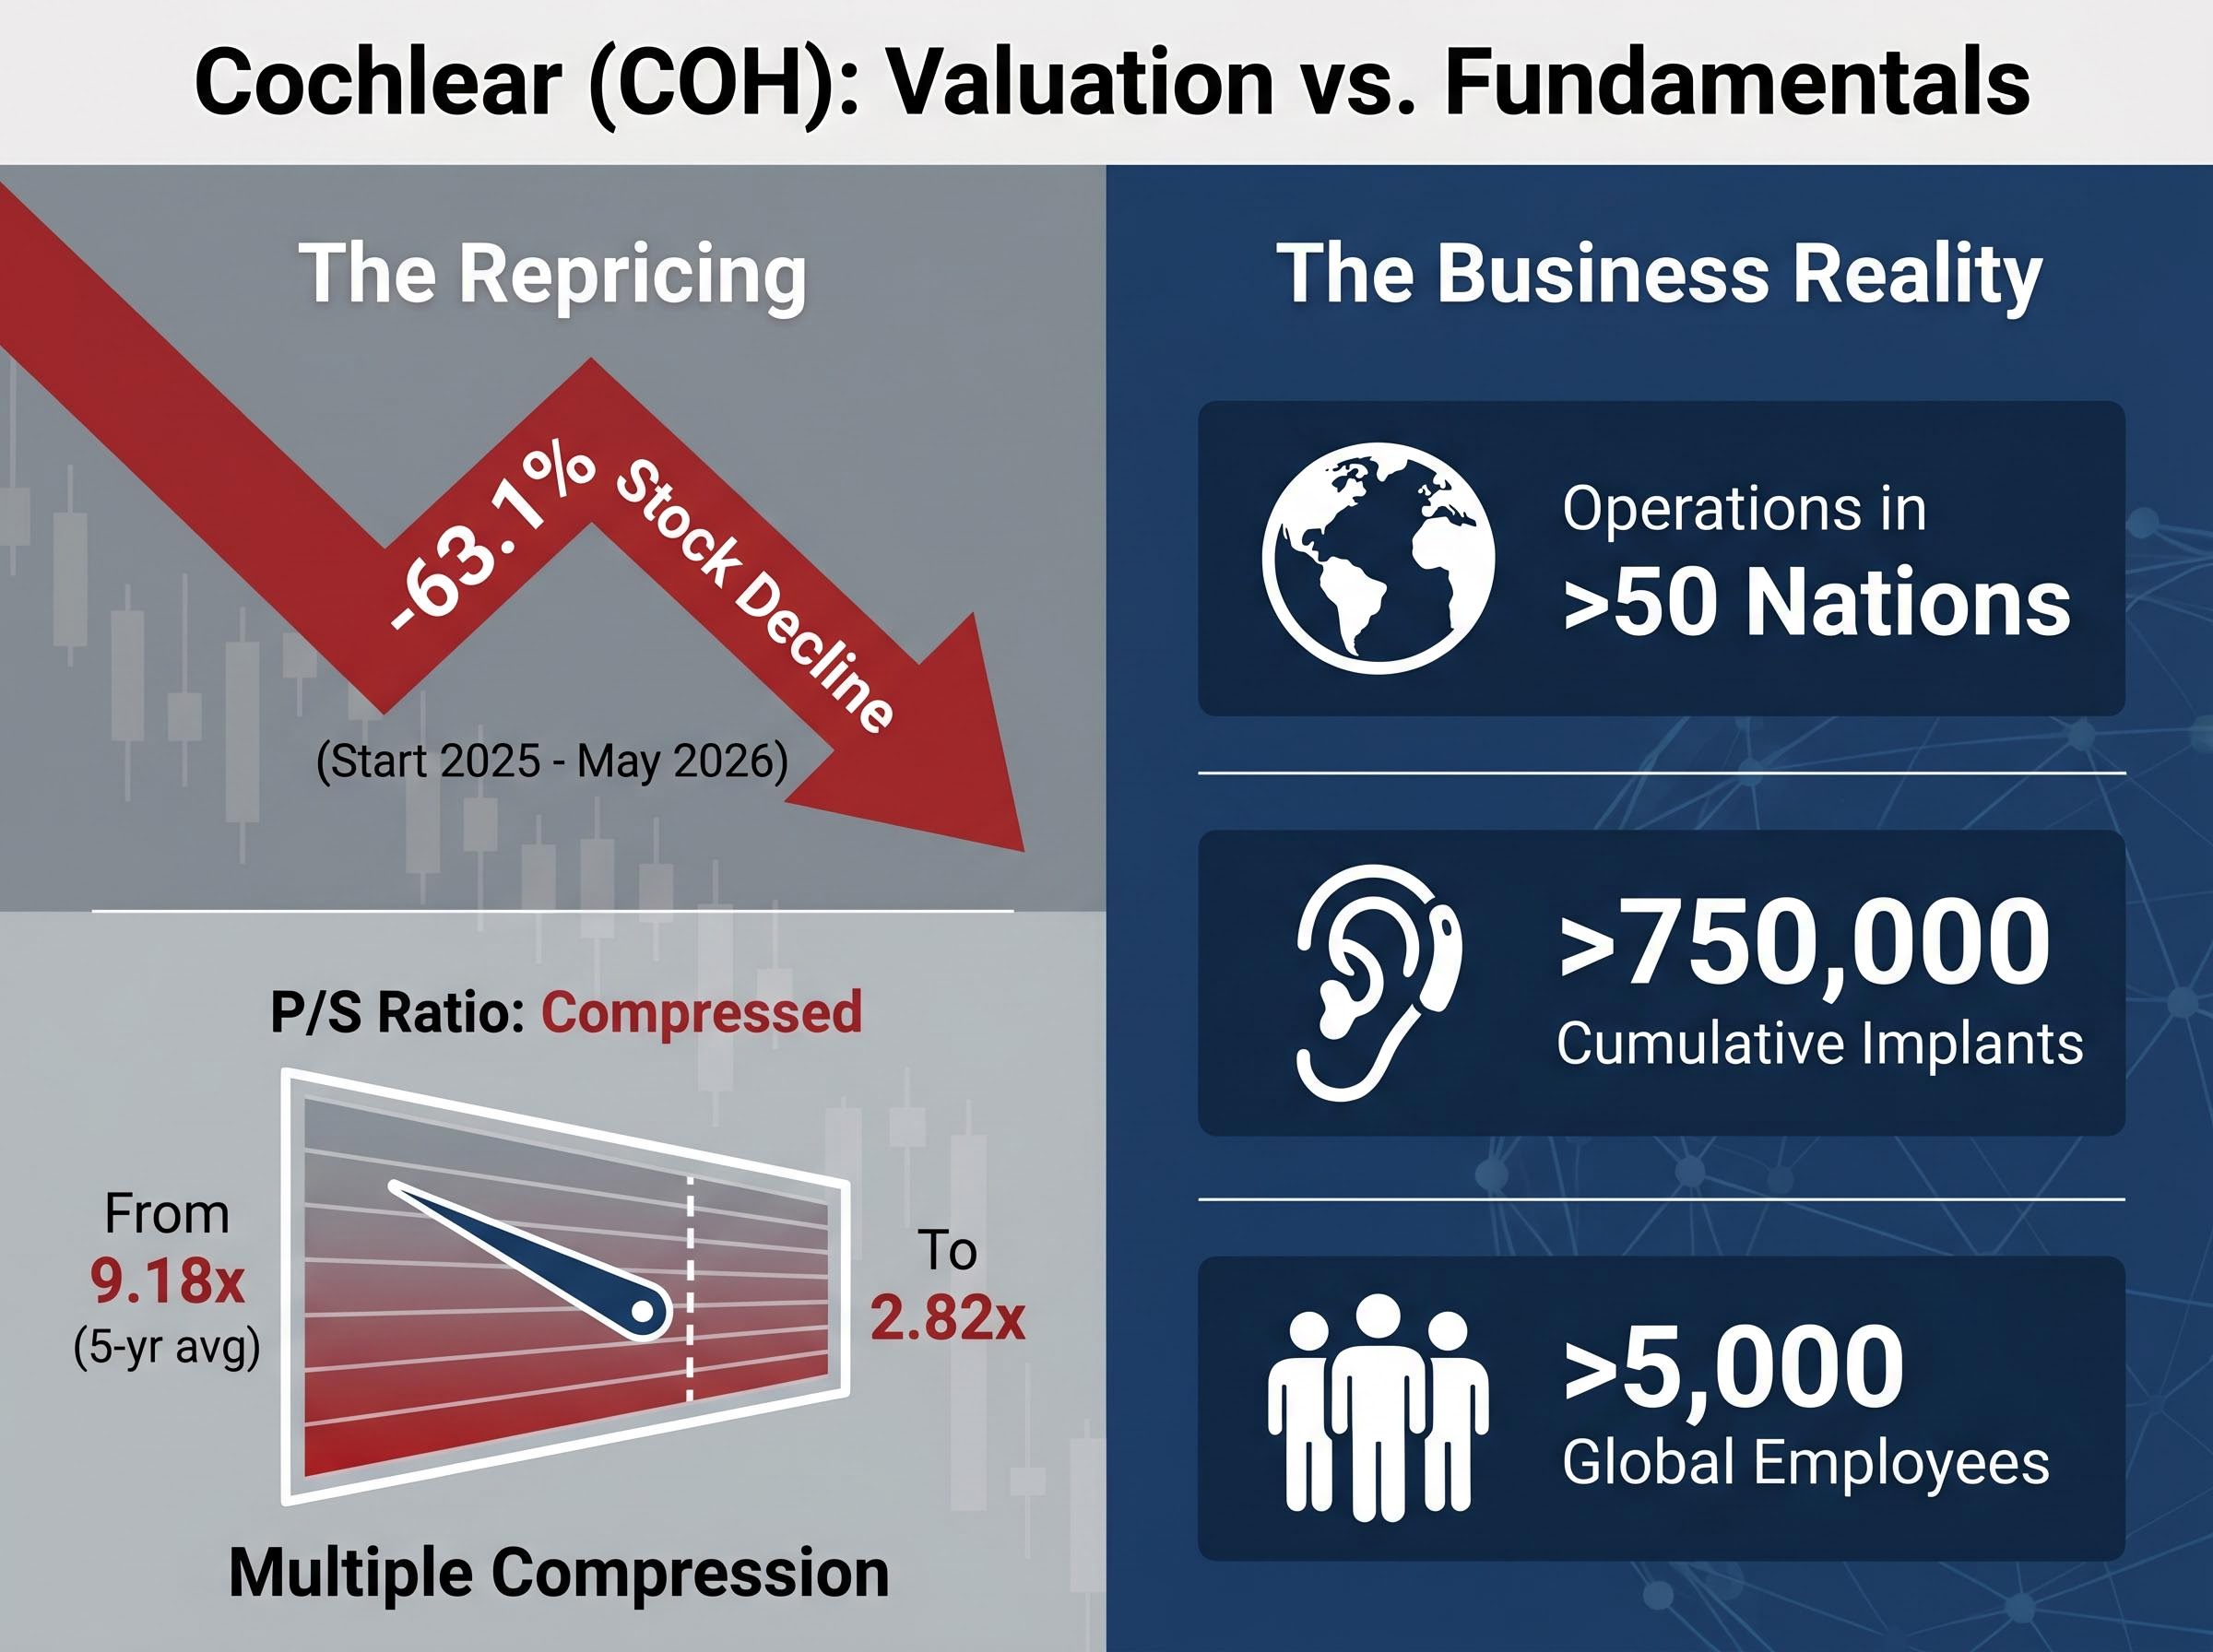
Revenue growth remained positive over the most recent three-year period despite the share price decline. The company employs more than 5,000 people globally.
Analytical questions remain unresolved. The derating may reflect an overreaction to the rate environment, or it may incorporate genuine near-term headwinds including foreign exchange impacts on reported margins and post-COVID procedure volume normalisation. A compressed P/S ratio in isolation does not constitute a buy signal. Investors would need to apply comprehensive valuation methods, including discounted cash flow and dividend discount models, before drawing conclusions about whether the current discount is earned or excessive.
Applying the P/S compression data meaningfully requires fluency with the broader set of fundamental analysis metrics, including EPS, revenue growth rates, profit margins, and return on equity, because a compressed ratio in isolation does not distinguish between a business whose economics have deteriorated and one whose price has simply moved ahead of its underlying value.
Healthcare aligns naturally with ESG and impact investment frameworks, and this alignment could represent an incremental demand-side catalyst for the sector’s re-rating over time. The argument is qualitatively credible, though the available data has limits that are worth stating honestly.
The alignment rests on three themes:
The most current evidence of institutional intent comes from the Morgan Stanley Sustainable Signals Institutional Investors 2025 report, based on surveys conducted in August-September 2025. More than 50% of institutional investors surveyed indicated they intended to raise their sustainable investment exposure.
Australian ESG assets under management are rising, according to periodic reporting from the Responsible Investment Association Australasia (RIAA) and the Australian Sustainable Finance Institute (ASFI). However, no freely available source provides a healthcare-sector-specific breakdown of flows into ASX healthcare equities. The tailwind argument is therefore directional rather than quantified: if institutional ESG allocations continue increasing and healthcare is identified as a natural beneficiary, the incremental capital flow could support sector re-rating independently of the earnings cycle.
The RIAA Responsible Investment Benchmark Report tracks the growth of Australian ESG assets under management across asset classes, providing the most comprehensive publicly available measure of how institutional sustainable capital is being allocated within the domestic market.
The analytical threads converge on a specific tension. A sector with intact structural demand drivers and a 15%-plus digital sub-theme has delivered five years of deeply negative returns, driven primarily by macro forces rather than fundamental deterioration.
The same force that caused the compression, rising interest rates, may now be moderating. If the rate environment stabilises or eases, the valuation architecture that produced the -11.49% annualised return could shift. That does not guarantee recovery, but it changes the forward context materially.
For investors reading the macro rate argument as a sufficient explanation, US structural policy risk, specifically FDA approval instability and the RFK Jr. policy reorientation away from infectious disease prevention, introduces a layer of uncertainty that carries no natural cyclical reversal point and may not resolve even as rate conditions improve.
The XHJ as an index is heavily influenced by its largest constituents and their idiosyncratic issues. Individual ASX healthcare names carry distinct growth profiles and valuation histories that may tell a different story from the headline index return. The divergence between healthcare IT/SaaS names (compounding at double-digit rates with software-like margins) and traditional device and pathology businesses is the primary positioning consideration for investors evaluating sector exposure.
| Factor | Bull Case | Bear Case |
|---|---|---|
| Rate Environment | Rates stabilising or easing supports multiple re-expansion for growth names | Rates remain elevated, sustaining valuation pressure on high-multiple stocks |
| Valuation | Multiples near historical troughs for quality names (e.g. COH P/S at 2.82x vs 9.18x average) | Compressed multiples may reflect rational repricing, not opportunity |
| Sub-sector Growth | Healthcare IT/SaaS growing at 15%-plus annually through 2030 | Premium valuations for IT names may already price in growth expectations |
| ESG Capital | Rising institutional sustainable allocations provide incremental demand | Healthcare-specific ESG flows remain unquantified; tailwind may be overstated |
| Stock-level Risk | Structural demand drivers intact across quality names | Idiosyncratic issues (FX, reimbursement, device recalls) could persist at individual stock level |
Comprehensive valuation tools, including discounted cash flow and dividend discount models, are more appropriate than relying on simple ratios in isolation. The sub-sector a company occupies matters as much as the sector label on its index membership.
Five years of deeply negative returns in a sector where structural demand has not deteriorated, driven primarily by a rate environment rather than business collapse, is a specific kind of analytical signal. It is not, on its own, a buy signal.
The difference between the XHJ as an index and individual ASX healthcare names with distinct growth profiles is where the more productive analysis begins. A headline return of -11.49% per annum reflects the weighted impact of index heavyweights and their idiosyncratic issues. Individual companies operating in healthcare IT and SaaS, or with intact structural demand drivers and compressed valuations, may present a different risk and return profile entirely.
What remains uncertain is timing. Rate environment developments will likely serve as the leading indicator of whether multiple re-rating materialises. Investors considering ASX healthcare exposure may benefit from investigating individual sub-sector names using comprehensive valuation frameworks before drawing conclusions from the XHJ headline alone.
This article is for informational purposes only and should not be considered financial advice. Investors should conduct their own research and consult with financial professionals before making investment decisions. Past performance does not guarantee future results. Financial projections are subject to market conditions and various risk factors.
ASX healthcare shares are equities listed on the Australian Securities Exchange in the healthcare sector, tracked primarily by the S&P/ASX 200 Healthcare Index (XHJ), which includes companies such as CSL, Cochlear, ResMed, and Pro Medicus.
The primary driver was valuation compression caused by rising interest rates, which derated high-multiple healthcare names even as many delivered positive earnings growth; secondary factors included post-COVID procedure normalisation, sector rotation toward banks and resources, and idiosyncratic issues at index heavyweights like CSL and Cochlear.
According to McKinsey analysis referenced in January 2024, US healthcare profit pools are projected to reach US$819 billion by 2027, representing the expanding commercial opportunity that ASX-listed companies with US revenue exposure are positioned against.
Industry consensus projects global healthcare IT, data, and SaaS segments to achieve 15% or more annual revenue growth from 2024 through to 2030, a rate far above the broader XHJ index which delivered an annualised return of approximately -11.49% over five years.
Cochlear's P/S ratio compressed from a five-year average of approximately 9.18x to approximately 2.82x as of May 2026, but analysts caution that a compressed ratio alone does not signal a buying opportunity; comprehensive valuation methods including discounted cash flow models are needed to determine whether the discount reflects deteriorating fundamentals or an overreaction to macro conditions.