How to Apply the Dividend Discount Model to ASX Bank Shares
34 mins ago

A single Westpac share could be worth anywhere from $17.89 to $80.50, depending on two numbers plugged into a formula. Same company, same dividend, wildly different answer. The Dividend Discount Model is one of the most widely referenced tools for valuing income-producing stocks, and Australian bank shares are among its most natural test cases. Westpac Banking Corporation (ASX: WBC), with its FY2025 full-year dividend of $1.53 per share (fully franked) and a share price of approximately $35.84 in May 2026, provides the live worked example throughout this article. By the end, readers will understand how the DDM formula works, how to run a scenario matrix using real Westpac data, why franking credits materially change the output for Australian investors, and why no single DDM number should ever be treated as a definitive fair value.
The DDM rests on two questions every income investor eventually asks: what cash will this asset generate, and what return do I require for owning it? The model translates those questions into a single formula, and the mechanics of that formula explain why small changes in assumptions produce dramatic swings in the result.
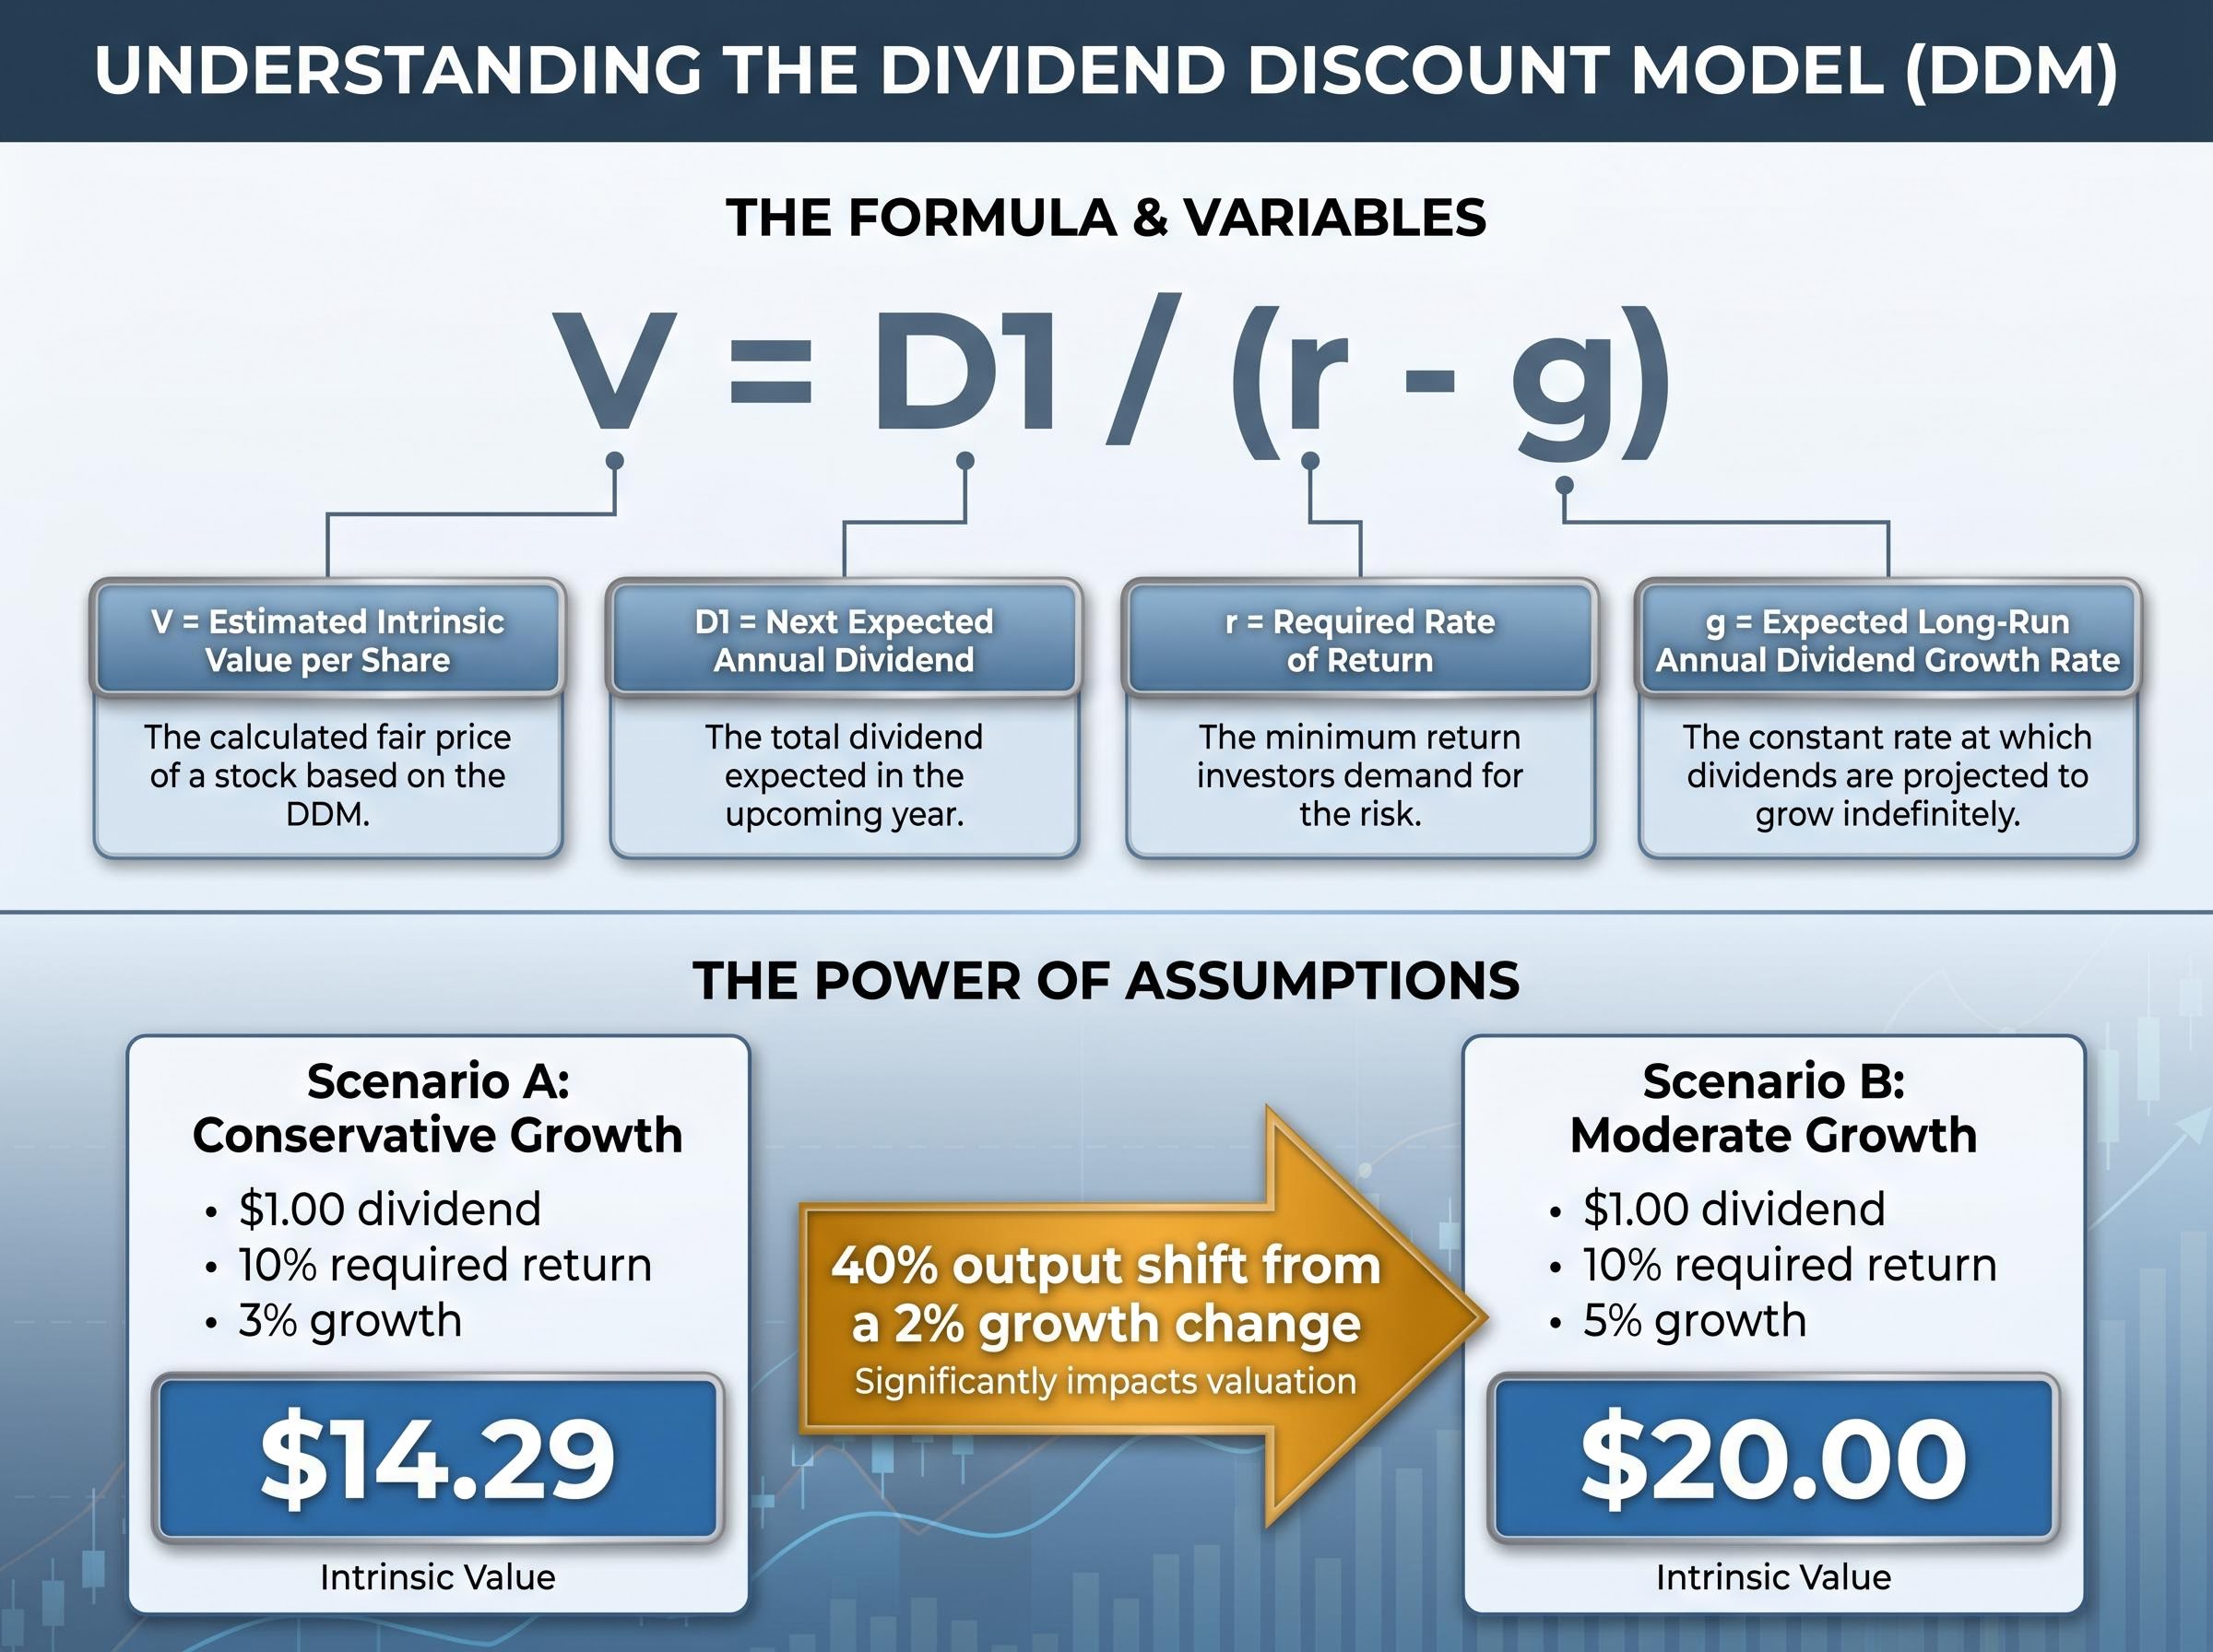
The DDM formula (Gordon Growth Model): V = D1 / (r – g)
Each variable carries a specific meaning:
The denominator, r minus g, is doing most of the work. When the required return and growth rate sit close together, the denominator shrinks, and the output inflates. When they sit far apart, the output compresses. A 1% shift in either variable can move the estimated value by 20-30% or more.
D1 is typically the next 12-month forward dividend, not the most recent historical figure, which makes the choice of base dividend and growth assumption analytically significant. The required return (r) reflects the minimum annual return the investor demands for holding the stock, incorporating risk. The growth rate (g) captures how quickly dividends are expected to increase over time.
A simple illustration before moving to real figures: a $1.00 forward dividend, a 10% required return, and a 3% growth rate produce V = $1.00 / (0.10 – 0.03) = $14.29. Change the growth rate to 5% and the same dividend produces $20.00. The formula is identical; the assumption changed by two percentage points; the output moved by 40%.
The DDM assumes a steady, predictable dividend stream stretching into the future. Mature, high-payout companies that have delivered consistent dividends over long periods are where that assumption holds most comfortably. Australia’s major banks, including Westpac, fit that profile across most economic cycles.
The structural reasons why certain ASX sectors suited to DDM application produce more defensible valuations than others come down to payout predictability: regulatory constraints on banks, mandated distribution requirements on REITs, and infrastructure concession structures all reduce the dividend forecast uncertainty that makes the growth rate assumption so consequential.
Westpac’s financials reinforce the case. The bank reported FY2025 full-year dividends per share of $1.53, fully franked (76 cents interim plus 77 cents final). It has already declared an FY2026 interim dividend of 77 cents per share, fully franked, announced on 5 May 2026. Management targets a 65-75% cash earnings payout ratio over the medium term, and the bank’s key metrics sit above the sector average.
| Metric | Westpac | Sector average |
|---|---|---|
| Net interest margin (NIM) | 1.93% | 1.78% |
| Return on equity (ROE) | 9.7% | 9.35% |
| CET1 capital ratio | 12.5% | Varies by peer |
None of this makes the DDM bulletproof. The model’s core assumption, that dividends grow at a constant rate indefinitely, runs into three structural limits when applied to banks:
APRA Prudential Standard APS 110 sets the minimum CET1 capital ratio requirements for authorised deposit-taking institutions, and when APRA raises those thresholds, banks must retain more capital internally rather than distributing it to shareholders as dividends.
These limits do not disqualify the DDM. They govern how its output should be interpreted.
Rather than producing a single fair value estimate, the most responsible way to use the DDM is to model a range of assumptions and observe how the output shifts. The base dividend is $1.53 per share (FY2025 full-year, fully franked). Applying modest growth assumptions of 2%, 3%, and 4% annually generates the forward dividend (D1). The discount rate range of 9%, 10%, and 11% reflects a pre-personal-tax required return consistent with a major Australian bank’s risk profile.
The matrix below shows the estimated intrinsic value per share at each combination.
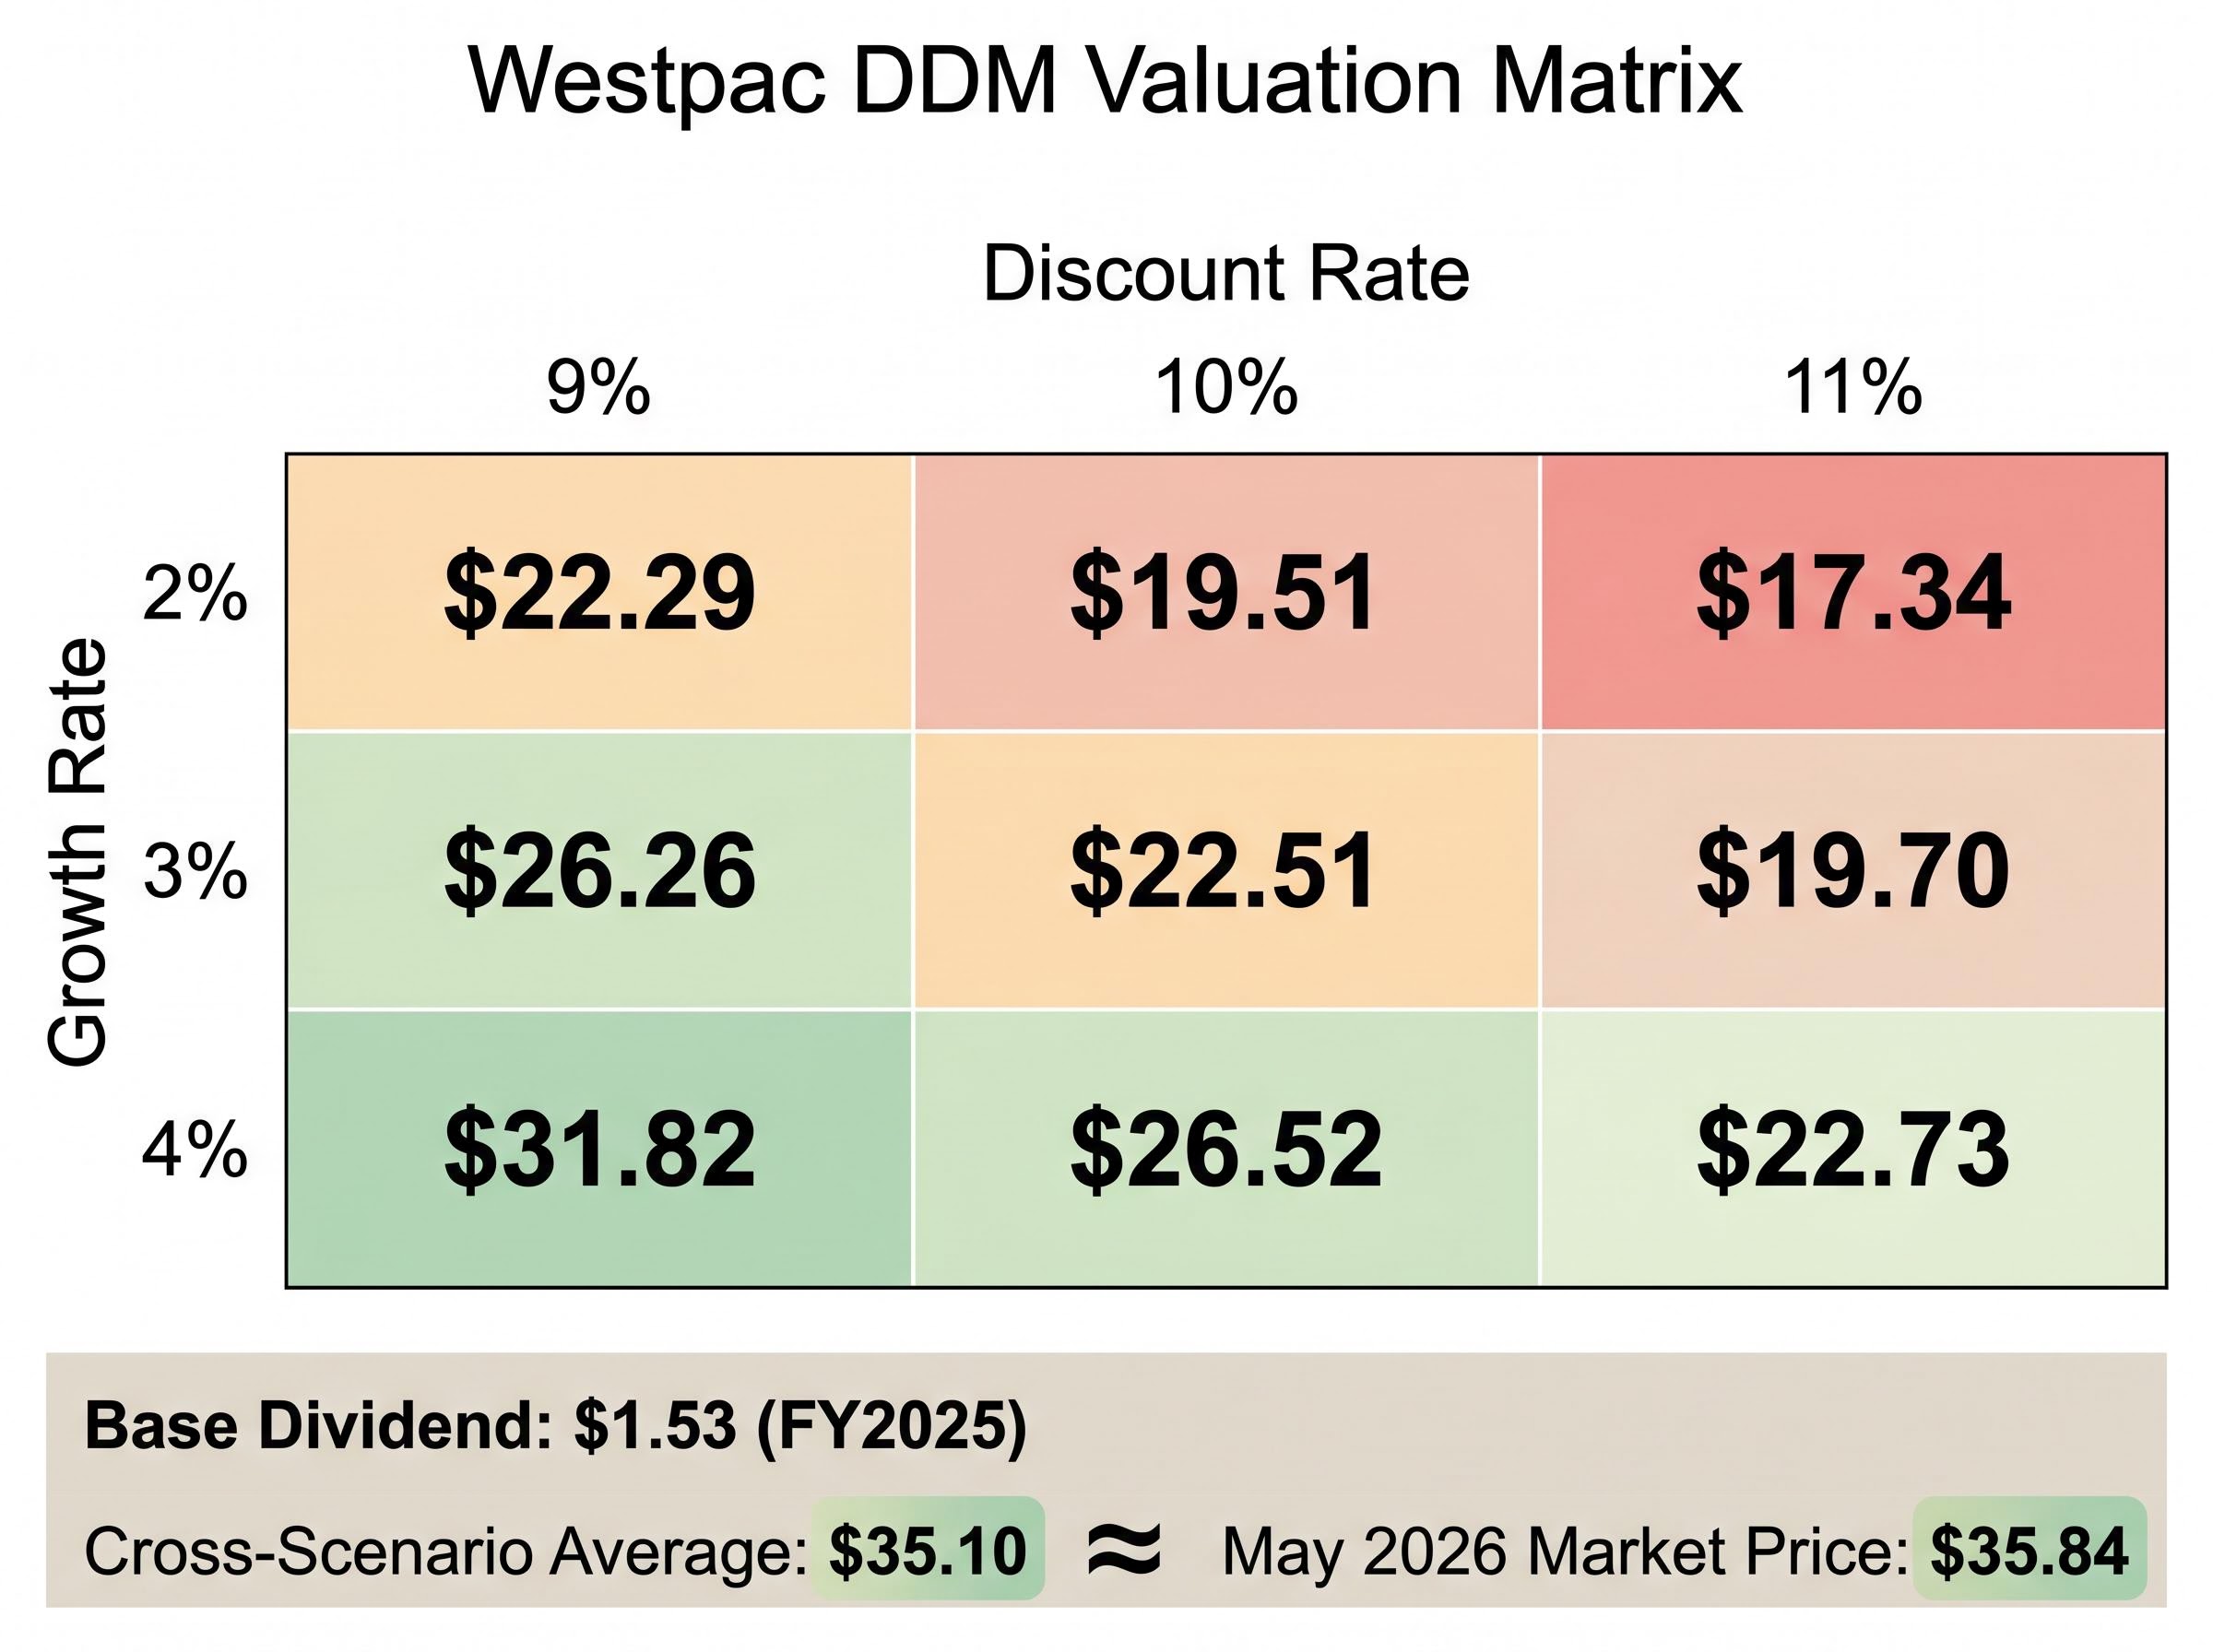
| Growth rate (g) | Discount rate 9% | Discount rate 10% | Discount rate 11% |
|---|---|---|---|
| 2% | $22.29 | $19.51 | $17.34 |
| 3% | $26.26 | $22.51 | $19.70 |
| 4% | $31.82 | $26.52 | $22.73 |
At the most conservative combination (11% discount rate, 2% growth), the model implies a value near $17. At the most optimistic within this range (9% discount rate, 4% growth), the output approaches $32. Extending the discount rate range further, as the full research scenario set does (from 6% to 11%), produces values spanning from $17.89 to $80.50, demonstrating how the denominator’s sensitivity amplifies at the extremes.
The cross-scenario average on a cash dividend basis is approximately $35.10 per share. Westpac’s market price in May 2026 sits at approximately $35.84, placing the stock within a narrow band of the DDM’s central estimate.
That proximity is informative but not a verdict. It means the market price is consistent with a reasonable middle-ground set of assumptions. Whether those assumptions prove accurate depends on how the credit cycle, interest rates, and bank earnings evolve from here.
For Australian tax-resident investors, the DDM analysis above is incomplete. Westpac’s dividends are fully franked, meaning the company has already paid 30% corporate tax on the earnings behind each dividend. Eligible investors receive that tax as a credit, effectively increasing the economic value of the income stream.
The mainstream practitioner approach for incorporating franking into a DDM is straightforward:
This method, recommended by Australian practitioner commentary including Marcus Today and Australian Stock Report, avoids the complexity of reducing the discount rate itself, which can obscure the meaning of “required return” for retail investors.
The impact is material. When the full scenario matrix is recalculated using grossed-up dividends, the cross-scenario average rises to approximately $48.64 per share, compared to $35.10 on a cash-only basis. For context, a 5% fully franked yield is approximately equivalent to a 7.1% pre-tax yield for investors who can fully utilise the credits.
Franking credit value is investor-specific. The full benefit accrues only to Australian investors who can utilise the credits against their tax liability. Superannuation funds, individual taxpayers, and self-managed super funds in pension phase each receive different levels of benefit. Foreign investors cannot use Australian franking credits at all.
The ATO dividend imputation rules confirm that foreign investors cannot utilise Australian franking credits, making the grossed-up DDM calculation applicable only to Australian tax residents who can offset the credits against their own tax liability.
Australian individual taxpayers with sufficient taxable income receive the full franking credit offset. Superannuation funds in accumulation phase pay a 15% concessional rate and receive a partial credit; those in pension phase (paying 0% tax) may receive a full refund of excess credits. Foreign investors receive no franking benefit, making the cash-only DDM the appropriate model for non-resident holders.
The Westpac scenario matrix makes the DDM’s core sensitivity visible. At a fixed 10% discount rate, moving growth from 2% to 4% shifts the estimated fair value from approximately $19.51 to $26.52, a gap of more than $7 per share from a two-percentage-point change in a single assumption. Across the full extended scenario set (discount rates from 6% to 11%, growth from 2% to 4%), the output range spans more than $60 per share, from $17.89 to $80.50.
This is not a failure of the model. It is the model being honest about the uncertainty embedded in any long-run dividend forecast.
Income-seeking investors should also be aware of the dividend trap concept: a high visible yield that attracts buyers, but where the dividend itself is at risk. When credit losses rise or regulators constrain payouts, dividends can be cut or suspended. The COVID-era cuts by all four major Australian banks demonstrated this risk in practice.
Practitioners across Livewire Markets, Intelligent Investor, and the Australian Stock Report recommend running DDM as one input alongside price-to-earnings and price-to-book multiples rather than as a standalone verdict. The majority of brokers covering Westpac in 2025-2026 rate the stock Hold or Neutral, with a consensus price target in the mid-$30s per share, broadly consistent with the DDM’s central cash-only scenario.
A PE and DDM cross-check for bank shares addresses one of the practical limitations of running these models in isolation: when both methods converge on a similar price range, the analyst has stronger grounds for a view than when they diverge, and the NAB case study in that analysis demonstrates precisely this triangulation process with publicly available data.
ASIC’s Moneysmart guidance warns investors against relying on a single valuation metric when making investment decisions, a principle that applies directly to DDM outputs.
ASIC/Moneysmart principle: Single-metric investing understates the complexity of the risk being taken. Investors should stress-test assumptions, diversify analytical approaches, and consider business risks, regulatory changes, and economic cycles alongside any model output.
The four risk categories to keep in mind when using DDM for bank stocks:
On a cash dividend basis, the cross-scenario average of approximately $35.10 sits marginally below Westpac’s $35.84 market price in May 2026. This suggests the stock is broadly fairly valued if the underlying growth and discount rate assumptions prove accurate. Factoring in franking credits lifts the central estimate to approximately $48.64, which implies meaningful upside for investors who can fully utilise those credits.
The more useful interpretation is diagnostic rather than directional. The DDM does not tell the investor whether to buy or sell. It tells them what the market is implicitly assuming about future dividend growth and required return at the current price, which they can then evaluate against their own views. The FY2026 interim dividend of 77 cents per share, fully franked (announced 5 May 2026), confirms dividend continuity through early FY2026 and supports the assumption that Westpac’s payout trajectory remains intact for now.
The practitioner checklist for using DDM responsibly:
What the Westpac DDM output tells investors:
What it does not tell investors:
The DDM is a framework for interrogating assumptions, not a machine that produces certainty. The Westpac exercise demonstrates that the same $1.53 dividend stream, depending on the return required and the growth expected, implies a fair value anywhere from deeply cheap to significantly overpriced.
Franking credits are real economic value for eligible Australian investors. Ignoring them in any DDM analysis of a fully franked stock systematically understates what the income stream is worth. The grossed-up central estimate of approximately $48.64 compared to the cash-only $35.10 quantifies that gap.
As readers build their own analysis, the productive questions are not “what is the DDM fair value?” but rather: what growth and return assumptions am I making, do I believe them, and what happens to the output if I am wrong?
For readers wanting to build a full valuation framework beyond the DDM, our comprehensive walkthrough of multi-method ASX valuation covers a structured five-step sequence using P/S, EV/EBITDA, DCF, and DDM together, including how to use the methods as cross-checks on each other and how to gross up franking credits within the DDM step.
This article is for informational purposes only and should not be considered financial advice. Investors should conduct their own research and consult with financial professionals before making investment decisions. Past performance does not guarantee future results. Financial projections are subject to market conditions and various risk factors.
The Dividend Discount Model (DDM) estimates a stock's intrinsic value by dividing the expected next annual dividend by the difference between the required rate of return and the expected dividend growth rate. Small changes in either the growth rate or discount rate can produce dramatically different valuations, which is why analysts typically model a range of scenarios rather than a single figure.
For Australian tax-resident investors, fully franked dividends carry an attached tax credit equal to the 30% corporate tax already paid, which increases the effective economic value of the income stream. In the Westpac example, grossing up the $1.53 cash dividend by dividing by 0.70 produces a $2.19 gross equivalent, lifting the cross-scenario DDM average from approximately $35.10 to approximately $48.64 per share.
The Westpac DDM matrix uses dividend growth rates of 2%, 3%, and 4% annually, combined with pre-personal-tax discount rates of 9%, 10%, and 11%, producing estimated intrinsic values ranging from approximately $17.34 to $31.82 per share on a cash-only basis. Extending the discount rate range from 6% to 11% expands the full output range to between $17.89 and $80.50.
Major Australian banks like Westpac tend to have long histories of consistent, predictable dividend payments and clearly stated payout ratio targets, which align with the DDM's core assumption of a steady, growing dividend stream. However, the model's outputs must still be stress-tested against credit cycle risk, APRA capital requirements, and the possibility of dividend cuts, as occurred across all four major banks during the COVID-19 period.
When the DDM's cross-scenario central estimate sits close to the current market price, as is the case with Westpac's cash-only DDM average of approximately $35.10 versus its May 2026 price of approximately $35.84, it suggests the market is pricing in a moderate growth rate and reasonable required return rather than signalling the stock is obviously cheap or expensive. Practitioners recommend cross-checking this result against price-to-earnings and price-to-book multiples before drawing any conclusion.