The top 1% of adults globally own roughly 45-47% of all wealth. Gold has appreciated approximately 98.5% in two years. Multiple equity indices have reached consecutive record highs in 2026. The financial headlines describe a thriving economy. A first-time buyer locked out of the housing market in Sydney, London, or Toronto might reasonably ask: thriving for whom?
That question is not rhetorical. In the first half of 2026, record or near-record equity valuations have coincided with historically severe housing affordability stress across every major advanced economy. The two trends are not coincidental. The Federal Reserve, the European Central Bank (ECB), the International Monetary Fund (IMF), and the Bank of England now formally accept that asset price gains are distributionally regressive, accruing overwhelmingly to households that already own financial assets and property.
What follows is an analysis of why high asset valuations are better understood as a symptom of concentrated wealth than a sign of broad prosperity, how the mechanism operates across housing and financial markets, and what the evidence says about structural remedies. The aim is a framework for reading market headlines through a distributional lens rather than an aggregate one.
Record markets, record exclusion: what the headlines miss
The empirical tension is stark. Consider the performance figures from recent months alone:
- US and Japanese equity markets posted all-time highs on consecutive days (27-28 April 2026)
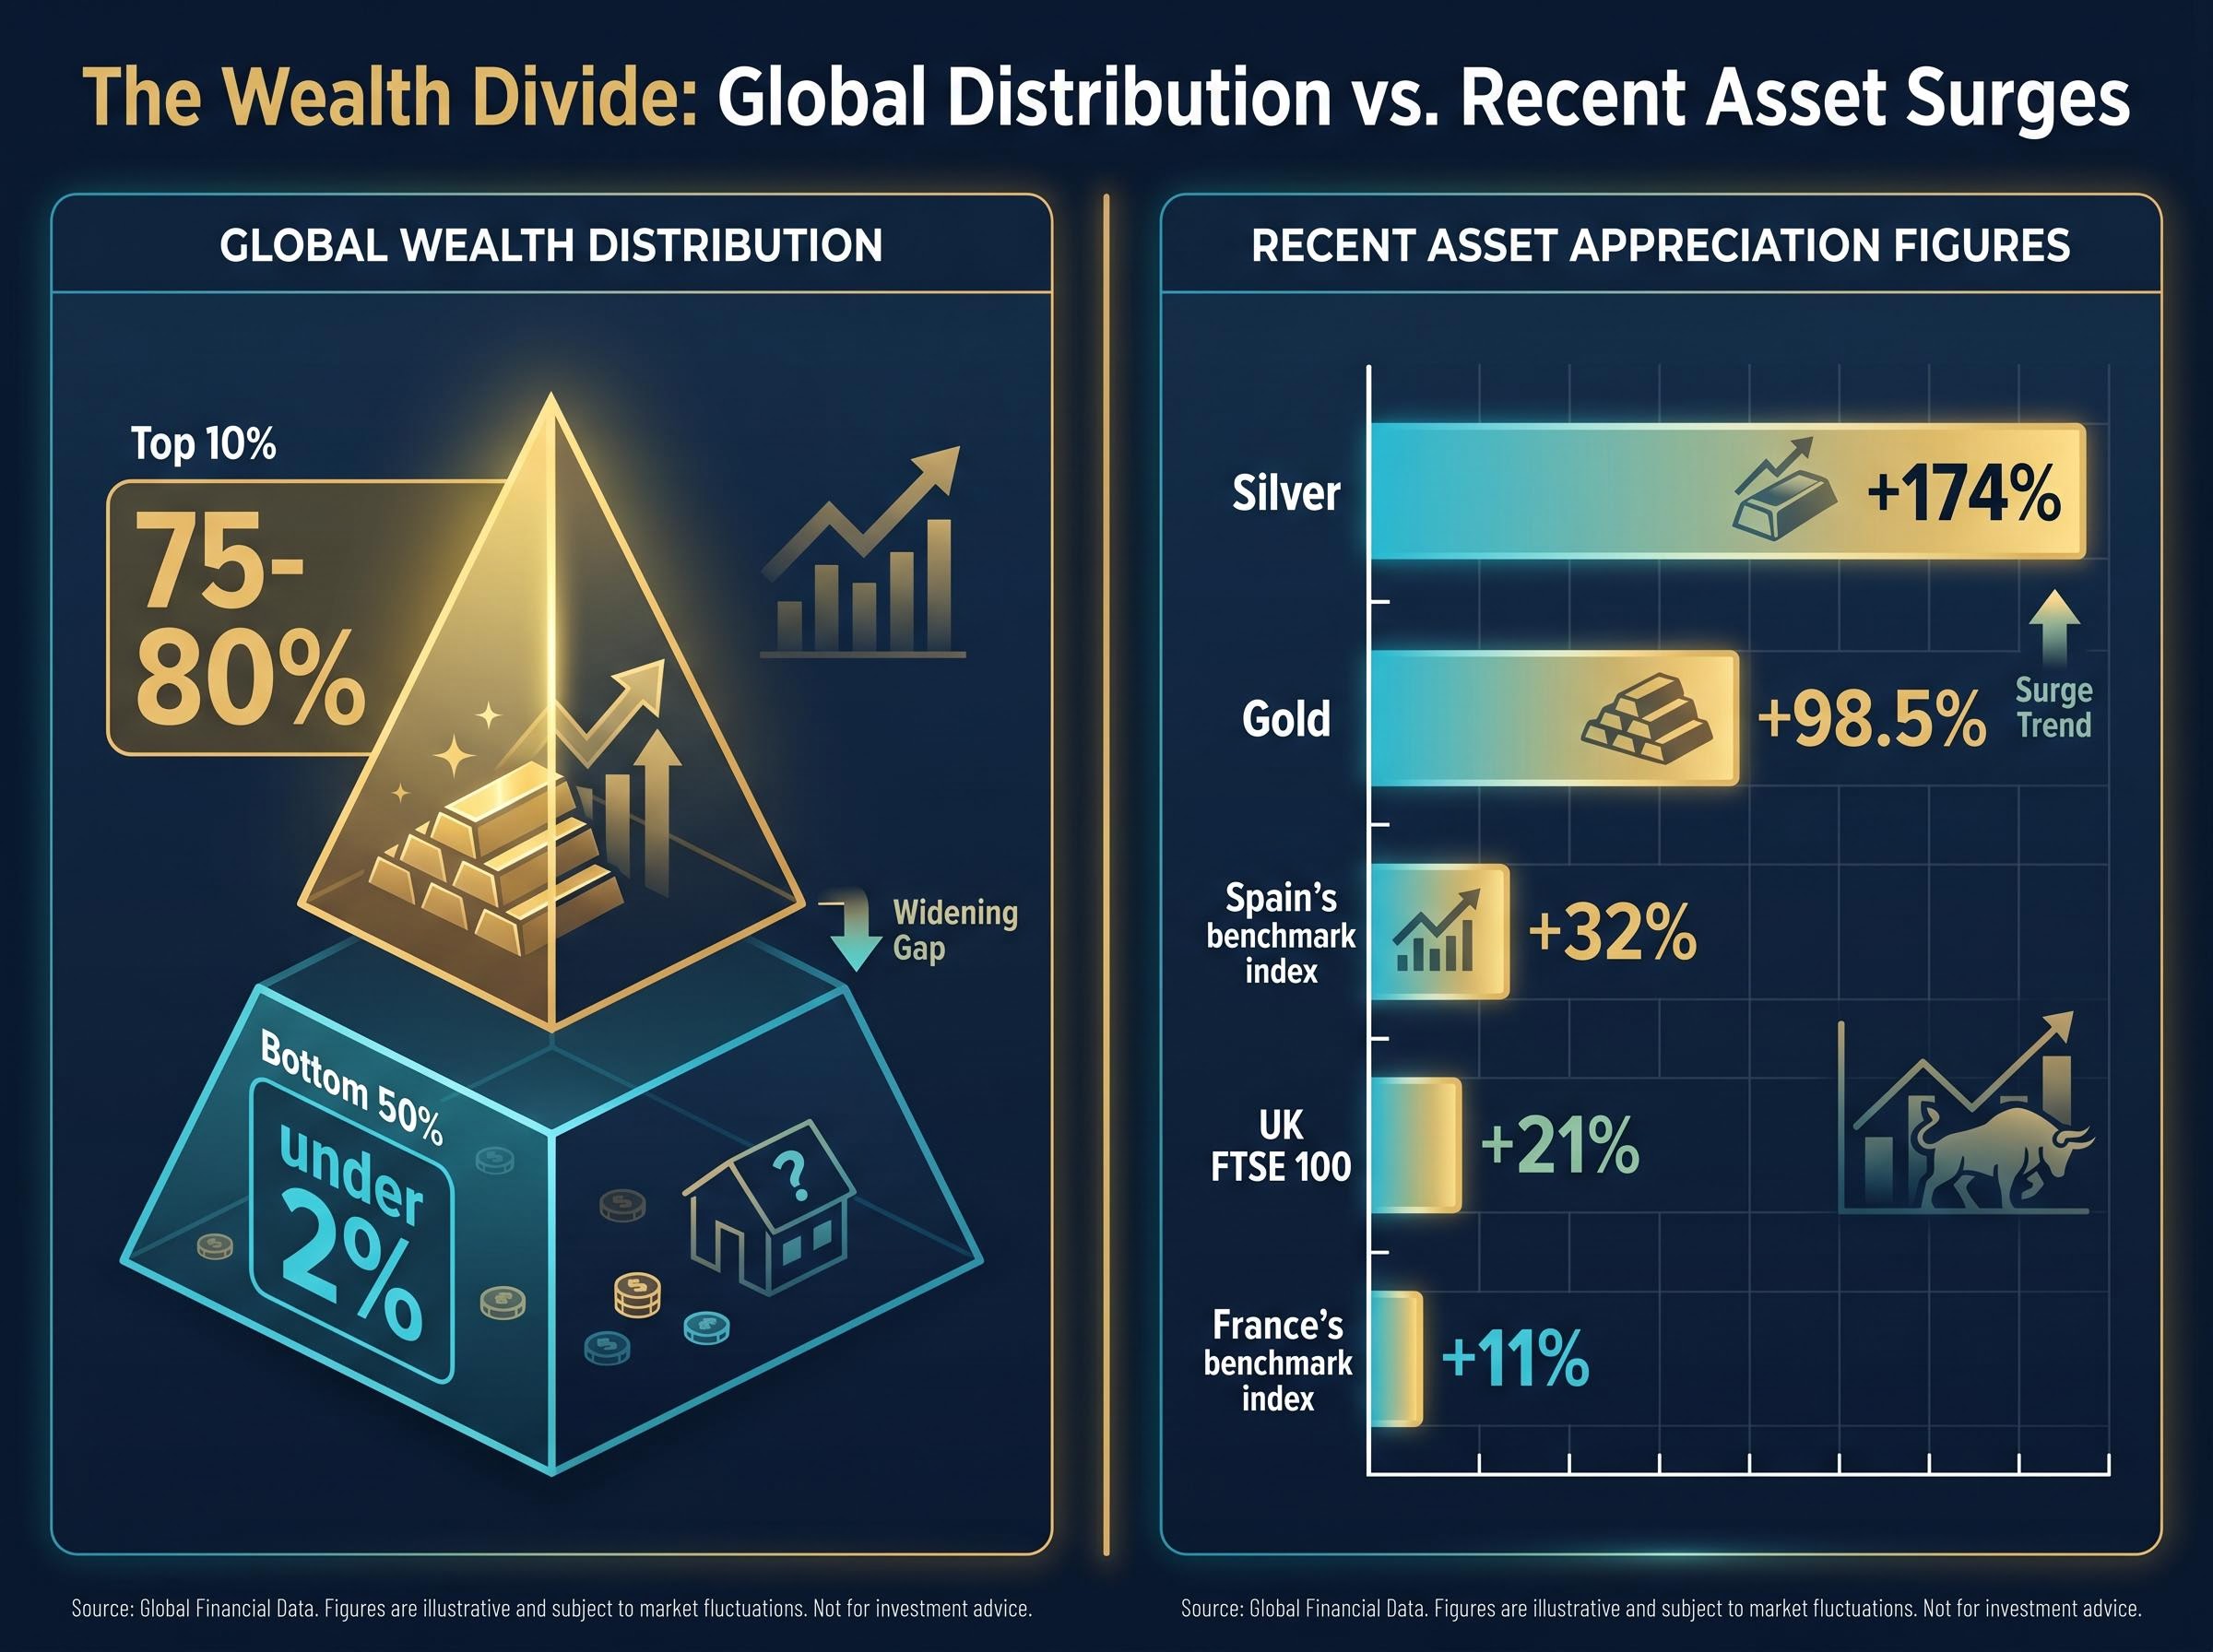
- Gold appreciated approximately 98.5% over the preceding two years; silver roughly 174%
- The UK FTSE 100 rose approximately 21% year-over-year
- Spain’s benchmark index climbed approximately 32%; France’s approximately 11%
These are not marginal gains. They represent a sustained, multi-geography surge in asset valuations. At the same time, homeownership access for median-income households has deteriorated in every one of those economies.
The top 10% of adults globally own 75-80% of all wealth. The bottom 50% own under 2%, according to the World Inequality Database.
That ownership structure is the mechanism that turns asset price gains into a regressive redistribution event. When equity indices rise, the gains accrue to those who hold equities. When housing prices rise, the wealth accrues to those who own property. Oxfam’s 2024-2025 reporting documents that billionaire wealth surged far faster than wages during the same period. Asset price inflation is not a neutral macroeconomic event. It is a transfer mechanism, and the direction of the transfer is predictable from the ownership data.
That ownership structure is the mechanism that turns asset price gains into a regressive redistribution event. The World Inequality Database documents that the top 10% of adults globally hold 75-80% of all wealth, while the bottom 50% hold under 2%, a concentration severe enough that any broad-based asset price surge will mechanically widen the gap between owners and non-owners.
When big ASX news breaks, our subscribers know first
Crisis, response, and rising valuations: the pattern across seven decades
The pattern is not new. It repeats with enough regularity to constitute a structural feature of modern economies rather than a coincidence.
- 2008: The global credit crisis produced bank bailouts, fiscal expansion, and near-zero base rates across advanced economies. Equity and housing valuations recovered within years and then exceeded pre-crisis peaks.
- 2011: The European sovereign debt crisis triggered ECB intervention, further rate compression, and asset purchases. Valuations rose.
- 2020: COVID-19 prompted the largest peacetime fiscal expansions on record. Within 18 months, most equity markets had surpassed pre-pandemic highs.
- 2026: Despite rate hikes, geopolitical disruption, and persistent inflation, asset valuations have climbed to new records.
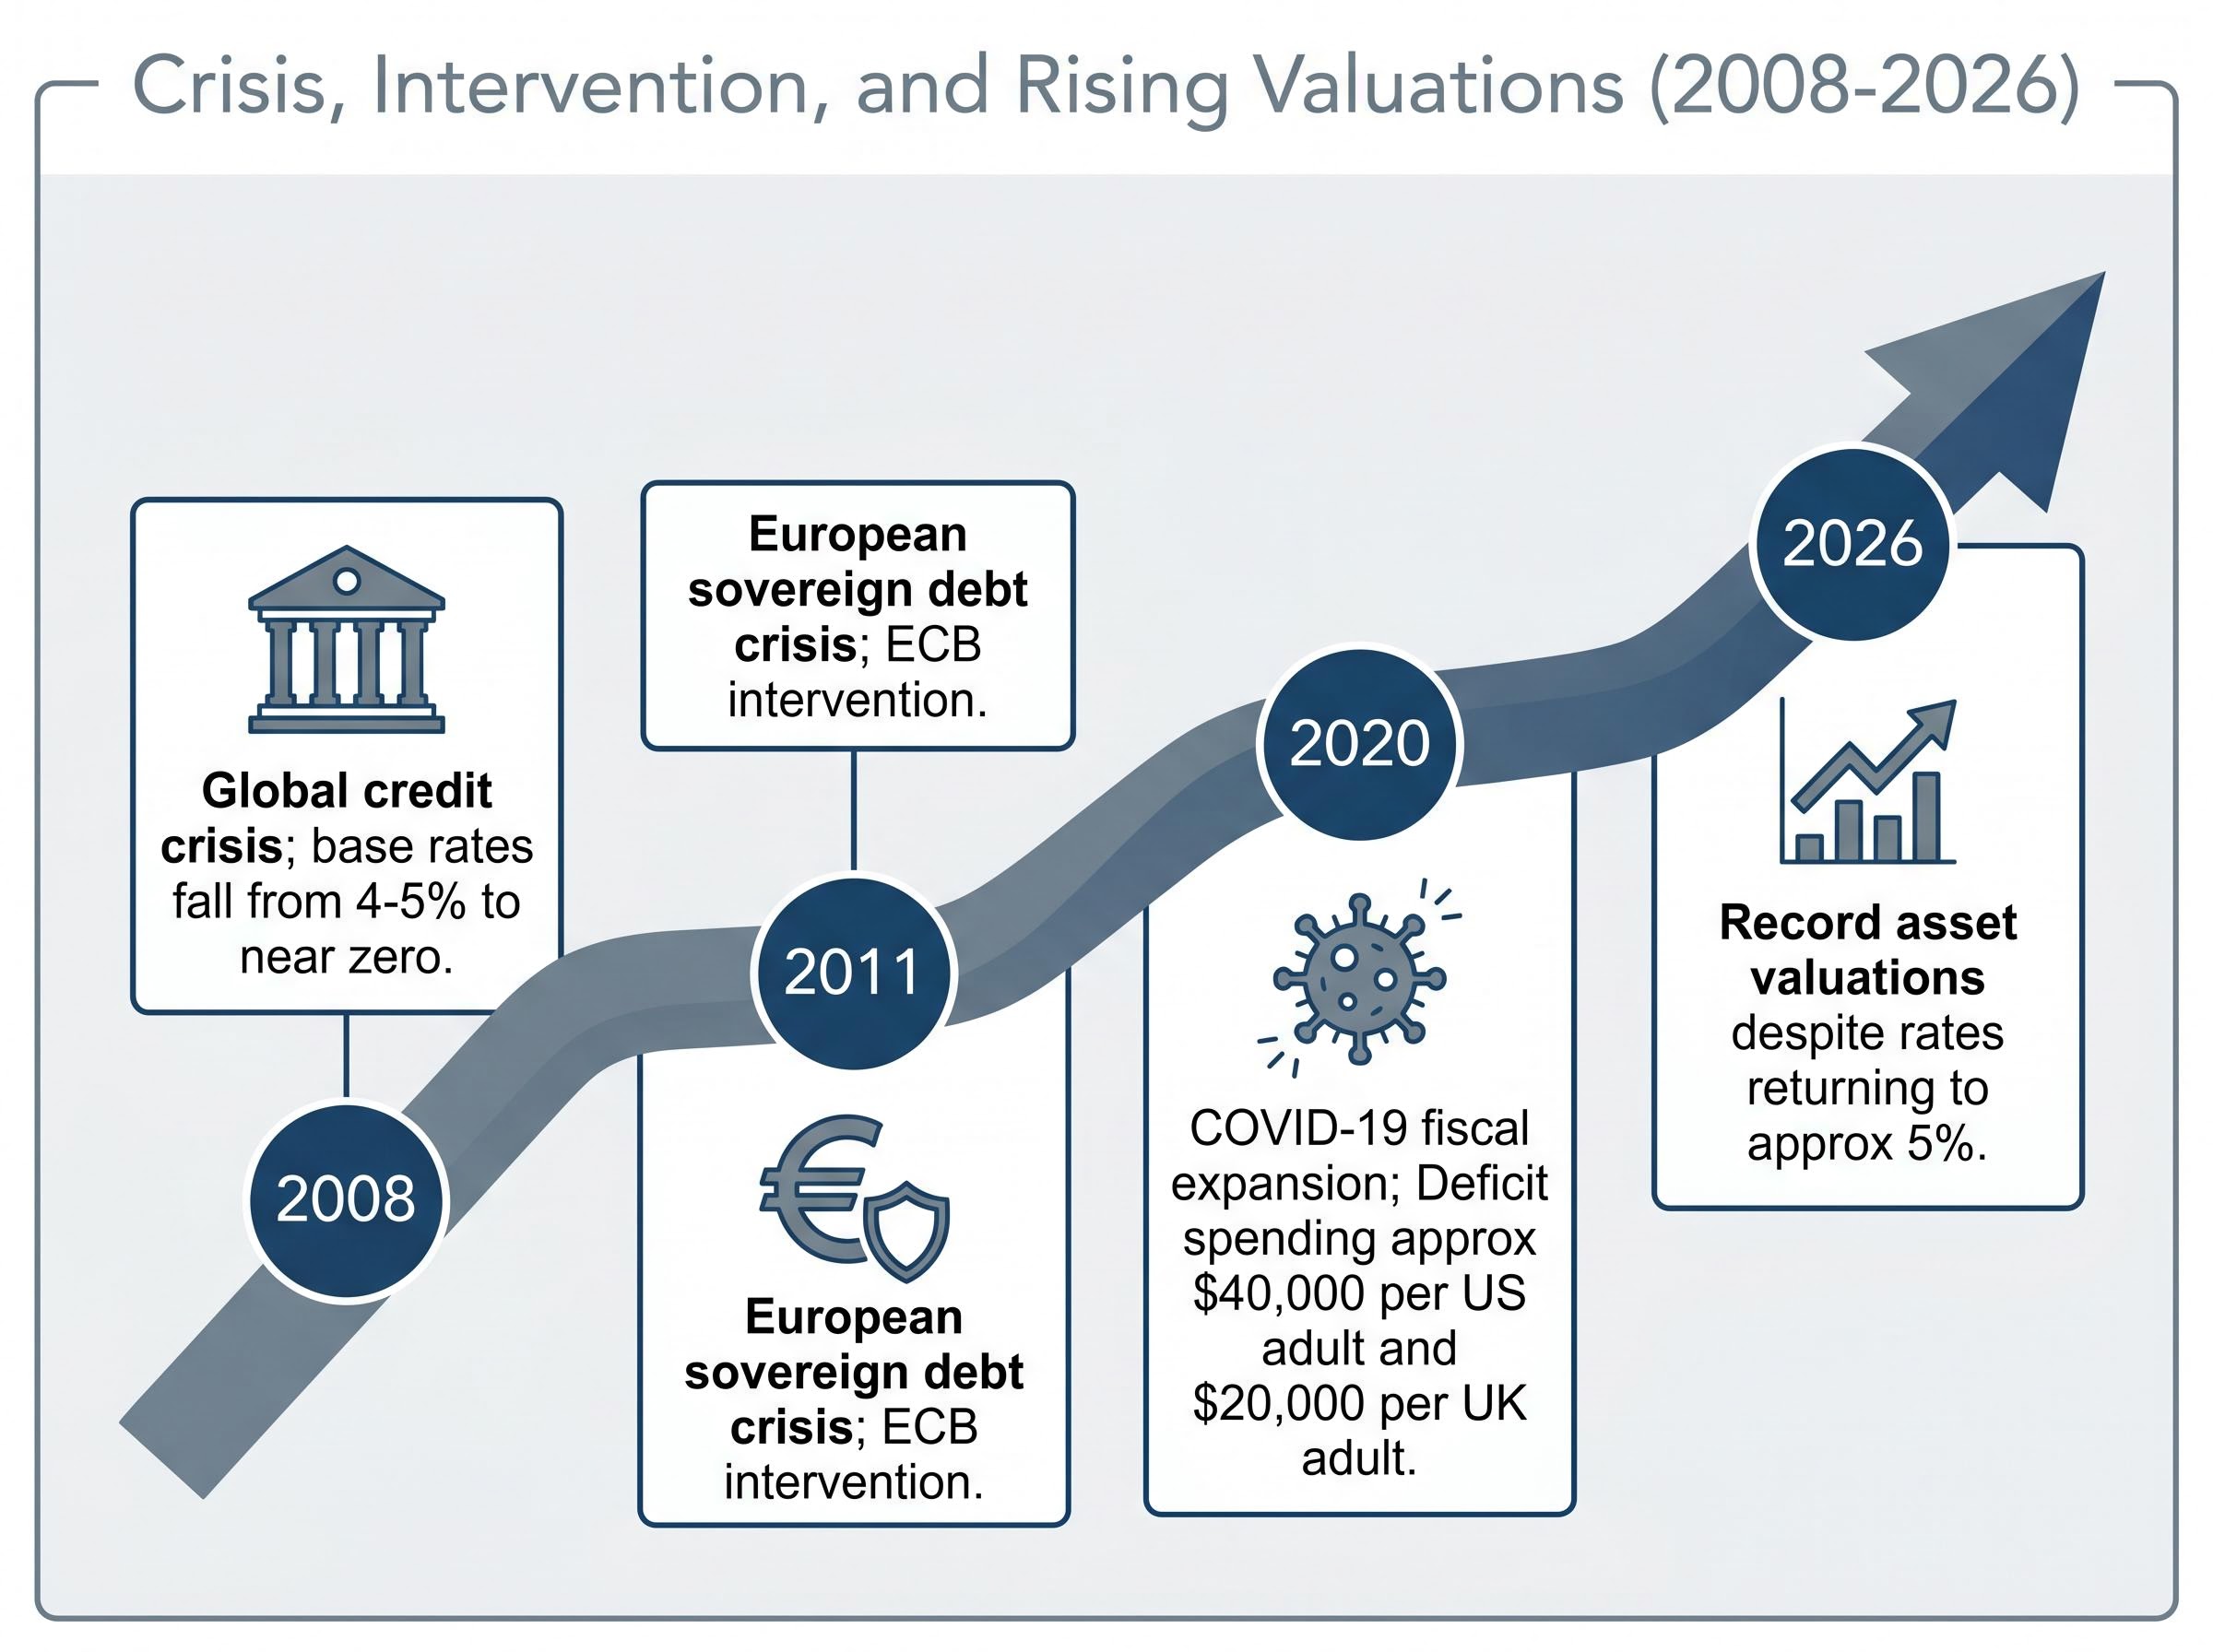
The standard explanation points to interest rates. Western base rates fell from approximately 4-5% to near zero after 2008, making future cash flows more valuable in present terms and inflating asset prices mechanically. A property generating $50,000 annually values at roughly $1 million at a 5% discount rate and approximately $5 million at 1%. That arithmetic is real.
It is also incomplete. After COVID, central banks raised rates back to approximately 5%. Asset prices should have corrected accordingly. They did not. Equities continued advancing. Housing remained unaffordable. The rate-based explanation broke down precisely when it was most needed.
The deficit mechanism: who ends up holding the cash
The more durable explanatory variable is fiscal. During COVID, UK deficit spending amounted to approximately $20,000 per adult; the US equivalent was approximately $40,000 per adult. When governments run deficits of that scale, someone accumulates the corresponding financial claims. Those somebodies are disproportionately high-net-worth households, the owners of businesses that received government contracts, the holders of government bonds, the shareholders of companies that absorbed fiscal stimulus.
Wealthy households face no meaningful liquidity constraint. Additional cash does not flow into consumption in proportion to the windfall. It flows into assets: equities, property, commodities, gold. The result is upward price pressure on exactly the assets that already serve as stores of concentrated wealth.
The relationship between deficit spending and asset inflation is more precise than the standard narrative allows: IMF research estimates that each $1 trillion in government deficit spending correlates with approximately 8% in asset price gains, with the top 10% of households capturing around 70% of those gains through their disproportionate portfolio holdings.
The cost of owning nothing: how asset inflation harms ordinary households
Housing is where most households encounter asset price inflation at its most concrete. The data across advanced economies tells a consistent story of structural exclusion, not a temporary affordability blip.
| Country | Primary Affordability Barrier | Institutional Source | Severity Characterisation |
|---|---|---|---|
| United States | Compounding price, mortgage rate, insurance, and property tax burden; low-rate lock-in constraining inventory | Federal Reserve, Realtor.com, Redfin | Median-income households priced out of major metro areas |
| United Kingdom | Deposit requirement far exceeding savings capacity for younger households | Bank of England, ONS | Price-to-earnings ratio far above long-run historical norms |
| Australia | Home prices and rents running materially ahead of income growth | Housing commissions, major bank research | Sydney and Melbourne among the world’s most severe affordability stress |
| Canada | Benchmark home prices far above income growth in major markets | CMHC, CREA | Homeownership increasingly concentrated among existing owners |
| Euro-area cities | Inelastic urban housing supply; rising renter cost burden | ECB, OECD | Younger households delayed or entirely excluded from ownership |
The problem compounds. Elevated prices sit alongside elevated financing costs, creating a double squeeze that is historically unusual in its severity. In the US, even where nominal house price growth slowed, affordability worsened because mortgage rates remained high. Existing owners holding low fixed-rate mortgages have little incentive to sell, constraining inventory and keeping prices elevated while transactions dry up. The result is a market that functions well for incumbents and locks out entrants.
Housing market decoupling, the widening gap between deteriorating transaction volumes and a resilient broader economy, is most visible in the US, where new single-family home sales fell 17.6% in January 2026 yet homebuilder equities remained positive year-to-date, illustrating how financial markets can absorb housing weakness that registers as a severe affordability crisis for prospective buyers.
Federal Reserve distributional data shows the top 1% in the US own roughly one-third or more of total household wealth. Lower-income households are more exposed to rent and debt than to asset gains.
The Federal Reserve Distributional Financial Accounts track US household wealth by percentile group on a quarterly basis and show the top 1% of households holding roughly one-third or more of total household net worth, a share that has grown in step with equity and property price gains since 2008.
The harm extends beyond housing. Rising equity valuations mean younger, non-asset-owning households must pay more to acquire the same future financial security. Every percentage point of market gain raises the cost of entry for those not yet invested, widening the gap between asset owners and everyone else.
Reading asset prices as a distributional signal, not a welfare measure
The mainstream interpretation of high asset valuations is not wrong. It is incomplete. Strong corporate profits, expectations of productivity growth (particularly from artificial intelligence), and lower structural discount rates all contribute to elevated equity prices. These are real factors.
The mainstream signals:
- Corporate earnings growth supporting valuations
- Technology-led productivity expectations
- Lower structural discount rates
- Expanding market access through digital platforms
The distributional signals:
- Record equity highs alongside housing affordability collapse
- Gold rallies interpreted as distrust in fiat systems rather than pure optimism
- Market gains concentrated in a narrow set of mega-cap firms
- Homeownership rates declining among younger adults across multiple countries
The distributional critique does not reject the mainstream reading. It extends it. Concentrated wealth bids up scarce assets because high-net-worth households have more capacity to pursue returns in supply-constrained markets. IMF research confirms that rising house prices and financial asset inflation widen wealth gaps unless offset by progressive taxes or broader asset-ownership policies. ECB analysis adds that where housing supply is inelastic, monetary tightening adjustments fall on prospective buyers rather than incumbent owners.
The wealth concentration feedback loop compounds the problem: research published in The Review of Economic Studies documents that concentrated wealth drives asset demand, inflated prices widen inequality further, and the cycle repeats without a natural correction mechanism, raising financial crisis probability by an estimated 3-8 percentage points over historical baselines.
Asset inflation can therefore be a symptom of fracture rather than shared prosperity. When ordinary households cannot access housing or financial markets, rising prices reflect exclusion.
The structural argument: crises driven by distribution are solvable
There is a cautious source of optimism embedded in this analysis. If government redistribution during COVID and 2008 was sufficient to protect living standards, then real productive capacity did not collapse. Sufficient resources existed; they were merely distributed inequitably. Economic crises rooted in distribution do not require austerity acceptance or permanent decline as the only resolution. The problem is allocation, not scarcity, and allocation problems are, at least in principle, solvable.
The policy debate: taxing wealth rather than deferring it
If crisis responses consistently involve governments borrowing from wealthy creditors and spending the proceeds into the economy, the effect is self-reinforcing: public debt rises, wealth concentration deepens, and the next crisis requires the same mechanism again. Wealth taxation offers a functionally equivalent redistribution without the accumulating public debt.
The question is whether it works in practice. Several countries are testing that question now.
| Country | Current Status | Key Mechanism | Primary Contested Issue |
|---|---|---|---|
| Norway | Net wealth tax active | Annual tax on net assets above threshold | Capital flight; some high-net-worth relocations reported |
| Spain | Solidarity tax on large fortunes maintained | Targeted surtax on very high net worth | Regional tax competition within Spain |
| France | Broad wealth tax replaced by narrower real-estate wealth tax | Tax on real-estate holdings above threshold | Unrealised gains, inheritance loopholes |
| United States | No federal wealth tax enacted as of 2026 | Proposals include billionaire minimum tax on unrealised gains | Constitutional and administrative feasibility |
| EU member states | Ongoing legislative debates across several countries | Surtaxes on high asset holdings; inheritance and capital gains reform | Cross-border avoidance and valuation complexity |
The implementation objections are genuine. Valuation of illiquid assets (private businesses, art, property in thin markets) is difficult. Norway’s experience demonstrates that capital flight is a real risk, not merely a theoretical one. Avoidance through trust structures and offshore vehicles remains a persistent concern.
Current tax structures in many jurisdictions mean the wealthiest individuals frequently pay effective tax rates lower than those paid by their employees, creating the distributional inversion the policy debate aims to correct.
The debate’s centre of gravity has shifted. Whether wealth is concentrated is no longer contested among major institutional researchers. The contested question is whether wealth taxes are administratively feasible without triggering the avoidance behaviour that undermines them.
Investors exploring the specific legal and constitutional barriers that have blocked federal wealth-based tax proposals will find our full explainer on unrealised capital gains taxation, which covers the Moore v. United States ambiguity, active state-level ballot initiatives including California’s 2026 wealth tax proposal, and the key signals investors should monitor for near-term policy shifts.
What rising markets actually tell us, and what they do not
The analytical arc returns to the opening question. High asset valuations can coexist with deteriorating living standards precisely because they reflect and reinforce concentrated ownership. This is not a paradox. It is the mechanism working as described.
The structural conditions remain in place: concentrated wealth, crisis-driven deficit responses that channel cash upward, inelastic housing supply in the cities where economic opportunity concentrates. These conditions sustain upward asset price pressure even as that pressure excludes non-owners. The pattern has held across 70 years, with marked acceleration over the past 18-20 years, as asset price gains have repeatedly outpaced wage and productivity growth.
The Federal Reserve, ECB, IMF, and Bank of England all now formally acknowledge the regressive distributional effects of asset price inflation, making this a mainstream policy concern rather than a fringe claim.
Market performance data requires distributional disaggregation to be meaningful. An index high is not a welfare statement. It is a price signal, and the signal’s meaning depends entirely on who owns what.
The market-as-mirror: reframing asset prices as a distributional signal
High asset prices are most usefully read as evidence of wealth concentration, not evidence of widespread economic health. The policy path forward is genuinely contested, but the diagnosis is not. Every major institutional researcher now accepts that asset price inflation is distributionally regressive and that its benefits accrue overwhelmingly to those who already hold assets.
The question worth asking when reading any future market headline is straightforward: who owns the assets that are appreciating, and what does that mean for everyone else?
Readers seeking to build their own distributional framework can explore household wealth data from the Federal Reserve’s Distributional Financial Accounts, the World Inequality Database, and the IMF’s inequality research. Tracking housing price-to-income ratios alongside equity index performance offers a paired indicator of whether asset gains are inclusive or exclusive, a measure that headline index levels alone will never provide.
This article is for informational purposes only and should not be considered financial advice. Investors should conduct their own research and consult with financial professionals before making investment decisions.