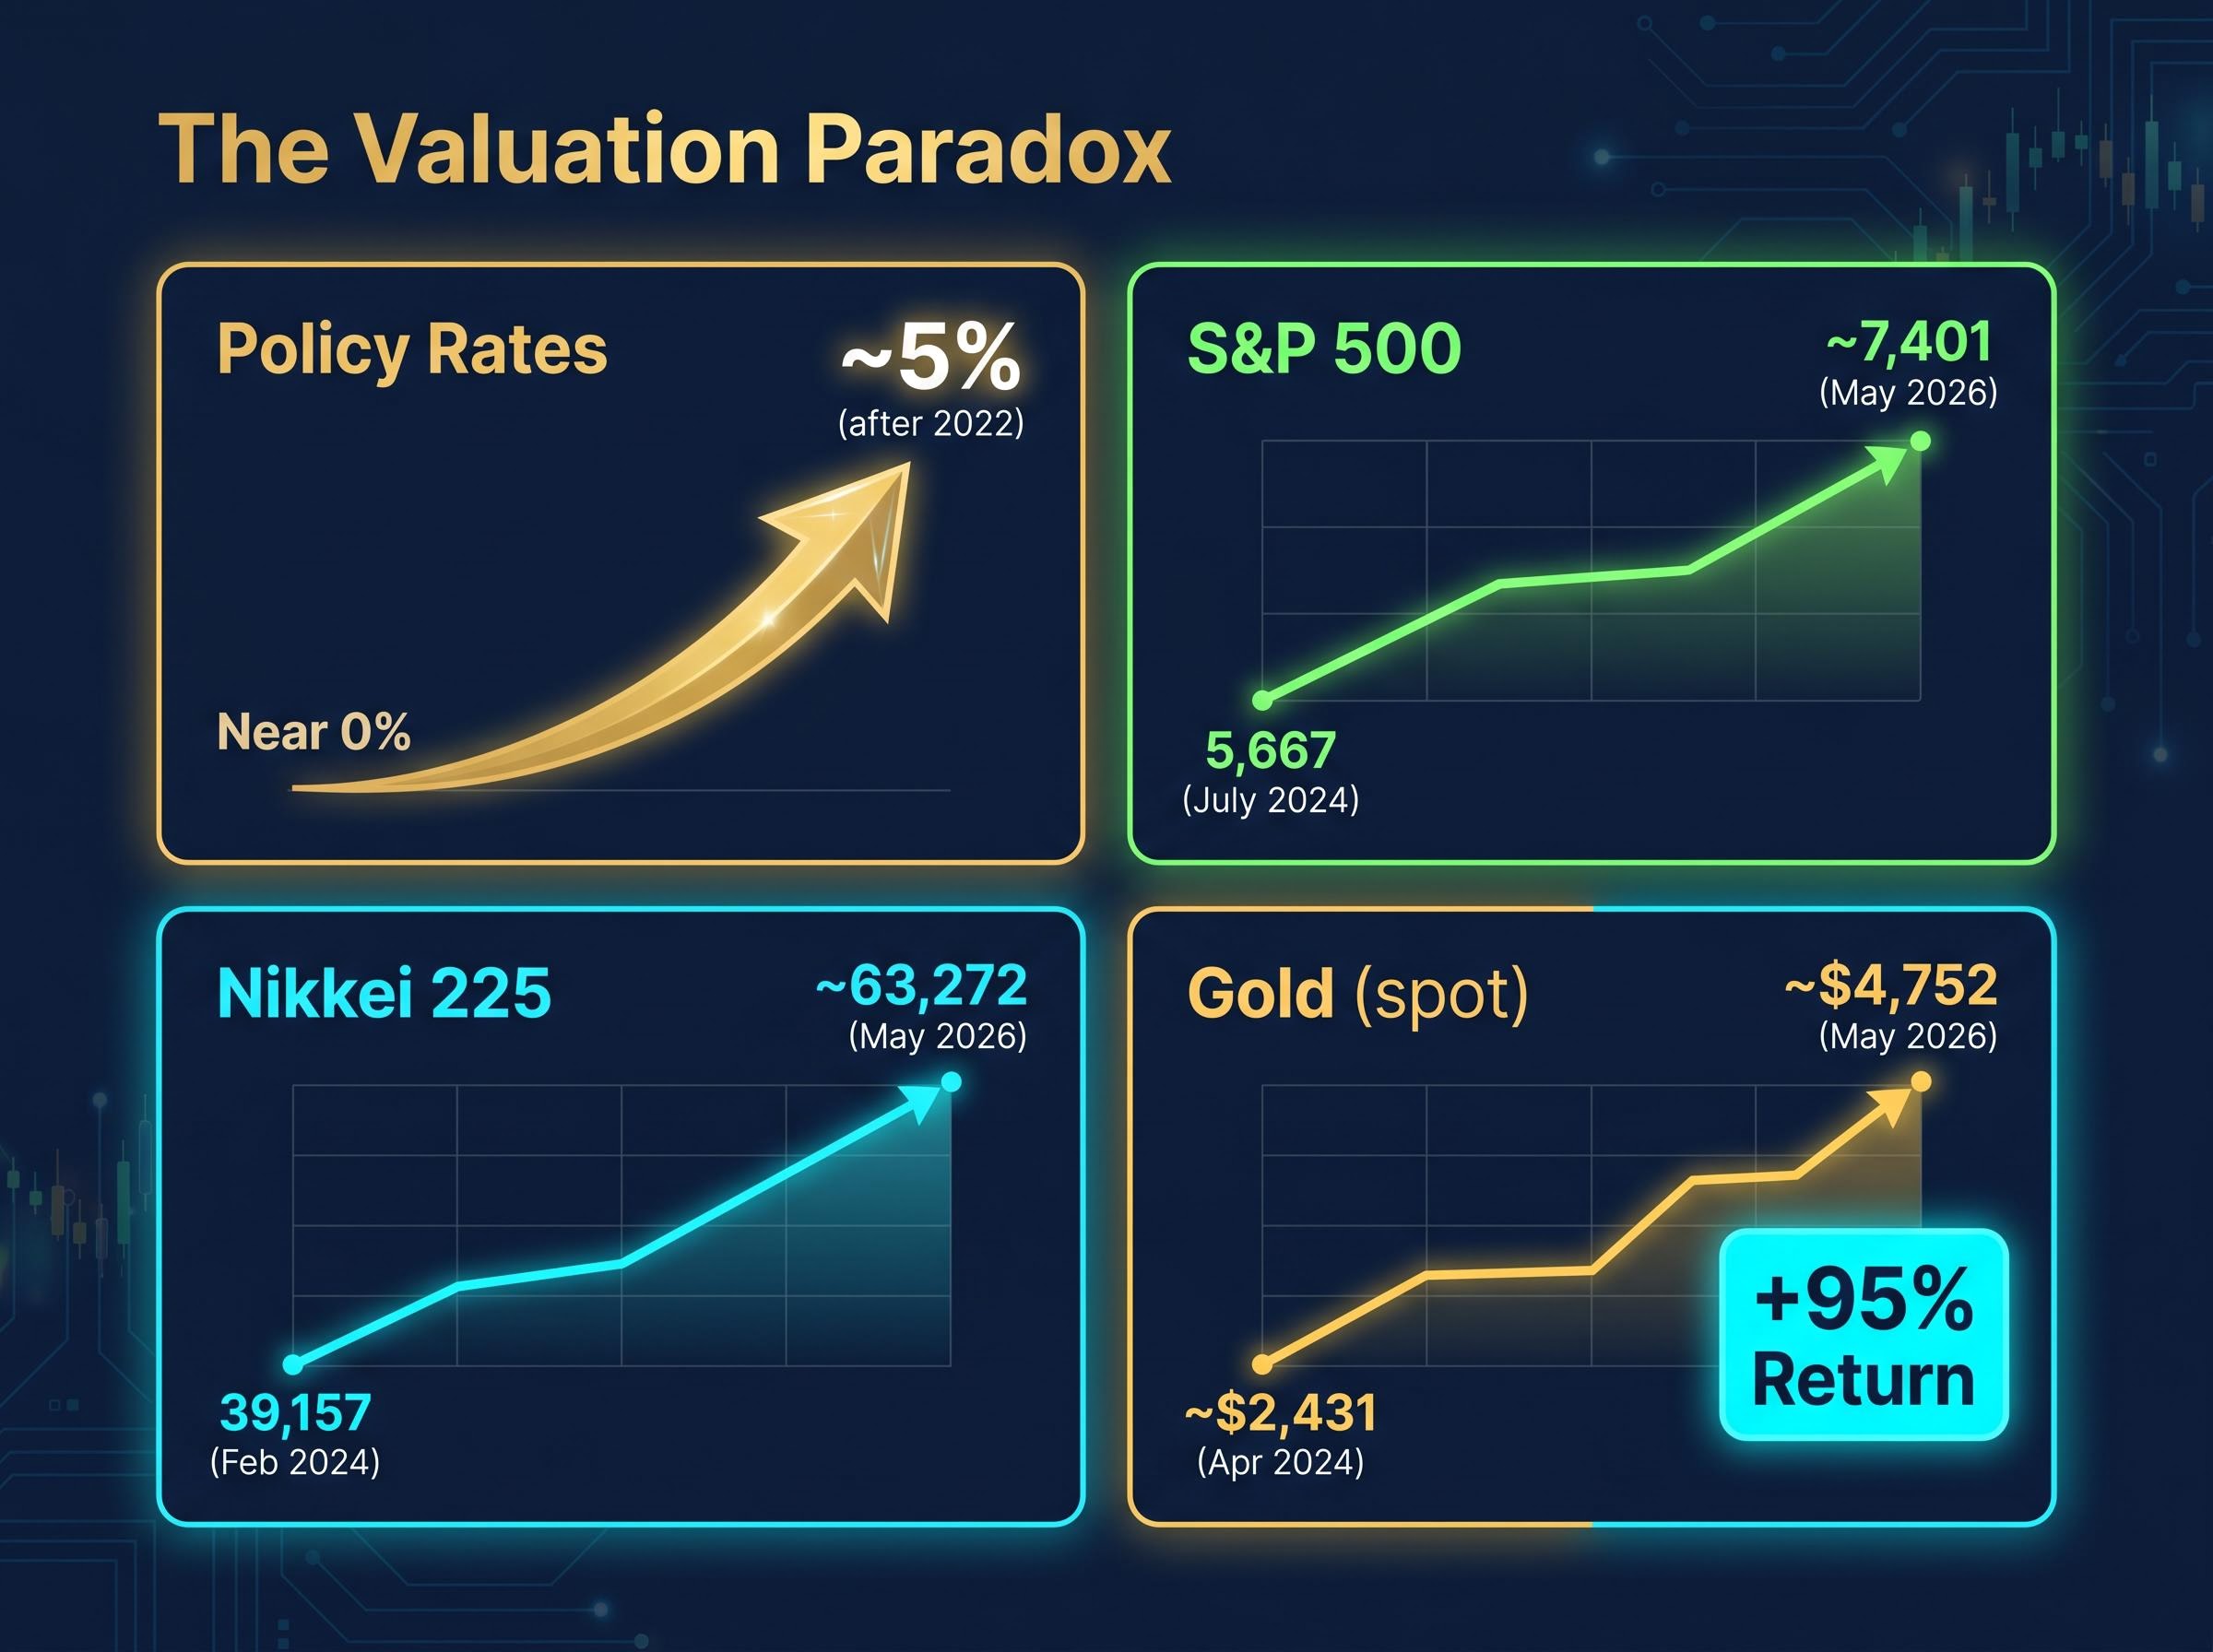
When the S&P 500 climbed from 5,667 in July 2024 to approximately 7,401 by May 2026, the Federal Reserve’s policy rate was sitting near a multi-decade high. Gold nearly doubled in two years. The Nikkei 225 buried its 35-year-old crash-era peak and then surged past it by 60%. If higher interest rates were supposed to suppress asset valuations, something has gone seriously wrong with the theory.
The idea that falling rates explain rising asset prices was a tidy narrative after 2008. It held for over a decade. But it shattered after COVID, when rates climbed aggressively and assets climbed with them. That breakdown demands a better explanation, and the search for one leads somewhere more structural, and more uncomfortable, than central bank policy settings alone.
This analysis identifies the mechanism that has driven asset price inflation through every major crisis since 2008, explains why the conventional rate-based framework was always incomplete, and draws out what this pattern means for investors and ordinary households navigating the current environment.
The numbers that broke the interest rate theory
A simple valuation framework illustrates what should have happened. A property yielding $50,000 annually is worth approximately $1 million when discounted at 5% and approximately $5 million at 1%. When Western central banks pushed policy rates from near zero to roughly 5% after 2022, asset prices should have compressed. They did the opposite.
| Asset | Approximate level (early-mid 2024) | Approximate level (May 2026) |
|---|---|---|
| S&P 500 | 5,667 (July 2024 closing high) | ~7,401 |
| Nikkei 225 | 39,157 (February 2024 breakout) | ~63,272 |
| Gold (spot) | ~$2,431/oz (April 2024) | ~$4,752/oz |
Gold’s two-year return from April 2024 to May 2026 stands at approximately +95%, one of the strongest sustained moves in the metal’s modern history, delivered entirely during a period of elevated real interest rates.
This is not a single-market anomaly. Equities in the United States, equities in Japan, and commodities denominated in US dollars all appreciated simultaneously while the cost of capital was rising. The pre-2008 narrative, that falling rates explained rising assets, cannot account for what happened after 2022. Something else was doing the work.
When big ASX news breaks, our subscribers know first
What asset price inflation actually is and why it keeps happening
Asset price inflation refers to the sustained increase in the nominal value of financial and real assets, including equities, property, and commodities. It is distinct from consumer price inflation in both its transmission channel and its distributional effect. Consumer prices rise when the cost of goods and services increases broadly. Asset prices rise when liquidity concentrates in markets where supply is constrained and ownership is concentrated.
Consumer price inflation operates through a fundamentally different transmission channel than asset price inflation: it erodes the purchasing power of wages and savings broadly, whereas asset price inflation concentrates gains among those who already hold financial and real assets, compounding the distributional divide with each crisis cycle.
The transmission channel
The mechanism follows a specific sequence, confirmed by post-COVID analysis from GIS Reports Online and supported by IMF Fiscal Monitor research:
- Governments run large fiscal deficits during crises, injecting cash into the economy. During COVID, this amounted to approximately $40,000 per adult in the United States and approximately $20,000 per adult (£20,000) in the United Kingdom.
- Central banks finance or facilitate this spending through quantitative easing and rate suppression, flooding the financial system with liquidity.
- Liquidity flows first through financial intermediaries into asset markets, raising equity, property, and commodity prices before wages or broader consumption adjust.
- Higher-income households, who hold the majority of financial assets, convert additional cash flows into further asset purchases, bidding valuations higher still.
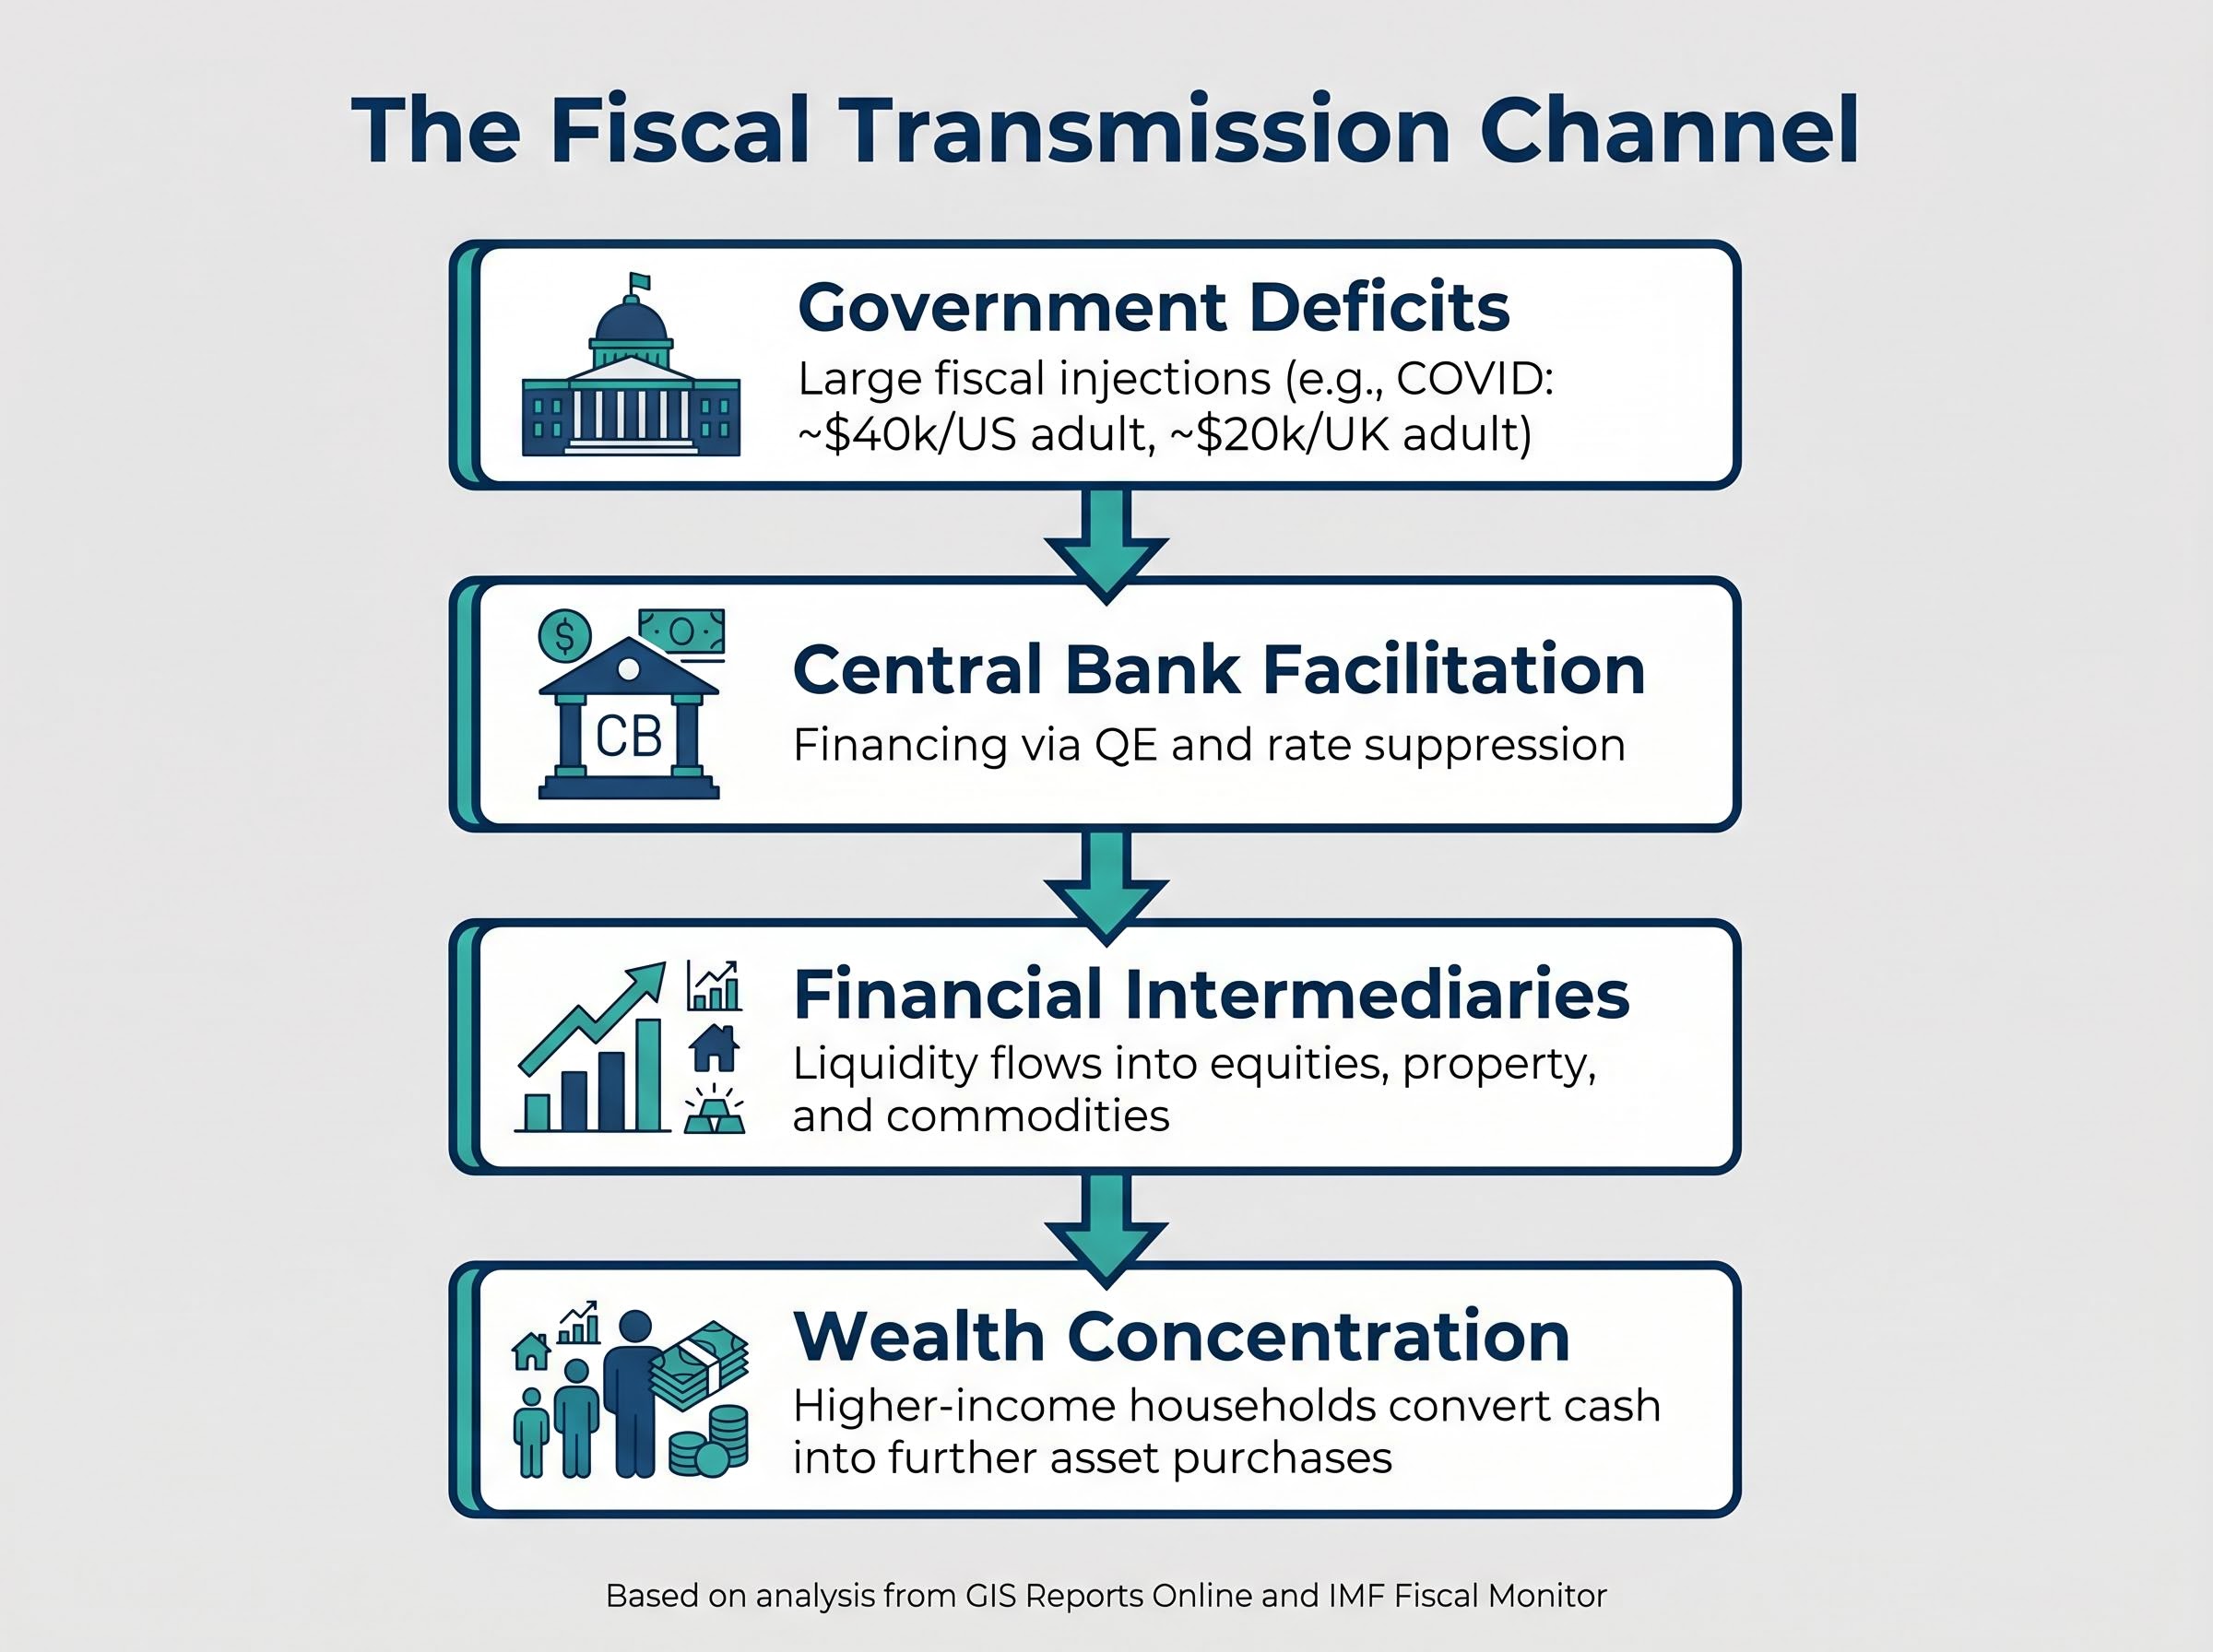
IMF Fiscal Monitor research documents that pandemic-era fiscal support boosted high-income savings and asset purchases disproportionately. The fiscal channel, not interest rates alone, is the structural driver. Deficit spending creates the cash flows; wealth concentration determines where they land.
Four crises, one outcome: the pattern across 2008 to 2026
The mechanism described above did not appear for the first time during COVID. It operated across four distinct crisis episodes, each with different surface characteristics and the same structural result.
| Crisis / Period | Policy response | Asset price outcome |
|---|---|---|
| 2008 Global Financial Crisis | Western base rates cut from ~4-5% to near zero; large-scale QE launched | Equities and housing recovered to pre-crisis highs within five years |
| 2011 European Sovereign Debt Crisis | ECB intervention, continued QE, fiscal backstops for periphery nations | European equities stabilised and appreciated through the decade |
| 2020-2021 COVID Pandemic | Rates returned to near zero; unprecedented fiscal spending ($40,000 per US adult) | S&P 500 doubled from March 2020 lows within two years; gold surged |
| 2022-2025 Rate-Hiking Cycle | US rates raised to ~5%; fiscal deficits remained elevated | S&P 500 reached new all-time highs in 2024 and again in 2026 |
The 2022-2025 episode is the most analytically significant. If interest rates were the dominant mechanism governing asset prices, this was the cycle that should have broken the pattern. Rates rose aggressively. Yet the S&P 500 set new records, the Nikkei surged past 63,000, and gold nearly doubled.
Japan provides the extreme illustration. General government gross debt sits at approximately 237% of GDP, the highest among major economies. Despite this, the Nikkei climbed to 63,272 by May 2026. San Francisco Federal Reserve research from Kevin J. Lansing’s April 2025 working paper confirms that current inflation is primarily demand-driven, sustained by accumulated fiscal-era savings. The fiscal channel persisted through every episode; the interest rate setting changed; the outcome did not.
Why deficits keep driving asset prices higher even when rates rise
The paradox resolves once the analysis shifts from monetary policy to fiscal flows. Fiscal deficits sustain aggregate demand even when central bank rates are restrictive. That is why the SF Fed’s research finds inflation remains demand-driven despite elevated policy rates: the demand has a fiscal source that rate increases do not directly reach.
The wealth concentration mechanism amplifies this. High-net-worth households receiving fiscal transfers or holding appreciating assets face no binding consumption constraint on marginal income. Additional cash flows are directed into equities, property, and commodities, bidding prices higher. This is not speculative excess; it is a structural outcome of who holds what.
The fiscal positions sustaining this dynamic remain firmly in place across major economies.
| Economy | Debt-to-GDP ratio (2026 estimate) |
|---|---|
| United States | ~122% |
| United Kingdom | ~93.8% |
| Euro Area | ~87.8% |
| Japan | ~237% |
According to William Blair’s 2025 analysis, accommodative financial conditions, ongoing fiscal stimulus, and a tight labour market are making it increasingly difficult for the Federal Reserve to restrain inflation. The monetary-fiscal conflict is structural, not temporary.
The FOMC institutional fracture visible in the May 2026 eight-to-four dissenting vote reflects exactly this tension: three committee members wanted rate hike signalling added to the statement while one wanted an immediate cut, a split that makes coherent forward guidance almost impossible when the fiscal source of demand is outside the Fed’s direct reach.
The IMF projects global inflation at 4.1% in 2025 and 3.8% in 2026, above 2% central bank targets in both years. As long as fiscal deficits remain large enough to sustain aggregate demand above what monetary policy can suppress, the conditions for continued asset price appreciation remain embedded in the system.
Who benefits and who bears the cost
The transmission sequence described earlier, where liquidity flows into asset markets before reaching wages, is not a neutral economic event. It produces a specific set of winners and a specific set of losers, and their identities follow directly from the mechanism.
Asset owners:
- Equity holders see portfolio valuations rise with each round of fiscal-era liquidity
- Property owners benefit from housing price appreciation that compounds over crisis cycles
- Commodity investors, particularly those holding gold, benefit from real asset demand in a higher-inflation regime
- AllianceBernstein’s 2024 analysis explicitly recommends increased allocation to real assets, positioning inflation as a structural tailwind for this group
Wage earners and non-asset holders:
- Above-target consumer price inflation erodes real wages and the purchasing power of savings
- Rising property prices push housing costs beyond reach for first-time buyers
- Fixed nominal claims, including savings deposits and nominal bonds, lose value in real terms
- According to Morgan Stanley, labour market constraints, housing shortages, and energy bottlenecks are structural forces that monetary policy alone cannot resolve
According to GIS Reports Online: “By the time this money reaches the broader population, prices have risen so much that ordinary citizens not only fail to benefit but often struggle to meet housing costs. This further widens the inequality gap and perpetuates the socioeconomic divide.”
The distributional logic is self-reinforcing. Each crisis response channels liquidity toward those who already hold assets, widening the gap between asset-owner net worth and median real wages. Owning real assets in this environment is not incidentally profitable; it is structurally advantaged by the mechanism itself.
The relationship between wealth concentration and record equity returns goes beyond a correlation: the top 1% US household wealth share reached approximately 34.9% in Q4 2025, up from 30.4% in 2020, with the top 10% capturing roughly 88% of total wealth growth over the same period, figures that reflect the structural feedback loop documented in The Review of Economic Studies rather than cyclical market exuberance.
A pattern investors cannot afford to ignore in 2026
The mechanism is now four crises old, and it follows a consistent sequence: fiscal deficits create cash flows that concentrate in asset markets because high-net-worth households face no consumption constraint on marginal income. The interest rate setting changes; the fiscal channel persists; valuations rise.
Institutional positioning for 2026 reflects this structural reality. JP Morgan, Goldman Sachs, Morgan Stanley, Mercer, and AllianceBernstein do not project a secular equity collapse. AllianceBernstein explicitly recommends real asset overweights. Goldman Sachs expects US growth of 2.3% and core inflation ending the year at 2.5%, conditions consistent with continued nominal asset appreciation.
An honest caveat is warranted. High volatility in current markets means short-term reversals remain possible. The structural upward bias does not eliminate drawdown risk. This pattern plays out over crisis cycles, not quarter by quarter.
Three conditions will determine whether the pattern extends:
- Fiscal deficit trajectory: Whether major governments sustain, expand, or meaningfully reduce deficit spending
- Real rate versus nominal growth differential: Whether real rates exceed nominal growth rates long enough to compress valuations
- Wealth concentration of new stimulus flows: Whether future fiscal responses repeat the distributional pattern of COVID-era transfers
As long as major governments continue to respond to economic disruptions with large fiscal deficits, the structural conditions for asset price inflation remain in place, regardless of where nominal policy rates sit.
For investors wanting to translate the structural pattern described above into specific portfolio positioning, our dedicated guide to inflation-era tactical allocation covers Treasury Inflation-Protected Securities, REITs, physical gold, and systematic diversification approaches, with a framework for maintaining liquid reserves to capitalise on the drawdowns that the structural upward bias does not eliminate.
This article is for informational purposes only and should not be considered financial advice. Investors should conduct their own research and consult with financial professionals before making investment decisions. Past performance does not guarantee future results. Financial projections are subject to market conditions and various risk factors.