How to Value WHSP Using Dividend Yield and Franking Credits
2 hrs ago

At a share price of roughly $37.44 on 8 May 2026, Westpac is either fairly valued, modestly cheap, or significantly undervalued, and the answer depends entirely on one input: whether the model accounts for franking credits. That single variable can shift a Dividend Discount Model fair value estimate by more than $10 per share.
With Westpac’s 2026 interim dividend of $0.77 per share confirmed fully franked, and the RBA cash rate sitting at 4.35%, income-focused ASX investors have a live, timely data set to work with. The Dividend Discount Model is one of the oldest and most intuitive frameworks for valuing dividend-paying stocks, and Westpac is an almost ideal candidate for applying it. This guide walks through exactly how the model works, applies it step by step to Westpac’s current numbers, shows what happens across a range of assumptions, and explains why Australian investors must think about franking credits differently from investors elsewhere.
Most investors who buy Westpac already think about dividends as income. The Dividend Discount Model simply formalises a question they are already asking: how much would you pay today for a reliable stream of future income?
The model values a share based on the present value of all expected future dividends, discounted back at the investor’s required rate of return. If the present value of that income stream exceeds the current share price, the stock is cheap. If it falls below, the stock is expensive. The logic is intuitive, but the output depends heavily on the assumptions fed into it.
The Gordon Growth Model, the single-stage version most retail investors use, compresses this into a formula:
The dividend discount model origins trace back to John Burr Williams in 1938, who formalised the idea that a stock’s intrinsic value is simply the sum of its future income discounted to the present, a response to the speculative excesses of the 1920s that remains in active use in institutional equity research today.
Gordon Growth Model Share price = D1 / (r – g)
D1 = next year’s expected dividend per share r = required rate of return g = constant dividend growth rate
Banks make strong candidates for this model for three specific reasons:
Understanding why a particular stock suits a particular model matters. Applying a DDM to a high-growth technology company with no dividends produces nonsense. Applying it to Westpac is grounded in the bank’s actual business structure.
The verified annual dividend total for Westpac is $1.54 per share, comprising the December 2025 payment of $0.77 and the June 2026 interim of $0.77. Some older sources cite $1.66, which reflects a prior period and should not be used in current models.
| Payment Date | Amount (per share) | Franking Status |
|---|---|---|
| 26 June 2026 | $0.77 | 100% franked (30%) |
| 19 December 2025 | $0.77 | 100% franked (30%) |
| 27 June 2025 | $0.76 | 100% franked (30%) |
The DDM requires the next year’s expected dividend (D1), not the most recent payment. Because Westpac’s dividend has been growing modestly (from $0.76 to $0.77 per semi-annual payment), applying a conservative growth adjustment to the $1.54 base produces a D1 of approximately $1.55-$1.57.
The five-year dividend growth rate sits at 14.80% according to GuruFocus, but this figure is historically elevated and reflects a recovery from pandemic-era cuts. For a terminal DDM input, a conservative long-run growth assumption of 2%-3% is more appropriate.
The required rate of return (r) anchors to the RBA cash rate of 4.35%. Most retail DDM models for Westpac apply a required return of 6% to 11%, implying an equity risk premium of 1.65% to 6.65% above the cash rate.
The RBA cash rate target decision of May 2026 confirmed the rate at 4.35%, the figure that anchors the equity risk premium calculations used throughout this analysis and determines the lower bound of any reasonable required return input for an ASX major bank.
The reader now holds three inputs:
Using the wrong dividend figure, even by a small margin, compounds meaningfully across scenarios. Knowing exactly which number to use is the difference between a model that informs a decision and one that misleads it.
The Gordon Growth Model produces a single fair value estimate for each combination of r and g. But no single combination is “correct.” The model is most useful as a sensitivity tool, revealing the conditions under which the stock is cheap or expensive rather than delivering one answer.
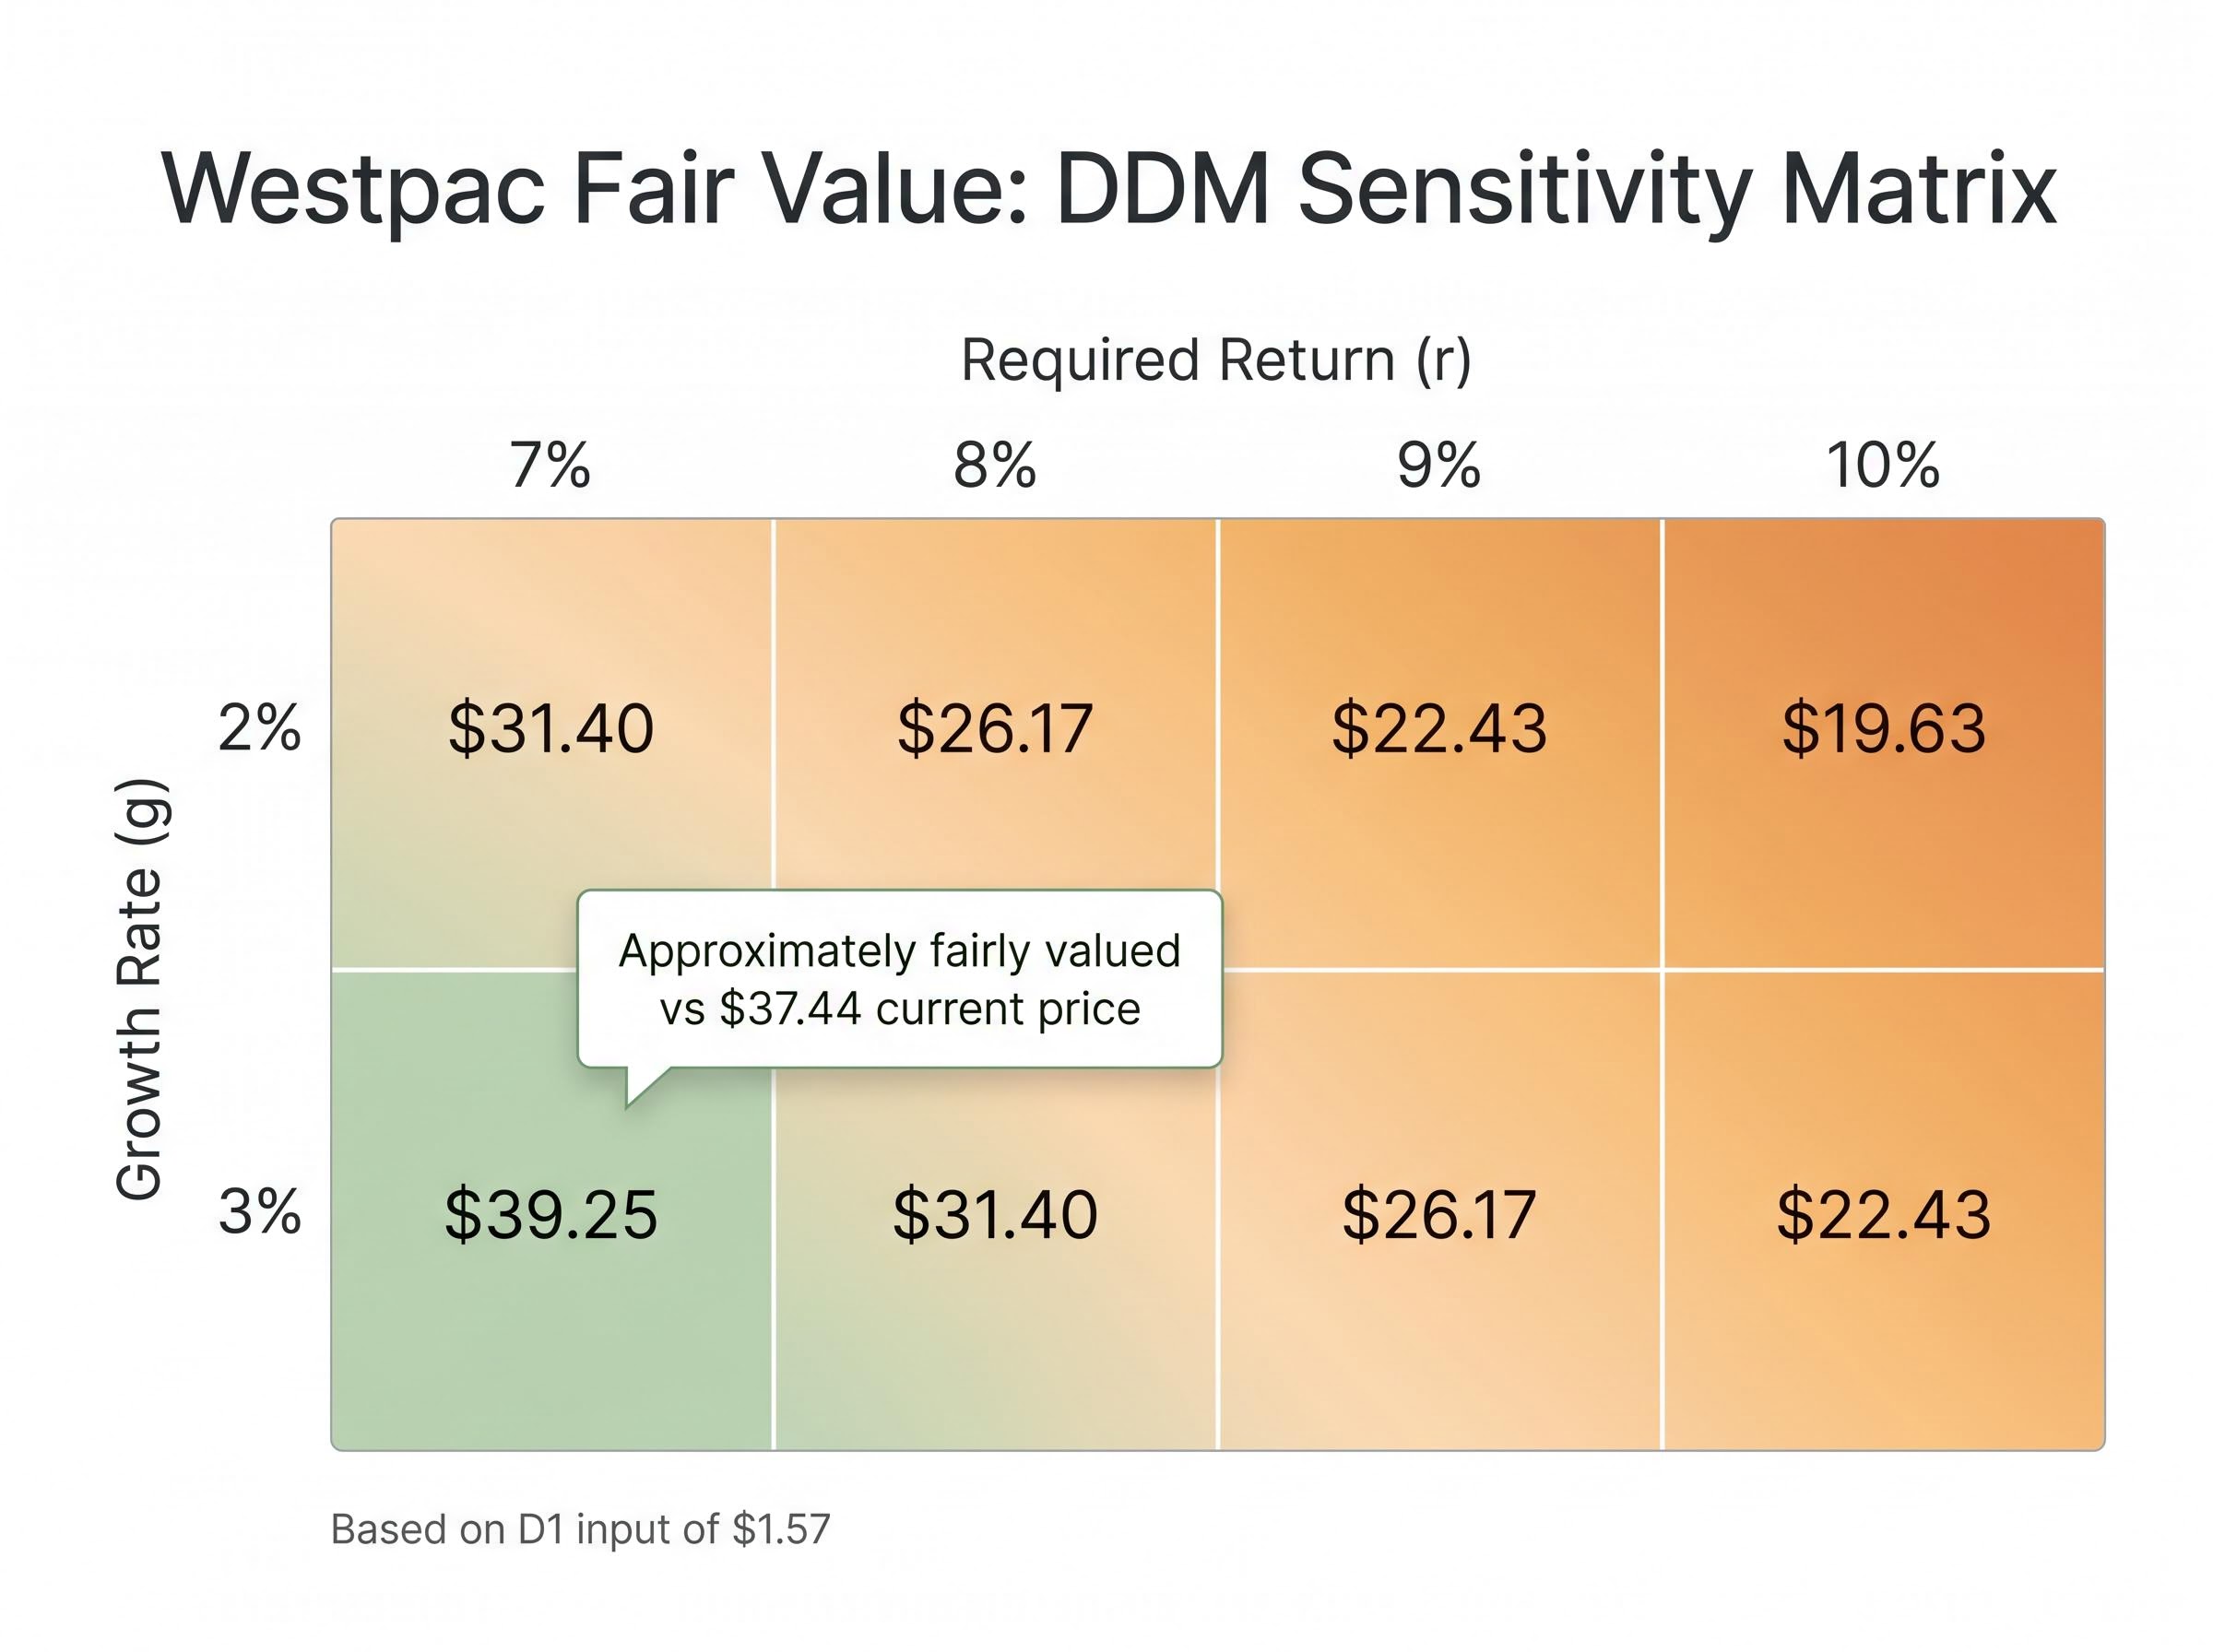
Using D1 of $1.57, the following matrix shows fair value estimates across a practical range of required returns and growth rates:
| Growth Rate (g) | r = 7% | r = 8% | r = 9% | r = 10% |
|---|---|---|---|---|
| 2% | $31.40 | $26.17 | $22.43 | $19.63 |
| 3% | $39.25 | $31.40 | $26.17 | $22.43 |
At the current price of $37.44, the fair value estimate is reached only in the lower-r, higher-g corner of the matrix: r = 7% and g = 3% produces $39.25, suggesting the stock is approximately fairly valued. Every other combination places fair value below the current price, with higher required returns pushing estimates well under $30.
“At r = 7% and g = 3%, the DDM implies Westpac is fairly valued at current prices. At r = 9% and g = 2%, it suggests the market is pricing in more optimism than the cash-only model can justify.”
For reference, Rask Media’s blended DDM scenario average came to $35.10 using the older $1.66 input. Updated inputs produce modestly lower cash-only estimates. A PE-based estimate from the same source of $37.73 (using EPS of $1.92 multiplied by sector PE) cross-checks the DDM output as broadly consistent with fair value on an earnings basis.
The scenario matrix removes the illusion of precision. Seeing the full range helps investors decide whether their personal required return assumptions support buying, holding, or passing on Westpac at current prices.
The cash-only DDM just placed Westpac somewhere between modestly overvalued and fairly valued. For Australian investors in lower tax brackets, that picture is incomplete, because it ignores the franking credit system entirely.
Here is how franking works in plain terms: Westpac has already paid 30% corporate tax on its earnings before distributing dividends. The franking credit passes that tax payment through to the shareholder, who can offset it against their personal income tax liability. If the shareholder’s marginal tax rate is below 30%, the excess credit is refunded as cash.
The ATO franking credit refund rules for individuals confirm that where a shareholder’s marginal tax rate falls below the 30% corporate rate, the excess credit is paid as a cash refund, making the grossed-up DDM input a direct representation of after-tax income rather than a theoretical adjustment.
The gross-up calculation takes three steps:
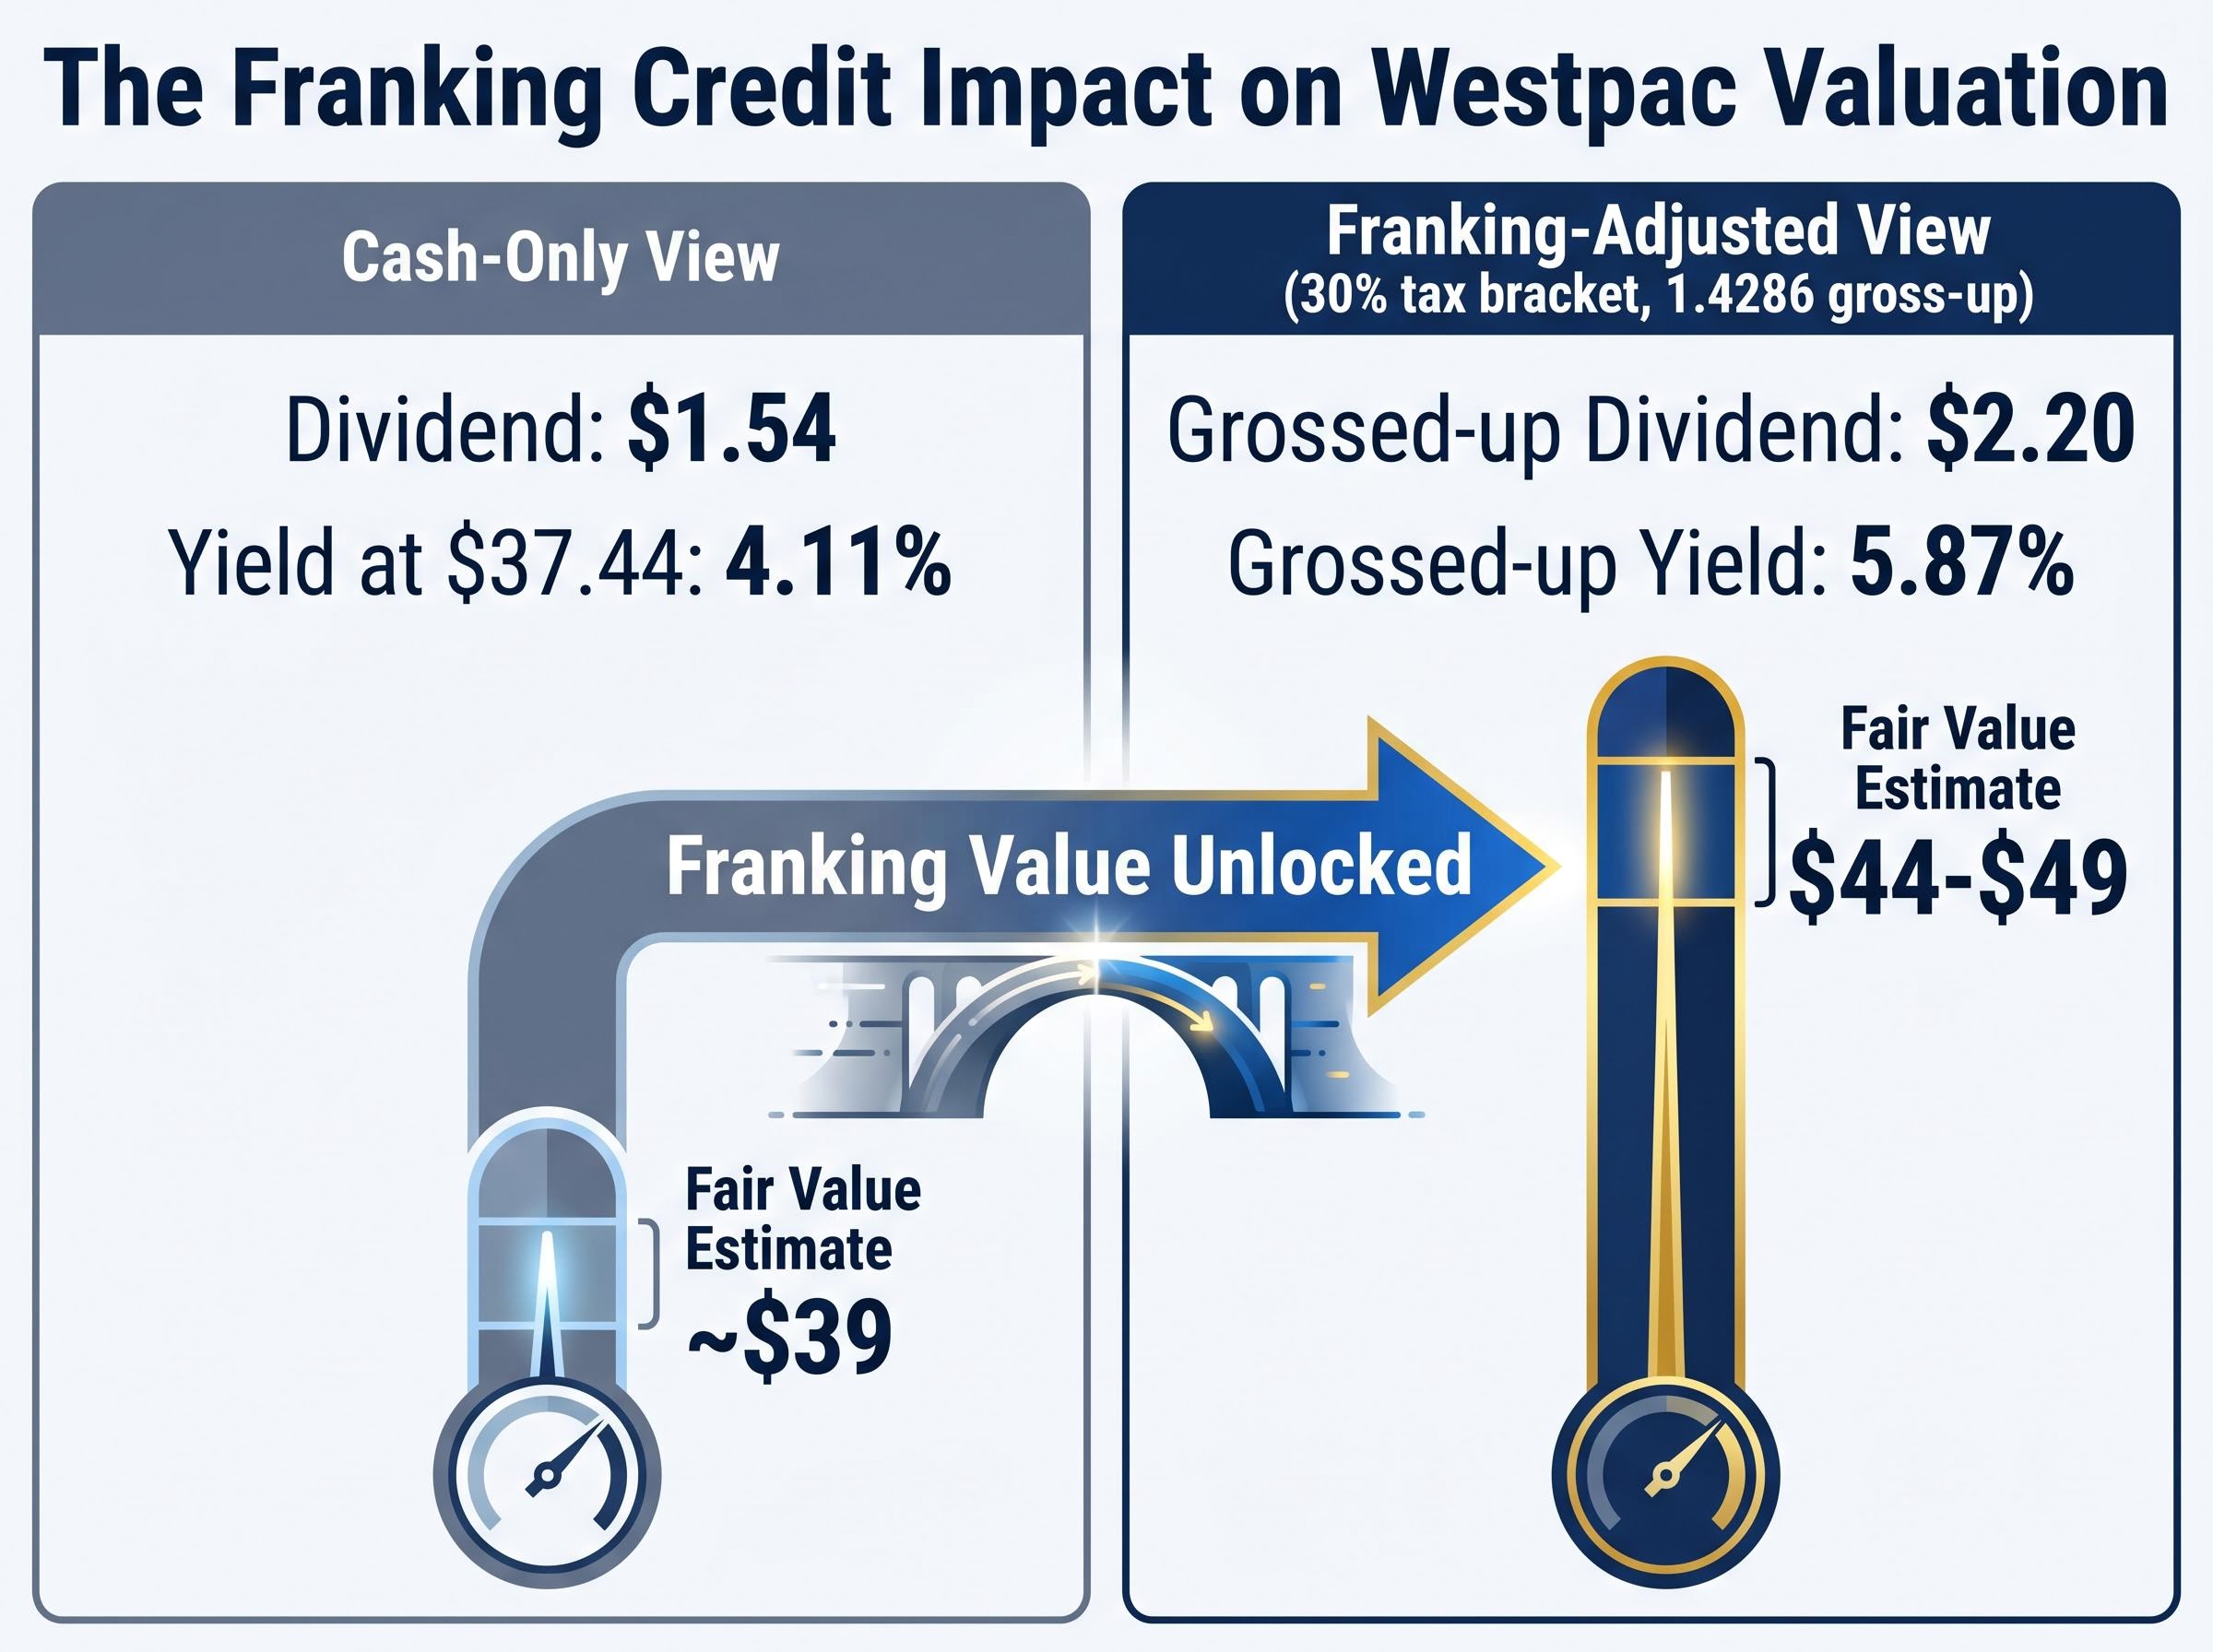
When the grossed-up dividend is used as the DDM input, fair value estimates shift substantially higher. The Rask Media gross-franked DDM output came to approximately $48.64 (using a $2.30 gross-up on an adjusted $1.61 input). With updated $1.54 inputs, the fair value range sits at approximately $44-$49 when franking is fully incorporated.
Yield comparison: Cash dividend yield at $37.44: approximately 4.11%. Grossed-up yield: approximately 5.87%. This gap widens the lower the investor’s marginal tax rate.
The difference between these two yields is not a cosmetic adjustment. It is a structural feature of the Australian tax system that materially changes the valuation case for fully franked stocks.
Not all investors capture the full benefit. Individual investors with marginal tax rates below 30% receive a net tax benefit, as the excess franking credit is refunded. Investors above 30% receive a partial offset, reducing but not eliminating their tax on the dividend. Self-managed super funds (SMSFs) in retirement phase can receive the full franking credit as a cash refund, making the grossed-up DDM especially relevant for this group.
The DDM’s greatest strength is also its core limitation: the output is acutely sensitive to the spread between r and g. A one-percentage-point change in either variable moves the fair value estimate by a large margin. The model amplifies input error rather than correcting for it.
Four specific limitations apply:
Macro assumptions in bank valuations can produce a spread from roughly $19 to above $85 per share for the same underlying stock, a range that reflects different views on RBA rate direction, employment, and property rather than any arithmetic error in the model itself.
No valuation model should be used in isolation. The Rask Media PE-based estimate of $37.73 and GuruFocus’s GF Value of $51.62 (which uses a broader set of intrinsic value inputs) both serve as cross-checks. GuruFocus’s GF Score of 49/100 is a business quality signal that exists independently of valuation: a stock can appear fairly valued while still carrying quality concerns.
NIM (1.92% as of March 2026) answers “is the income stream under pressure?” Westpac’s net interest margin remains stable but is not expanding, suggesting dividend sustainability without meaningful growth.
CET1 (12.4%) answers “is the dividend sustainable?” This ratio sits well above APRA minimums, supporting continued fully franked payments.
ROE (9.7%) answers “is the bank efficient?” Westpac’s return on equity sits above the sector average of 9.35%, indicating consistent shareholder value generation.
PE cross-check ($37.73) answers “does the market agree with the DDM?” The PE-based estimate aligns closely with the current share price, reinforcing that the market is pricing Westpac near fair value on an earnings basis.
The cash-only DDM produces a clear range. At conservative assumptions (r = 8%-9%, g = 2%), Westpac appears modestly overvalued on a cash dividend basis at $37.44. At more optimistic assumptions (r = 7%, g = 3%), it is approximately fairly valued.
The franking-adjusted picture is materially different. Incorporating the grossed-up dividend expands the fair value estimate toward the $44-$49 range, suggesting meaningful undervaluation for investors who fully benefit from franking credits.
| Valuation Method | Fair Value Estimate | Implication at $37.44 |
|---|---|---|
| Cash DDM (conservative: r=8%, g=2%) | $26-$31 | Appears overvalued |
| Cash DDM (optimistic: r=7%, g=3%) | ~$39 | Approximately fair value |
| Franking-adjusted DDM | $44-$49 | Appears undervalued |
| PE cross-check (Rask Media) | $37.73 | Broadly fair value |
| GF Value (GuruFocus) | $51.62 | Suggests moderate upside |
The distinction is what the model makes visible. Income investors who can access franking credits in full have a materially different valuation case than those who cannot. That gap is not a flaw in the model; it reflects a real difference in total return.
“The DDM is not a price target machine. It is a framework for understanding what assumptions about growth and risk are baked into the price you are being asked to pay today.”
This article is for informational purposes only and should not be considered financial advice. Investors should conduct their own research and consult with financial professionals before making investment decisions. Past performance does not guarantee future results. Financial projections are subject to market conditions and various risk factors.
The DDM methodology outlined here applies beyond Westpac to any dividend-paying ASX bank or blue-chip stock, giving readers a transferable valuation skill. The “right” fair value answer is investor-specific: it depends on each individual’s required return, tax position, and time horizon.
DDM application across ASX sectors beyond banking, including listed infrastructure and consumer staples, follows the same Gordon Growth Model structure but uses sector-specific growth anchors, with global listed infrastructure dividends forecast to grow at 5-6% per annum providing a concrete reference point for the g input that differs substantially from Westpac’s conservative 2%-3% terminal assumption.
Running the model once is useful. Running it again when dividend payments are updated is where compounding insight begins. Westpac’s next semi-annual announcement is expected in December 2026, and each new data point either confirms or challenges the assumptions underpinning the current estimate. The framework stays the same; the inputs evolve.
The Dividend Discount Model values a share based on the present value of all expected future dividends, discounted at the investor's required rate of return. The Gordon Growth Model version compresses this into a single formula: share price equals next year's expected dividend divided by the difference between the required return and the constant growth rate.
Franking credits represent corporate tax already paid by the company, which passes through to shareholders as an offset against their personal tax liability. For Westpac, grossing up the $1.54 annual dividend by 1.4286 produces an effective input of approximately $2.20, shifting the DDM fair value estimate from roughly $39 up to the $44-$49 range for investors who fully benefit from the credit.
The verified current annual dividend is $1.54 per share, comprising two $0.77 semi-annual payments both 100% franked at the 30% corporate tax rate. Applying a conservative growth adjustment produces a D1 estimate of approximately $1.55-$1.57 for modelling purposes, with a long-run terminal growth rate of 2%-3% considered appropriate.
Most retail DDM models for Westpac apply a required return of 6% to 11%, implying an equity risk premium of 1.65% to 6.65% above the RBA cash rate of 4.35%. A practical modelling range of 7%-10% is recommended, with the choice reflecting your personal risk tolerance and income expectations.
The DDM is highly sensitive to the spread between the required return and the growth rate, meaning small input changes produce large swings in fair value output. It also excludes balance sheet risk, loan book quality, and earnings stability, so it should always be cross-checked against other metrics such as the PE ratio, CET1 ratio, and net interest margin.