How to Position for the Most Event-Dense Week of July 2026
6 hrs ago

April’s Consumer Price Index arrived at double the consensus monthly estimate on Tuesday, 12 May 2026, printing the hottest headline inflation reading in three years and instantly vaporising expectations of a Federal Reserve rate cut this year. The Bureau of Labor Statistics reported all-items monthly inflation at +0.6% against a +0.3% consensus forecast, while the annual rate accelerated to +3.8%, the highest since May 2023. Even stripping out volatile food and energy components, core CPI came in above expectations at +0.4% monthly and +2.8% annually, confirming the upside surprise was not confined to a single category. What follows breaks down the forces behind the miss, from energy and shelter to core services; how Fed rate expectations have shifted; which equity sectors absorbed the repricing; and what Wall Street’s revised outlook means for investors holding rate-sensitive assets.
The scale of the miss was not subtle. All-items CPI rose +0.6% for the month, doubling the +0.3% Bloomberg consensus, while the 12-month rate jumped to +3.8% against an expected +3.4%. Core CPI, which excludes food and energy, printed at +0.4% monthly and +2.8% annually, both above forecasts and up from +2.6% in March.
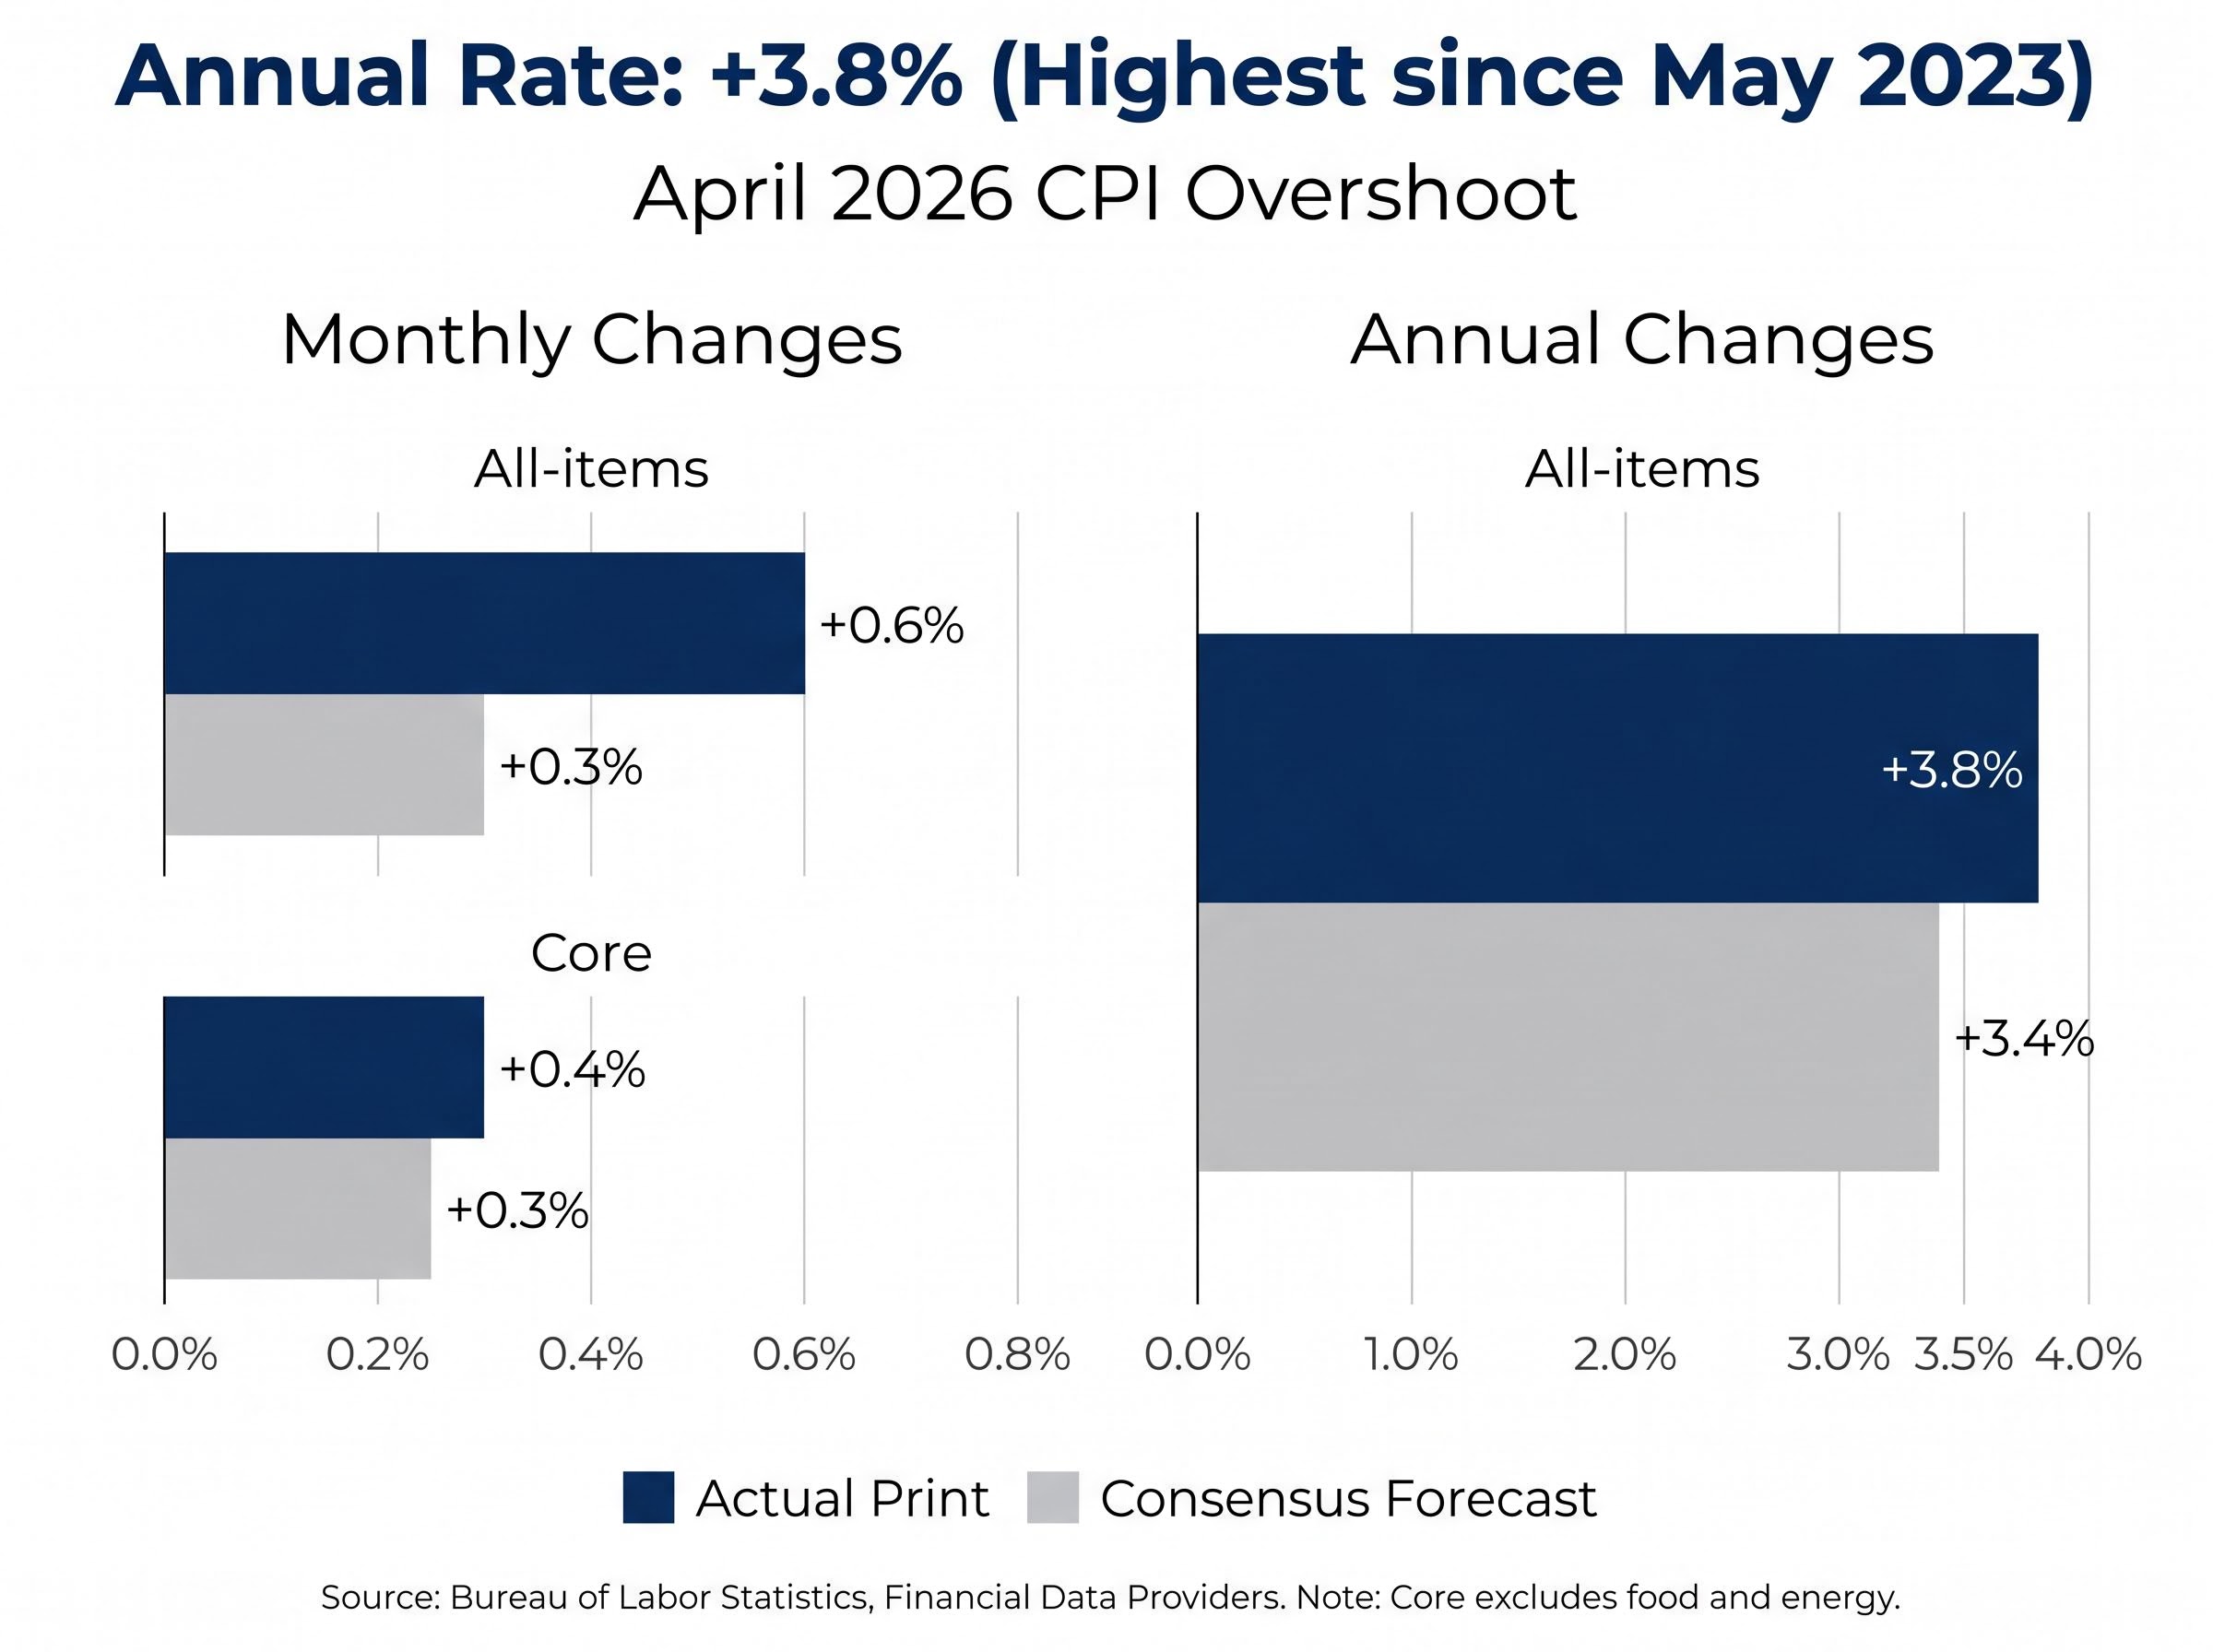
3.8% year-on-year, the highest reading since May 2023.
The breadth of the overshoot is what distinguishes this release. Energy surged +3.8% on the month, with energy commodities up +5.6% and gasoline alone rising +5.4%. Food added +0.5%. Shelter contributed +0.6%. Each category independently pushed the print higher.
| Category | Monthly Change | Consensus | Annual Change |
|---|---|---|---|
| All items | +0.6% | +0.3% | +3.8% |
| Core CPI | +0.4% | +0.3% | +2.8% |
| Energy | +3.8% | — | +17.9% |
| Shelter | +0.6% | — | +3.3% |
| Food | +0.5% | — | +3.2% |
That core beat, even after removing the energy shock, confirms this was not a single-category anomaly. The inflation surprise was broad-based.
Two narratives compete inside this data release, and they point in different directions:
Core goods were approximately flat, and new vehicle prices declined slightly. The goods disinflation that provided relief through 2023-2024 is no longer offering a meaningful offset.
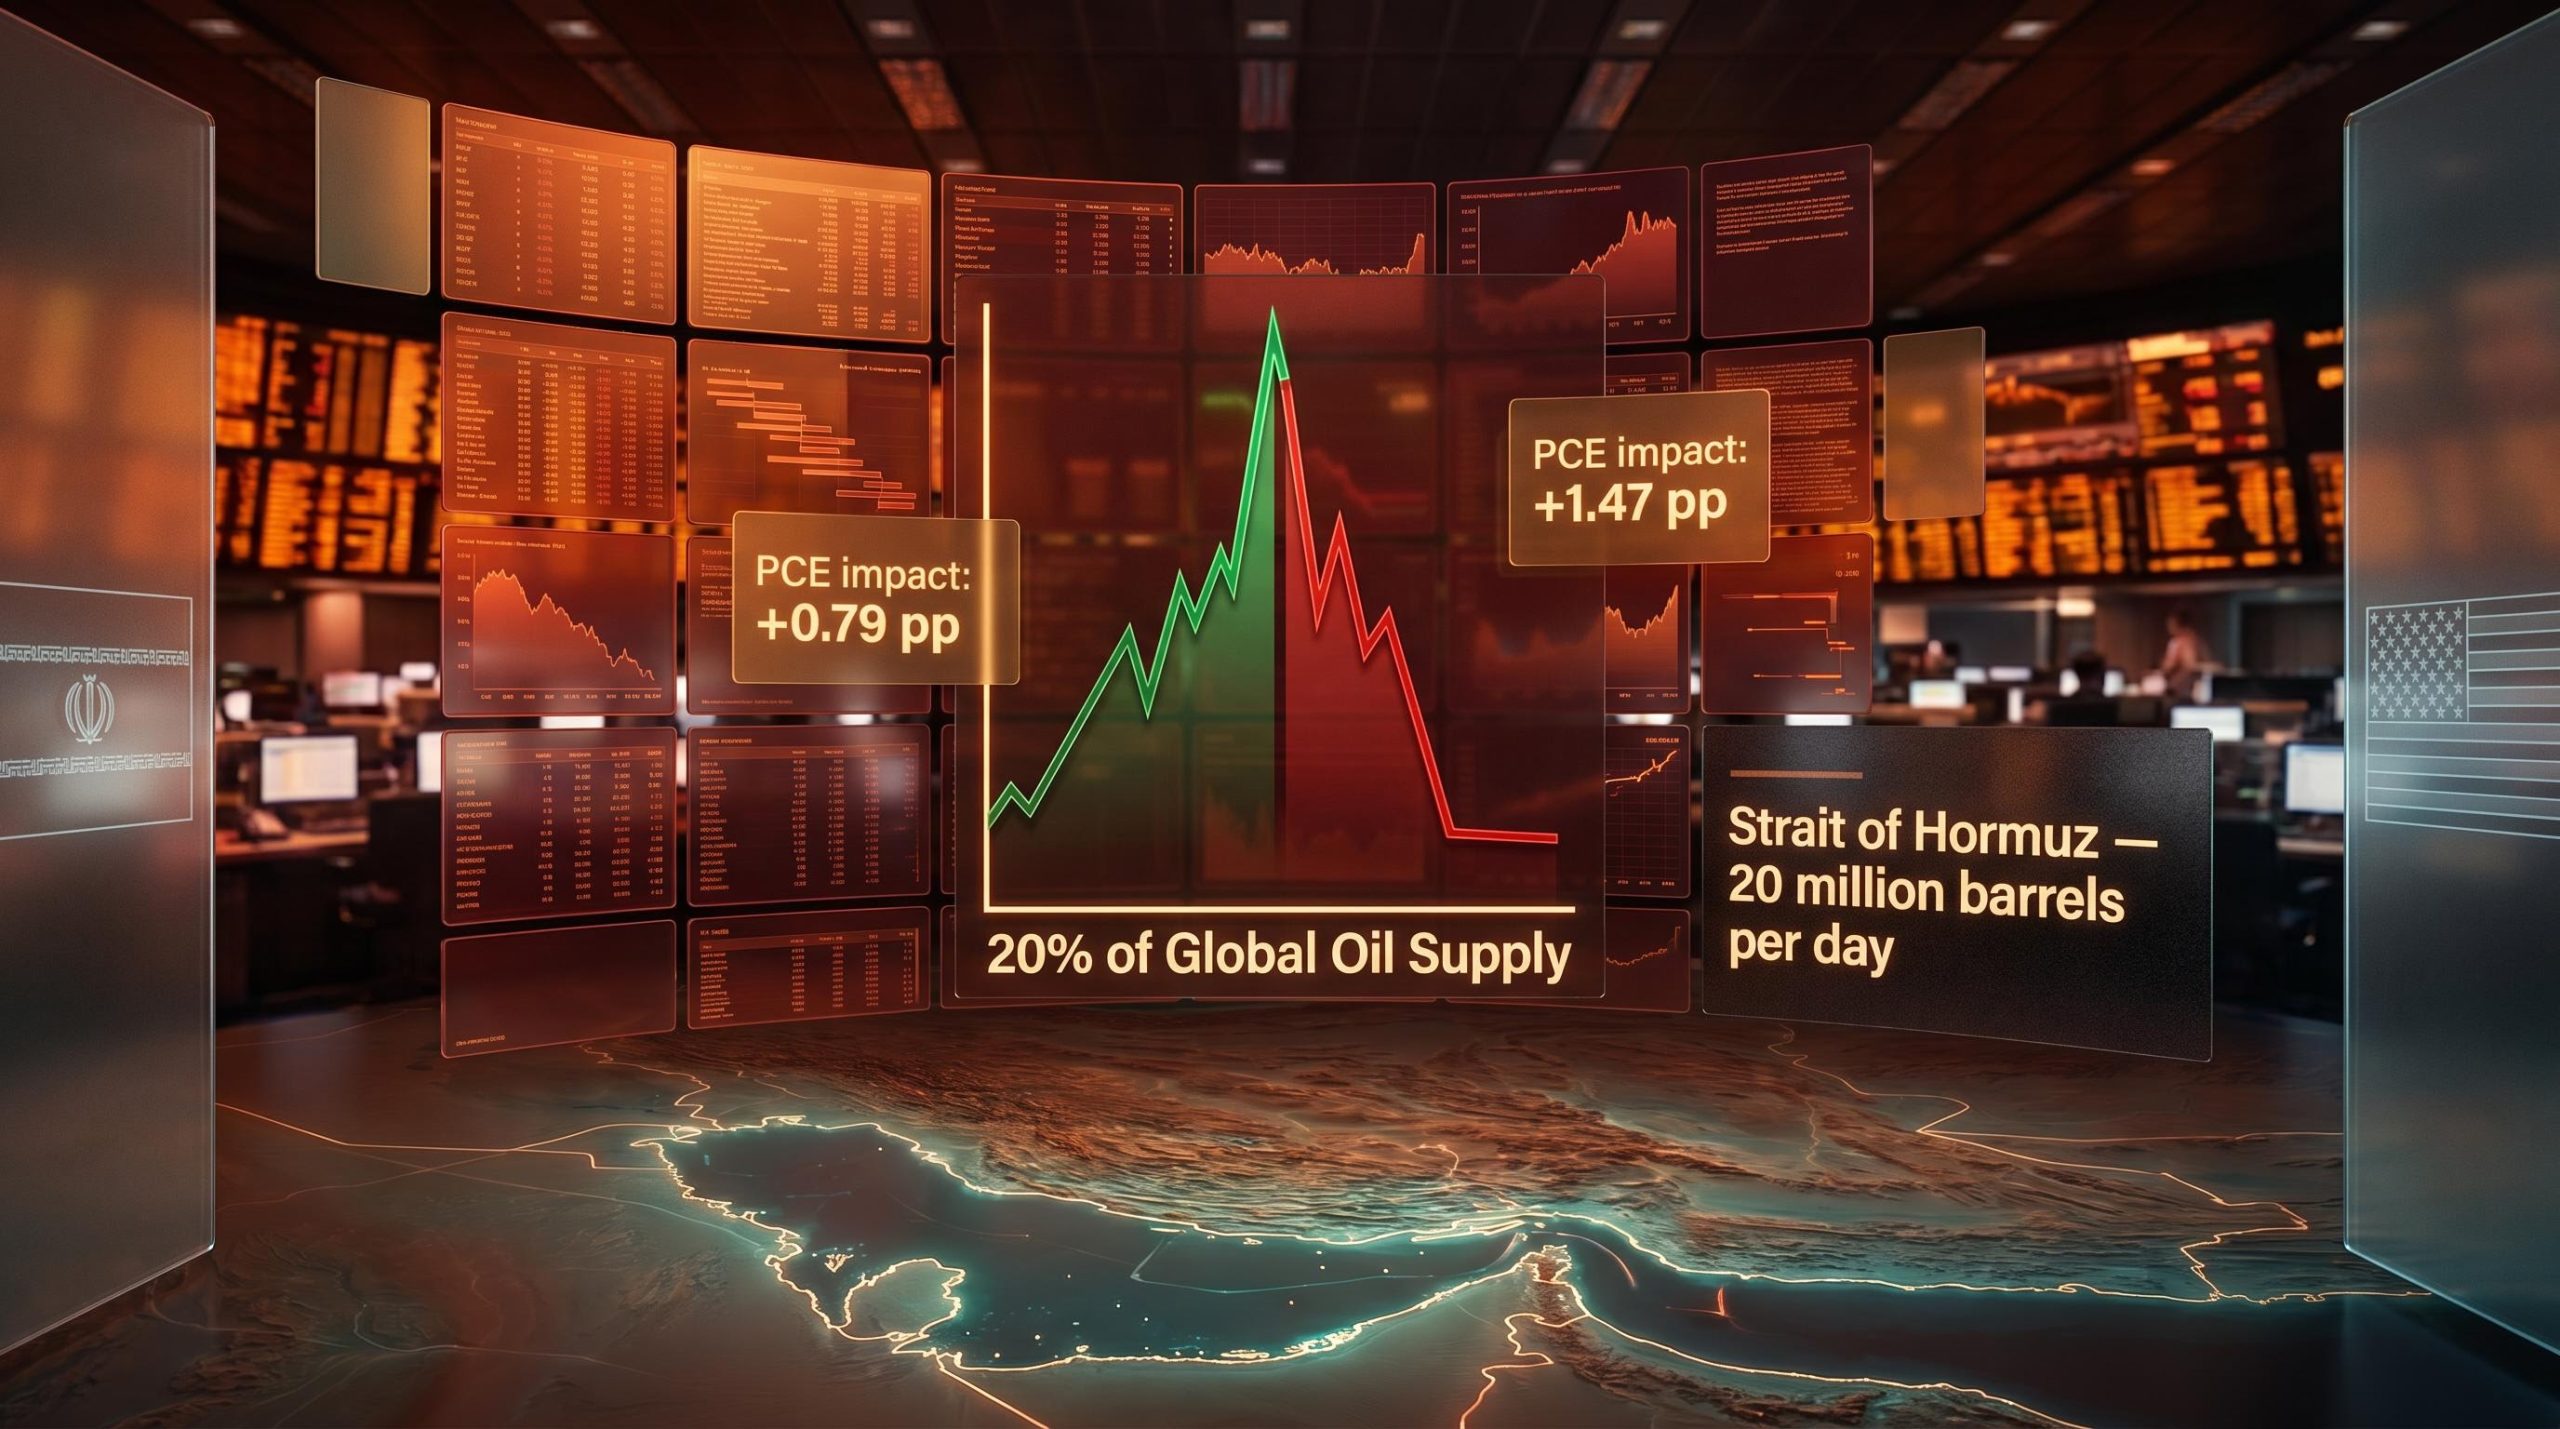
Middle East supply disruptions shut in an estimated 10.5 million barrels per day during April, according to Energy Information Administration data, with the Strait of Hormuz assumed closed until late May under the EIA’s base case. Brent crude averaged US$117 in April and peaked at US$138 on 7 April. On an annual basis, energy prices are up +17.9%, with energy commodities up +29.2%.
The EIA projects Brent declining to approximately US$89 by Q4 2026 and US$79 in 2027. If that trajectory holds, the energy contribution to CPI could fade materially in the second half of the year.
Shelter and services inflation behaves differently from energy. Rents and housing-related costs feed through to CPI with long lags and tend to persist once elevated. The annual core reading of +2.8% is the highest since September 2025, confirming that progress toward the Fed’s 2% target has stalled rather than merely paused.
That is the tension the Fed faces: a large, visible energy spike it might be inclined to look through, sitting alongside a core services acceleration it cannot.
Near-term rate cut expectations are off the table. CME FedWatch pricing following the release showed less than a 50% probability of any cut before the second half of 2027, and the probability of a 25 basis point hike by year-end rose to 29.9% from 21.5% the prior session, a significant single-day jump.
The probability of a year-end rate hike rose to 29.9% on 12 May, up from 21.5% the prior session.
No formal Fed policy statement was issued following the release. New York Fed President John Williams spoke before the data dropped, emphasising data-dependence. A post attributed to Atlanta Fed President Raphael Bostic on social media referenced the need for caution on cuts, though this has not been independently verified.
Two Fed officials had already staked out hawkish positions before the print:
The 2-year Treasury yield rose to approximately 3.95% from 3.90% the prior day. The 10-year stood at approximately 4.46%. For investors in rate-sensitive assets, the shift from a cut-expectation regime to a potential-hike regime represents a change in the cost-of-capital backdrop that can reprice portfolios quickly.
The repricing was not confined to a single corner of the market. The Nasdaq closed down approximately 1.5%, the S&P 500 fell approximately 0.8% (recovering from deeper midday lows), and the Dow managed only a marginal gain.
The hardest-hit sectors followed the rate-sensitivity map precisely:
| Asset/Sector | Direction | Approximate Move |
|---|---|---|
| S&P 500 | Down | -0.8% |
| Nasdaq | Down | -1.5% |
| Dow | Flat/marginal gain | ~0% |
| Brent Crude | Up | +~3% to US$107/bbl |
| Homebuilders | Down | Significant decline |
| Regional Banks | Down | Broad weakness |
The outlier moved in the opposite direction. Brent crude advanced approximately 3% to US$107 per barrel, lifting energy equities against the broader selloff. That divergence is the session’s most telling detail: the very force driving inflation higher was also the one sector where equities gained.
Bank of America delivered the most dramatic revision. BofA withdrew its prior baseline of two cuts in September and October 2026 and pushed its new first-cut expectation to the second half of 2027. BofA’s earlier forecast had assumed Kevin Warsh, the Trump administration’s Fed Chair nominee, would guide policy toward easing; that assumption is now under question.
Bank of America’s revision: Prior baseline of two cuts in September and October 2026 withdrawn; first cut now expected in the second half of 2027.
The directional shift was uniform across the street.
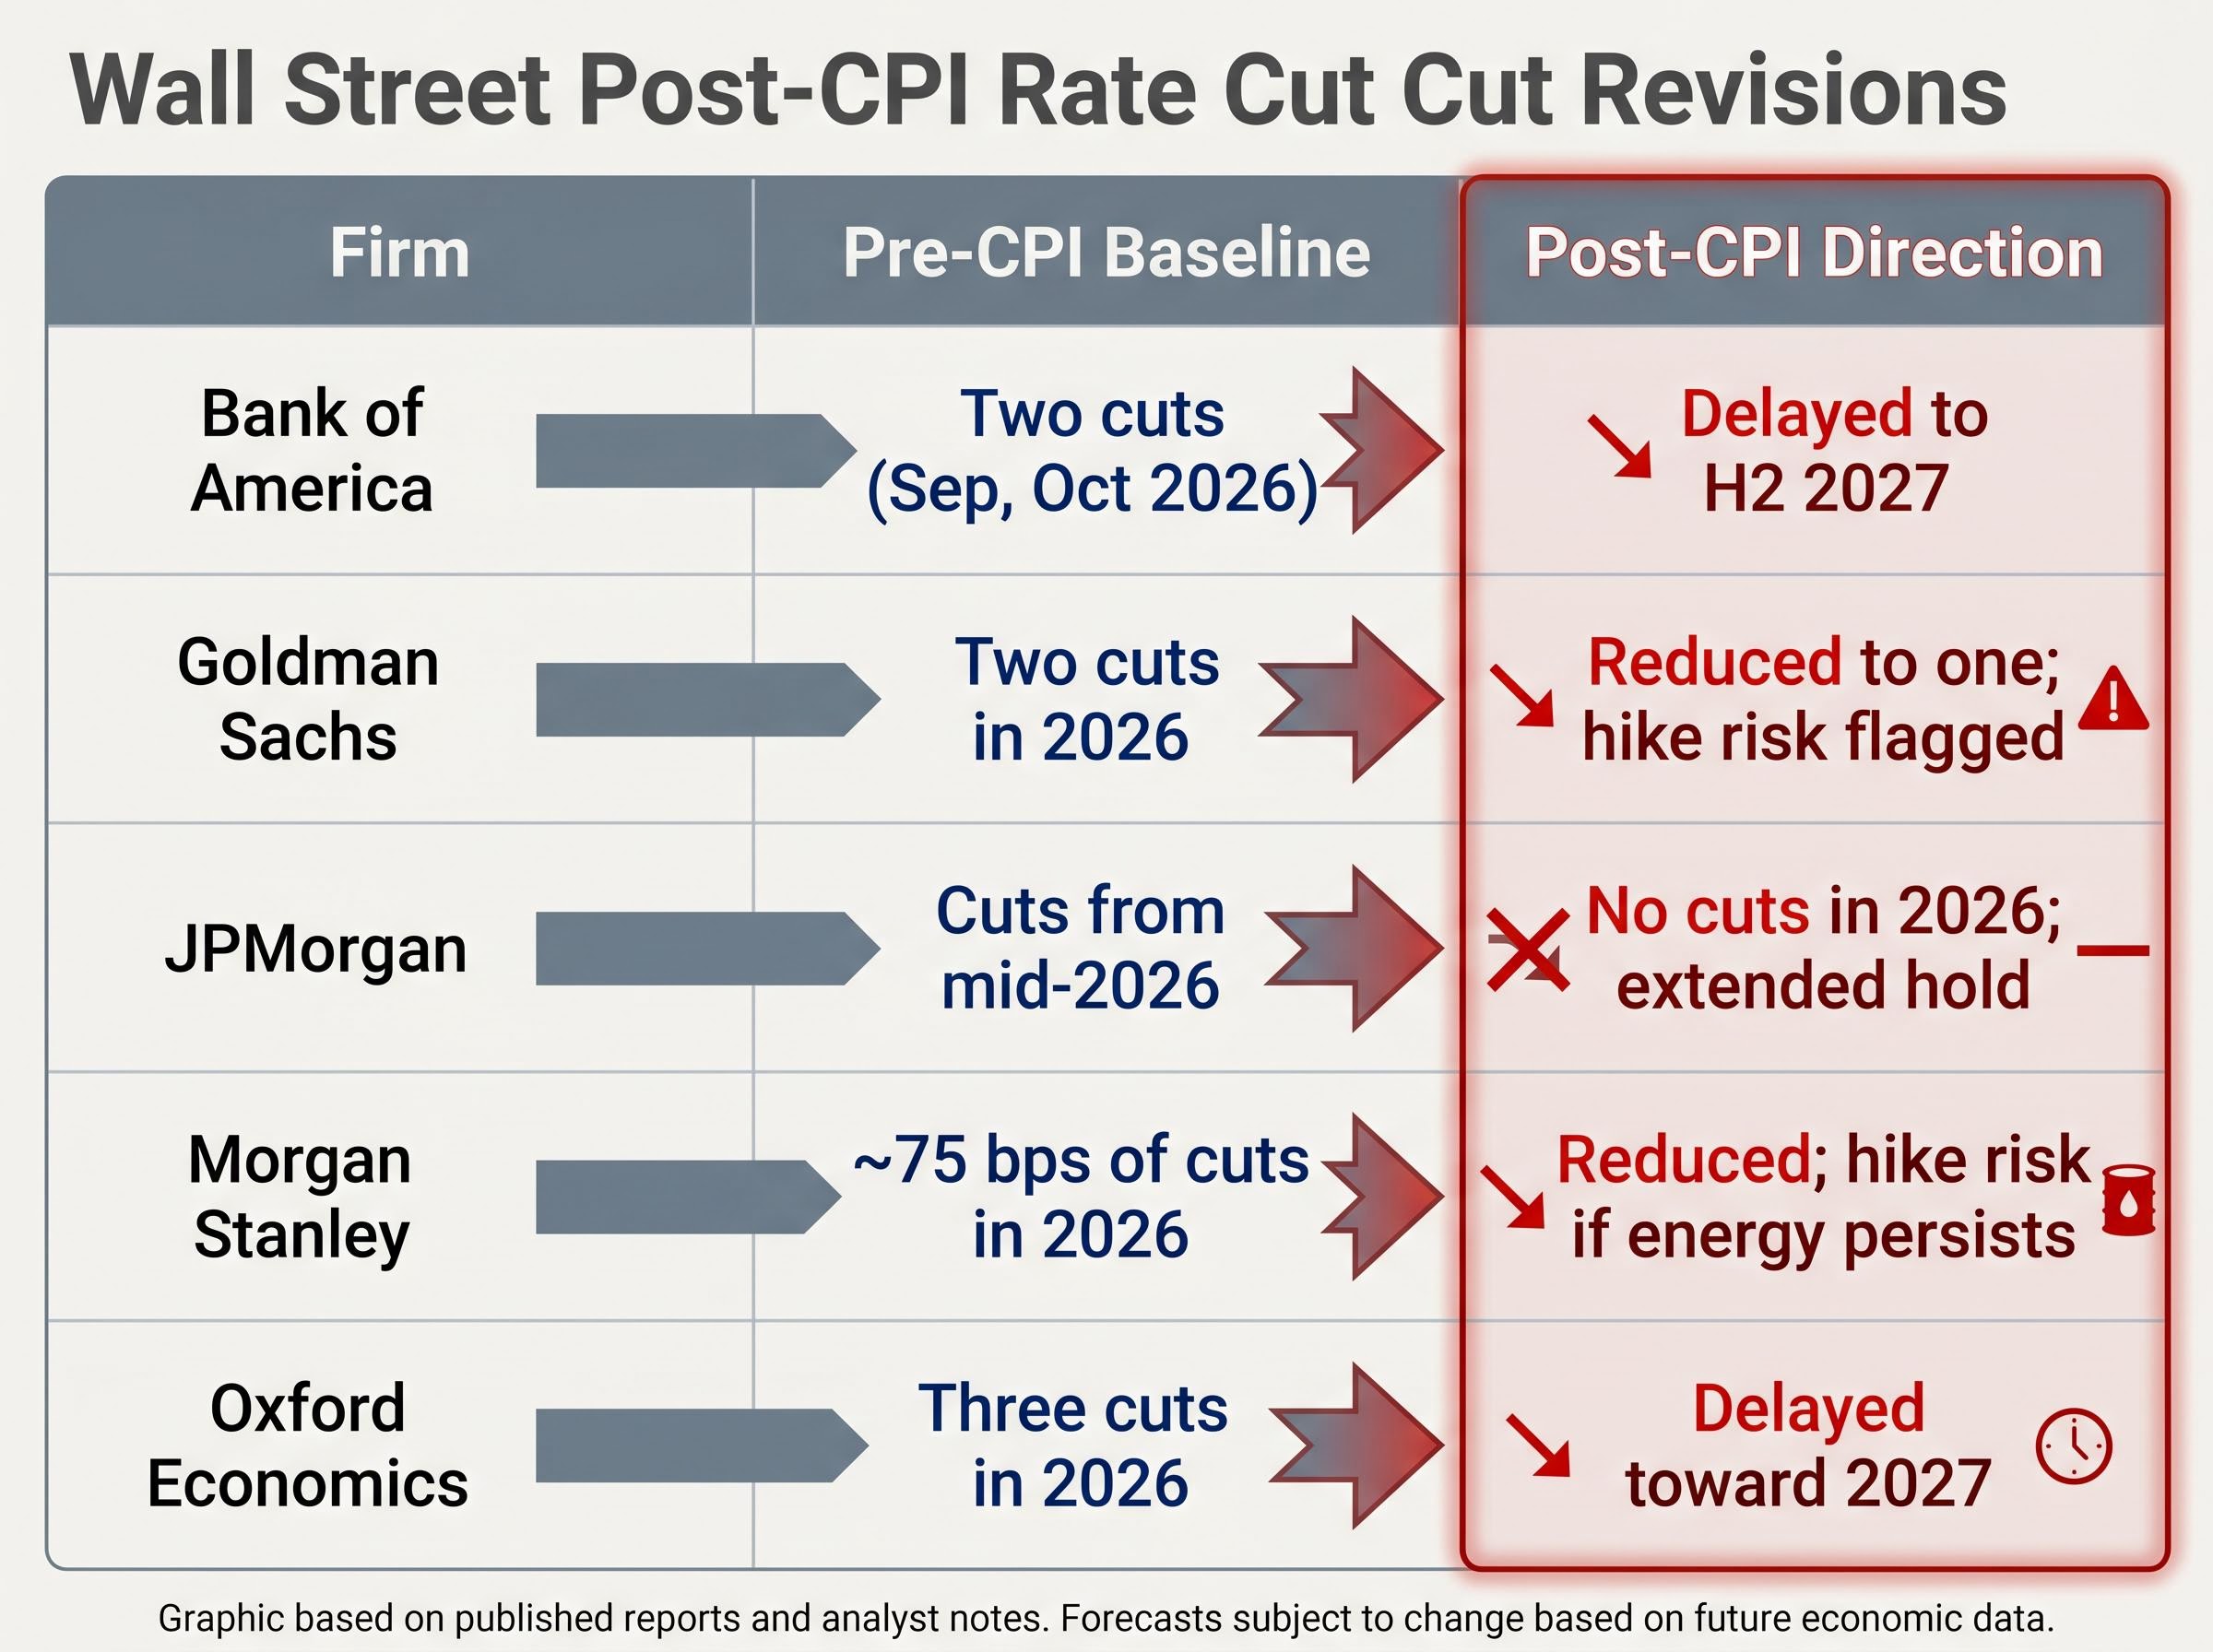
| Firm | Pre-CPI Baseline | Post-CPI Direction |
|---|---|---|
| Bank of America | Two cuts (Sep, Oct 2026) | Delayed to H2 2027 |
| Goldman Sachs | Two cuts in 2026 | Reduced to one; hike risk flagged |
| JPMorgan | Cuts from mid-2026 | No cuts in 2026; extended hold |
| Morgan Stanley | ~75 bps of cuts in 2026 | Reduced; hike risk if energy persists |
| Oxford Economics | Three cuts in 2026 | Delayed toward 2027 |
When five major institutions simultaneously revise rate forecasts in the same direction after a single data release, the signal is unusually strong. The median expectation across the street has shifted to 0-1 cuts in 2026, with hike probability now treated as a genuine scenario rather than a tail risk. Specific post-release research notes carry lower verification confidence at this stage and should be confirmed against 13 May publications as they become available.
The inflation trajectory through Q3 2026 hinges on two variables, and investors can monitor both in real time.
The EIA projects Brent crude declining from approximately US$106 in May-June to approximately US$89 by Q4 2026 and US$79 in 2027. A return to that range would mechanically reduce headline CPI and could give the Fed room to tolerate the current overshoot without tightening further.
Persistent core services prints above +0.3% monthly would keep annual core above 2.5% even with energy normalising. That is the scenario under which rate hike probability continues to build toward and beyond the current 29.9% by year-end.
The April employment report reinforces the hawkish picture. The economy added 115,000 jobs against a 65,000 forecast. Above-target inflation combined with above-consensus employment growth is the dual mandate configuration least likely to prompt Fed easing.
The April CPI was not a borderline beat. It was a 100% overshoot on the headline monthly figure and a broad-based upside surprise across core, shelter, and food. The disinflation narrative that carried markets through 2024 and much of 2025 has stalled.
Core annual CPI at +2.8% sits 0.8 percentage points above the Fed’s 2% target, a gap that widened from March when core stood at +2.6%. The April jump reversed two months of progress on the last mile.
The asymmetric risk facing investors is now clear. The base case across most forecasters is 0-1 cuts in 2026, with rate hike odds approaching 30%. The outcome depends heavily on May and June data.
Until core CPI monthly prints return to the 0.2-0.3% range consistently, the Fed has no data cover to ease. Any further energy-driven upside in headline CPI will accelerate the hike probability already building in markets. The Fed’s next move is no longer a question of timing a cut; it is genuinely bimodal, with meaningful probability on both an extended hold and an outright hike, and portfolio positioning should reflect that asymmetry.
This article is for informational purposes only and should not be considered financial advice. Investors should conduct their own research and consult with financial professionals before making investment decisions. Past performance does not guarantee future results. Financial projections are subject to market conditions and various risk factors.
The Consumer Price Index (CPI) measures the average change in prices paid by consumers for goods and services over time. Investors watch it closely because it directly influences Federal Reserve interest rate decisions, which affect the cost of capital and valuations across equity, bond, and real estate markets.
The April 2026 CPI report showed headline inflation rising +0.6% for the month, double the +0.3% consensus forecast, with the annual rate accelerating to +3.8%, the highest reading since May 2023. Core CPI, which excludes food and energy, also beat expectations at +0.4% monthly and +2.8% annually.
Following the April CPI release, CME FedWatch pricing showed less than a 50% probability of any rate cut before the second half of 2027, while the probability of a 25 basis point hike by year-end rose sharply to 29.9% from 21.5% the prior session. Major banks including Bank of America, Goldman Sachs, and JPMorgan all revised their rate cut forecasts in a more hawkish direction.
The hardest-hit sectors following the CPI release were technology (including semiconductors and software), consumer discretionary, homebuilders, airlines, and regional banks. Energy equities bucked the trend, rising alongside a roughly 3% advance in Brent crude to US$107 per barrel, making energy the standout outperformer on the session.
Investors should monitor the April PPI release, the May CPI report (specifically whether monthly core readings return to the +0.2-0.3% range), the status of Strait of Hormuz supply disruptions, and guidance from the Federal Reserve's September meeting, which is currently the earliest realistic window for any policy easing under market pricing.