How Wesfarmers’ AI Strategy Is Built to Compound Returns
4 hrs ago

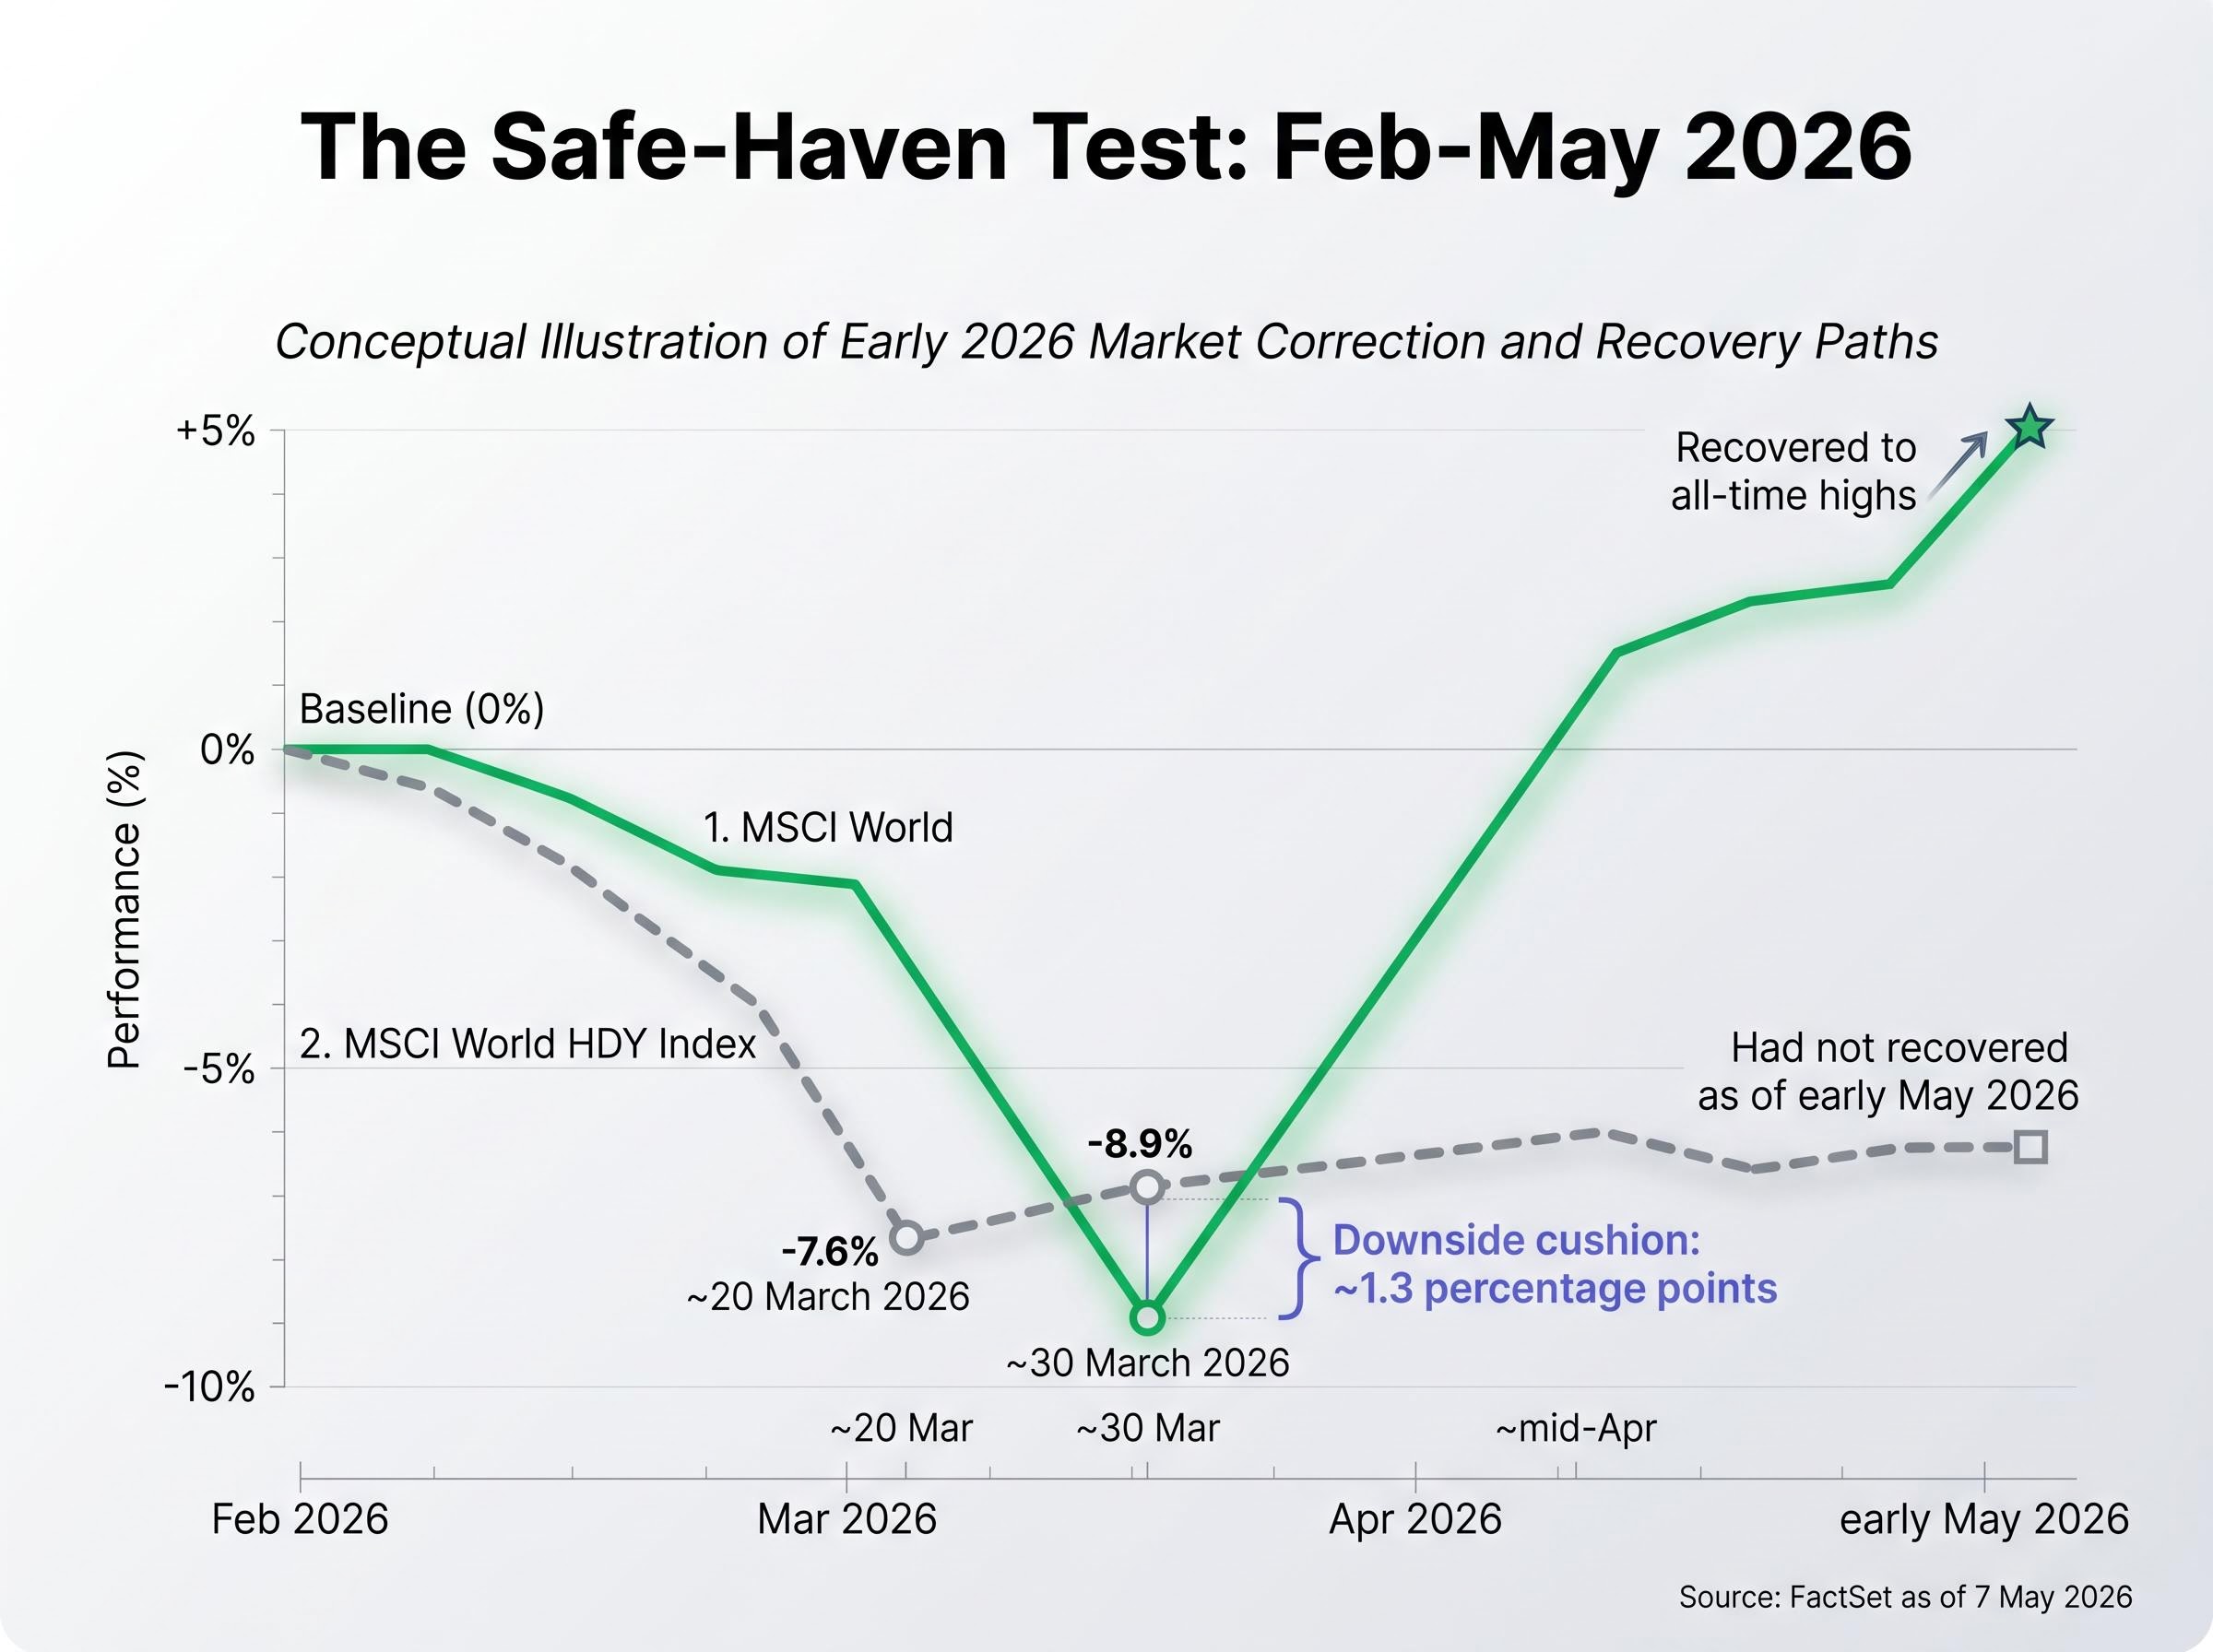
During the February-March 2026 market correction, the MSCI World High Dividend Yield Index fell approximately 7.6% peak-to-trough. The broader MSCI World fell 8.9%. High-dividend stocks offered barely any cushion, and then, as global equities recovered to all-time highs around mid-April 2026, dividend indexes continued trading sideways. The “safe haven” narrative had a rough few weeks. Dividend investing remains one of the most persistently popular strategies among retail investors globally, particularly those approaching or in retirement. But the strategy carries a structural risk that rarely appears in promotional materials: building a portfolio around yield quietly loads investors into Financials, Real Estate, and Utilities while starving them of Technology and Communication Services exposure, the sectors that have led broad market performance for a decade. This article examines the sector composition mechanics behind high-dividend strategies, tests their performance claims against recent and multi-year data, unpacks a fundamental conceptual error about what dividends actually are, and sets out the conditions under which dividend tilts do and do not make sense for globally diversified retail investors.
The numbers tell the story before any commentary is necessary.
| Sector | VYM | SCHD | MSCI World HDY | S&P 500 |
|---|---|---|---|---|
| Financials | 24.1% | 18.9% | ~23-24% | ~13% |
| Real Estate | 7.3% | 0% (ex-REITs) | ~8% | ~2% |
| Utilities | 6.9% | 3.5% | ~7% | ~2% |
| Technology | 4.2% | 5.6% | ~2-3% | ~30% |
SCHD excludes REITs entirely by mandate, which removes one layer of concentration. Financials still dominate its holdings at 18.9%. Across every major high-dividend vehicle, Technology sits below 6%, a fraction of its ~30% weighting in the S&P 500.
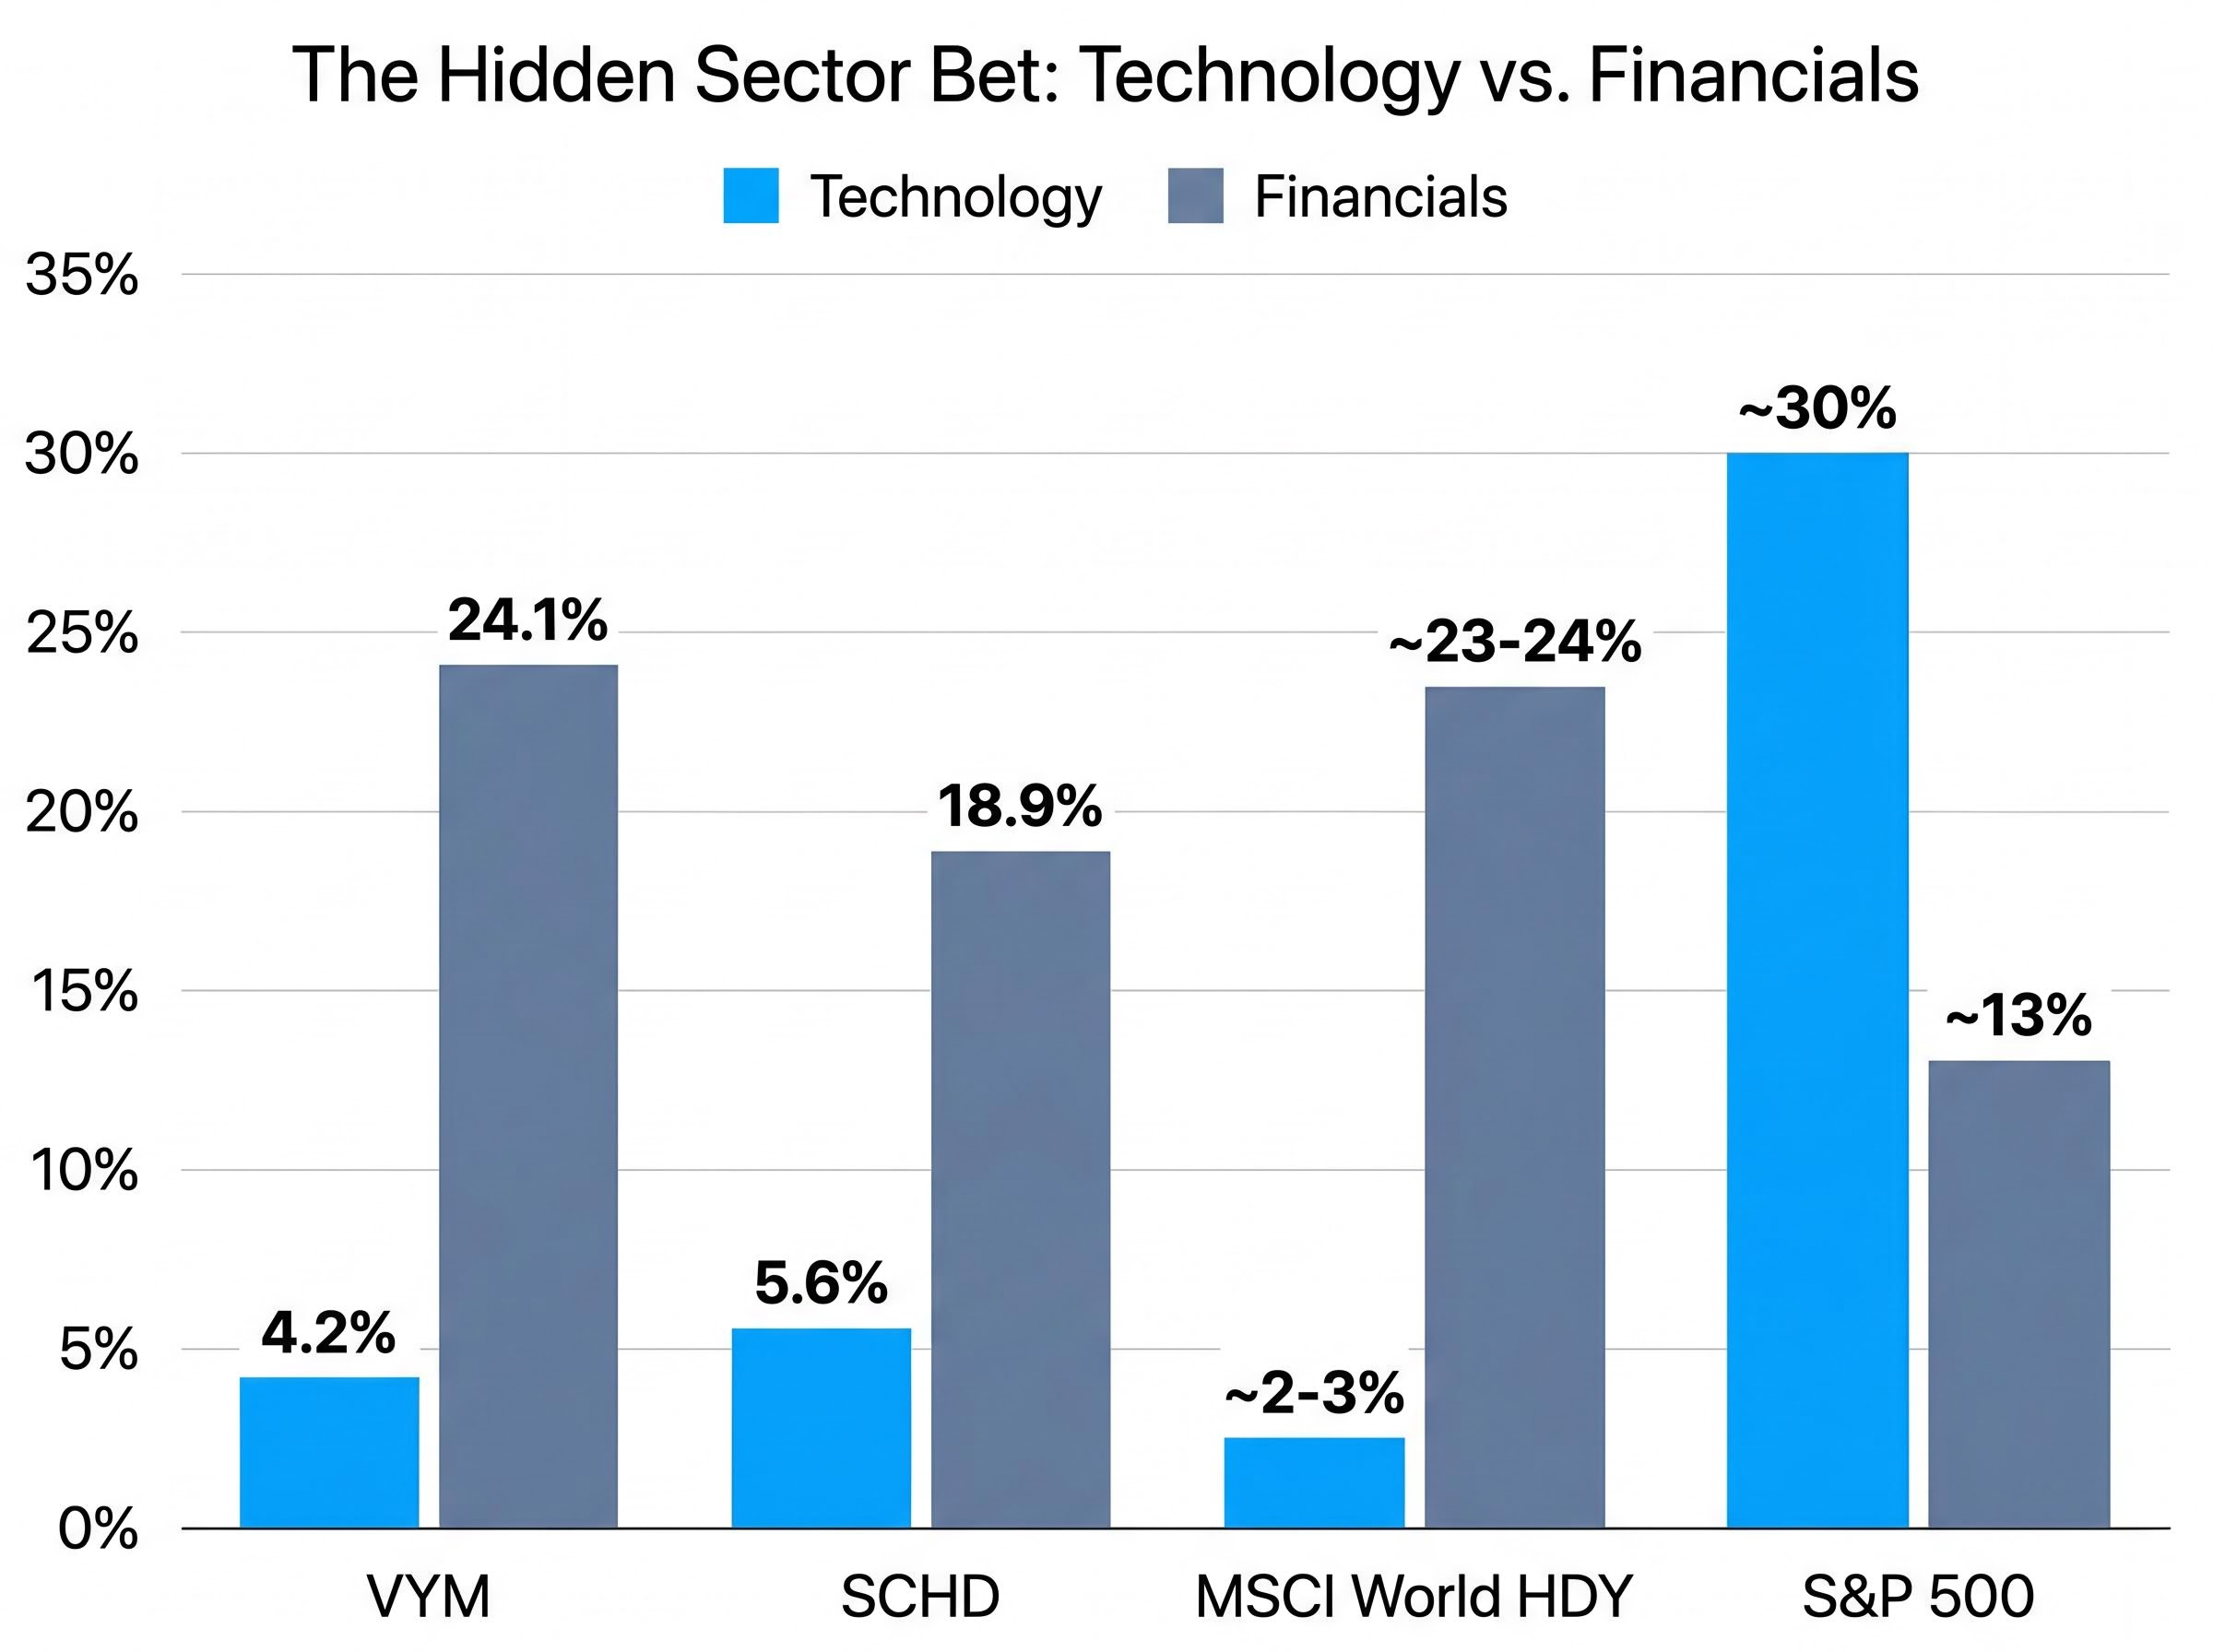
Most retail investors selecting a “dividend ETF” believe they are diversifying their income. In practice, they are making an implicit sector bet of significant size.
The concentration is not accidental. MSCI and comparable index frameworks select for companies with sustained payout histories, which systematically favours mature, cash-flow-heavy sectors: banks, utilities, telecoms, property trusts. These businesses generate the reliable free cash flow that supports consistent dividends.
Technology companies have historically preferred buybacks and reinvestment over dividends. While this has shifted somewhat for mega-caps in recent years, the structural bias in traditional dividend index construction persists. The methodology itself locks in the sector skew.
VYM returned approximately 15.43% in calendar year 2025. That sounds respectable until it sits beside the S&P 500 at approximately 20-21% and the MSCI World at approximately 18-19% over the same period.
VYM delivered approximately 15.43% in 2025. The S&P 500 delivered approximately 20-21%. The dividend yield did not close a gap of 5-6 percentage points in a single year, and it has not closed the gap over five years either.
The annual shortfall compounds. Over a five-year period, high-dividend strategies have lagged broad benchmarks by approximately 4-8 percentage points annualised during Technology-driven bull markets. A 3.5-4.5% dividend yield feels tangible in a brokerage account. The opportunity cost is invisible. But it accumulates.
That exception matters for credibility. It also matters that the market environment since 2008 has not resembled 2008. For the better part of a decade, the cost of the dividend tilt has been a compounding wealth gap.
Many investors treat dividends as income received on top of their investment, something closer to bond interest. The mechanics are different.
Bond interest is paid in addition to the eventual return of principal. A dividend is a return of capital from the company to the shareholder, and the share price reflects that distribution. When Microsoft issued its special dividend in 2004, FactSet data covering 31 December 2003 through 31 December 2004 showed a meaningful divergence between price return and total return for the same stock following dividend payments. The price fell; the total return (including the cash received) told the fuller story.
The dividend mechanics that generate this confusion are precise: on the ex-dividend date, a company’s share price falls by approximately the payment amount, meaning the cash received by the shareholder is offset by a corresponding reduction in the equity they hold, and no net wealth is created at the moment of distribution.
Spencer Jakab, writing in the Wall Street Journal on 7 May 2026, observed that investor surveys reveal widespread incorrect belief that dividends constitute “free money,” and that high payouts may signal limited reinvestment incentive rather than financial strength.
Dividend payments are also not guaranteed. Companies reduce or eliminate them most commonly during economic downturns, precisely when income-dependent investors need them most. An investor who understands that dividends are a return of capital, not a return on capital, is far less likely to chase high yields into deteriorating businesses.
The correction arrived in late February. Global equities sold off through March. Then, by mid-April, broad indexes had recovered to all-time highs. The sequence functioned as a natural experiment for the claim that high-dividend stocks are defensive.
| Measure | MSCI World HDY Index | MSCI World |
|---|---|---|
| Peak-to-trough decline | -7.6% | -8.9% |
| Trough date | ~20 March 2026 | ~30 March 2026 |
| Recovery to all-time highs | Had not recovered as of early May 2026 | Recovered ~mid-April 2026 |
Source: FactSet as of 7 May 2026; Fisher Investments Editorial Staff.
The downside cushion was approximately 1.3 percentage points. That is the entire defensive benefit the high-dividend index delivered during the correction.
The analytically significant observation is not the drawdown. It is what happened after it.
Broad equities recovered to new highs by mid-April. The MSCI World High Dividend Yield Index had not reached that threshold as of early May. Investors who rotated into high-dividend stocks as a defensive move during the correction would have experienced both the drawdown and then missed the recovery. The strategy offered the worst of both outcomes: marginal downside protection paired with failure to participate in the rebound.
The critique above does not mean dividend strategies are inherently flawed. It means most retail investors implement them incorrectly, as a core holding rather than a targeted tool.
The practitioner consensus, reflected in positioning from BlackRock and the broader financial planning community, converges on a 10-20% satellite allocation within a diversified portfolio. That sizing captures the income benefit without letting the sector concentration overwhelm the portfolio’s total return profile.
The yield trap in practice: Walgreens Boots Alliance (WBA) carried a yield above 9% prior to 30 January 2025, when it suspended its dividend entirely. The stock fell approximately -10% on the announcement. This followed a 48% cut in January 2024. A yield above 9% was not a sign of income strength; it was a signal of financial stress priced into the shares.
Quality screening matters more than yield level. Four indicators separate sustainable dividend payers from yield traps:
Dividend-growth screening, which filters for payout sustainability and earnings quality rather than raw yield, has historically produced stronger long-run total returns than pure high-yield approaches, a distinction supported by OSAM Research and 2026 Morningstar analyst commentary, and one that the 2026 correction made newly visible as quality-screened holdings diverged from high-yield benchmarks during the drawdown.
For non-US investors, structural considerations further reduce the net benefit of US-focused dividend strategies:
The FTSE All-World High Dividend Yield Index, yielding approximately 4-5%, offers a globally diversified alternative that reduces single-market sector concentration for investors outside the United States.
Total return, price movement plus dividend income combined, is the only metric that enables an honest comparison between dividend strategies and broad market alternatives. Evaluating a high-dividend ETF on its yield alone is like evaluating a business on its revenue without looking at its costs.
A rigorous total return comparison requires accounting for the tax-timing advantage that broad index strategies hold in taxable accounts: dividend investors face a forced annual tax event regardless of whether they need the cash flow, while total return investors control when they realise gains, a structural asymmetry that compounds meaningfully over a decade.
The behavioural risk is real. Dividend income feels tangible: cash appears in the brokerage account on a regular schedule. The opportunity cost (the compounding gap versus a broad benchmark) is invisible and deferred. This asymmetry creates a systematic bias toward yield-chasing without adequate quality assessment.
A three-step total return evaluation provides a more complete picture:
Even with VYM’s 15.43% return in 2025, total return still lagged the S&P 500 by approximately 5-6 percentage points. Reinvested dividends have historically contributed significantly to long-term total returns in low-growth environments, and that compounding argument carries weight. But the evidence from recent market cycles shows the dividend tilt has cost more than it has contributed for broadly diversified investors.
A dividend allocation earns its place in a portfolio when four conditions are met:
Holding dividend strategies inside tax-sheltered structures matters precisely because compounding on gross returns annually, rather than on returns net of dividend tax drag, produces a material wealth advantage over a 20-year horizon, a gap that widens at higher yield levels and in higher marginal-rate tax environments.
Dividend investing is a legitimate strategy with documented benefits in specific conditions, particularly for income-dependent investors who need cash flow without liquidating holdings. The sector concentration, the compounding opportunity cost, and the tax drag are not reasons to dismiss the approach entirely.
They are reasons to implement it correctly.
The February-March 2026 correction provided a recent, concrete test. High-dividend stocks offered approximately 1.3 percentage points of additional downside cushion and then failed to participate in the recovery. The safe-haven narrative did not hold.
The actionable reframe is straightforward: evaluate any dividend strategy on total return, not yield. Position it as a satellite, not a core holding. Screen for quality rather than chasing the highest yield. Account for tax drag before treating the headline figure as net income.
Past performance does not guarantee future results. Financial projections are subject to market conditions and various risk factors.
This article is for informational purposes only and should not be considered financial advice. Investors should conduct their own research and consult with financial professionals before making investment decisions.
Dividend investing strategy involves building a portfolio around stocks that pay regular cash distributions to shareholders. However, because dividends are funded by cash leaving the company, the share price adjusts downward on the ex-dividend date by approximately the payment amount, meaning no net wealth is created at the moment of distribution.
High-dividend index methodologies select for companies with sustained payout histories, which systematically favours mature, cash-flow-heavy sectors like banks, utilities, and telecoms. Technology companies have historically preferred buybacks and reinvestment over dividends, leaving popular dividend ETFs such as VYM and SCHD with technology weightings below 6%, compared to roughly 30% in the S&P 500.
During the February-March 2026 correction, the MSCI World High Dividend Yield Index fell 7.6% peak-to-trough versus 8.9% for the broader MSCI World, providing only about 1.3 percentage points of additional cushion. Broad equities then recovered to all-time highs by mid-April 2026, while the high-dividend index had not recovered as of early May 2026.
A yield trap occurs when an unusually high dividend yield signals underlying financial stress rather than income strength; Walgreens Boots Alliance, for example, carried a yield above 9% before suspending its dividend entirely on 30 January 2025, sending the stock down roughly 10%. Investors can avoid yield traps by screening for dividend coverage ratios, free cash flow yield, payout growth consistency, and treating yields above 6-8% as a warning signal rather than an opportunity.
Practitioner consensus, including positioning from BlackRock and the broader financial planning community, converges on a 10-20% satellite allocation rather than using dividend strategies as a core holding. This sizing captures the income benefit without allowing sector concentration in Financials, Real Estate, and Utilities to overwhelm the portfolio's total return profile.