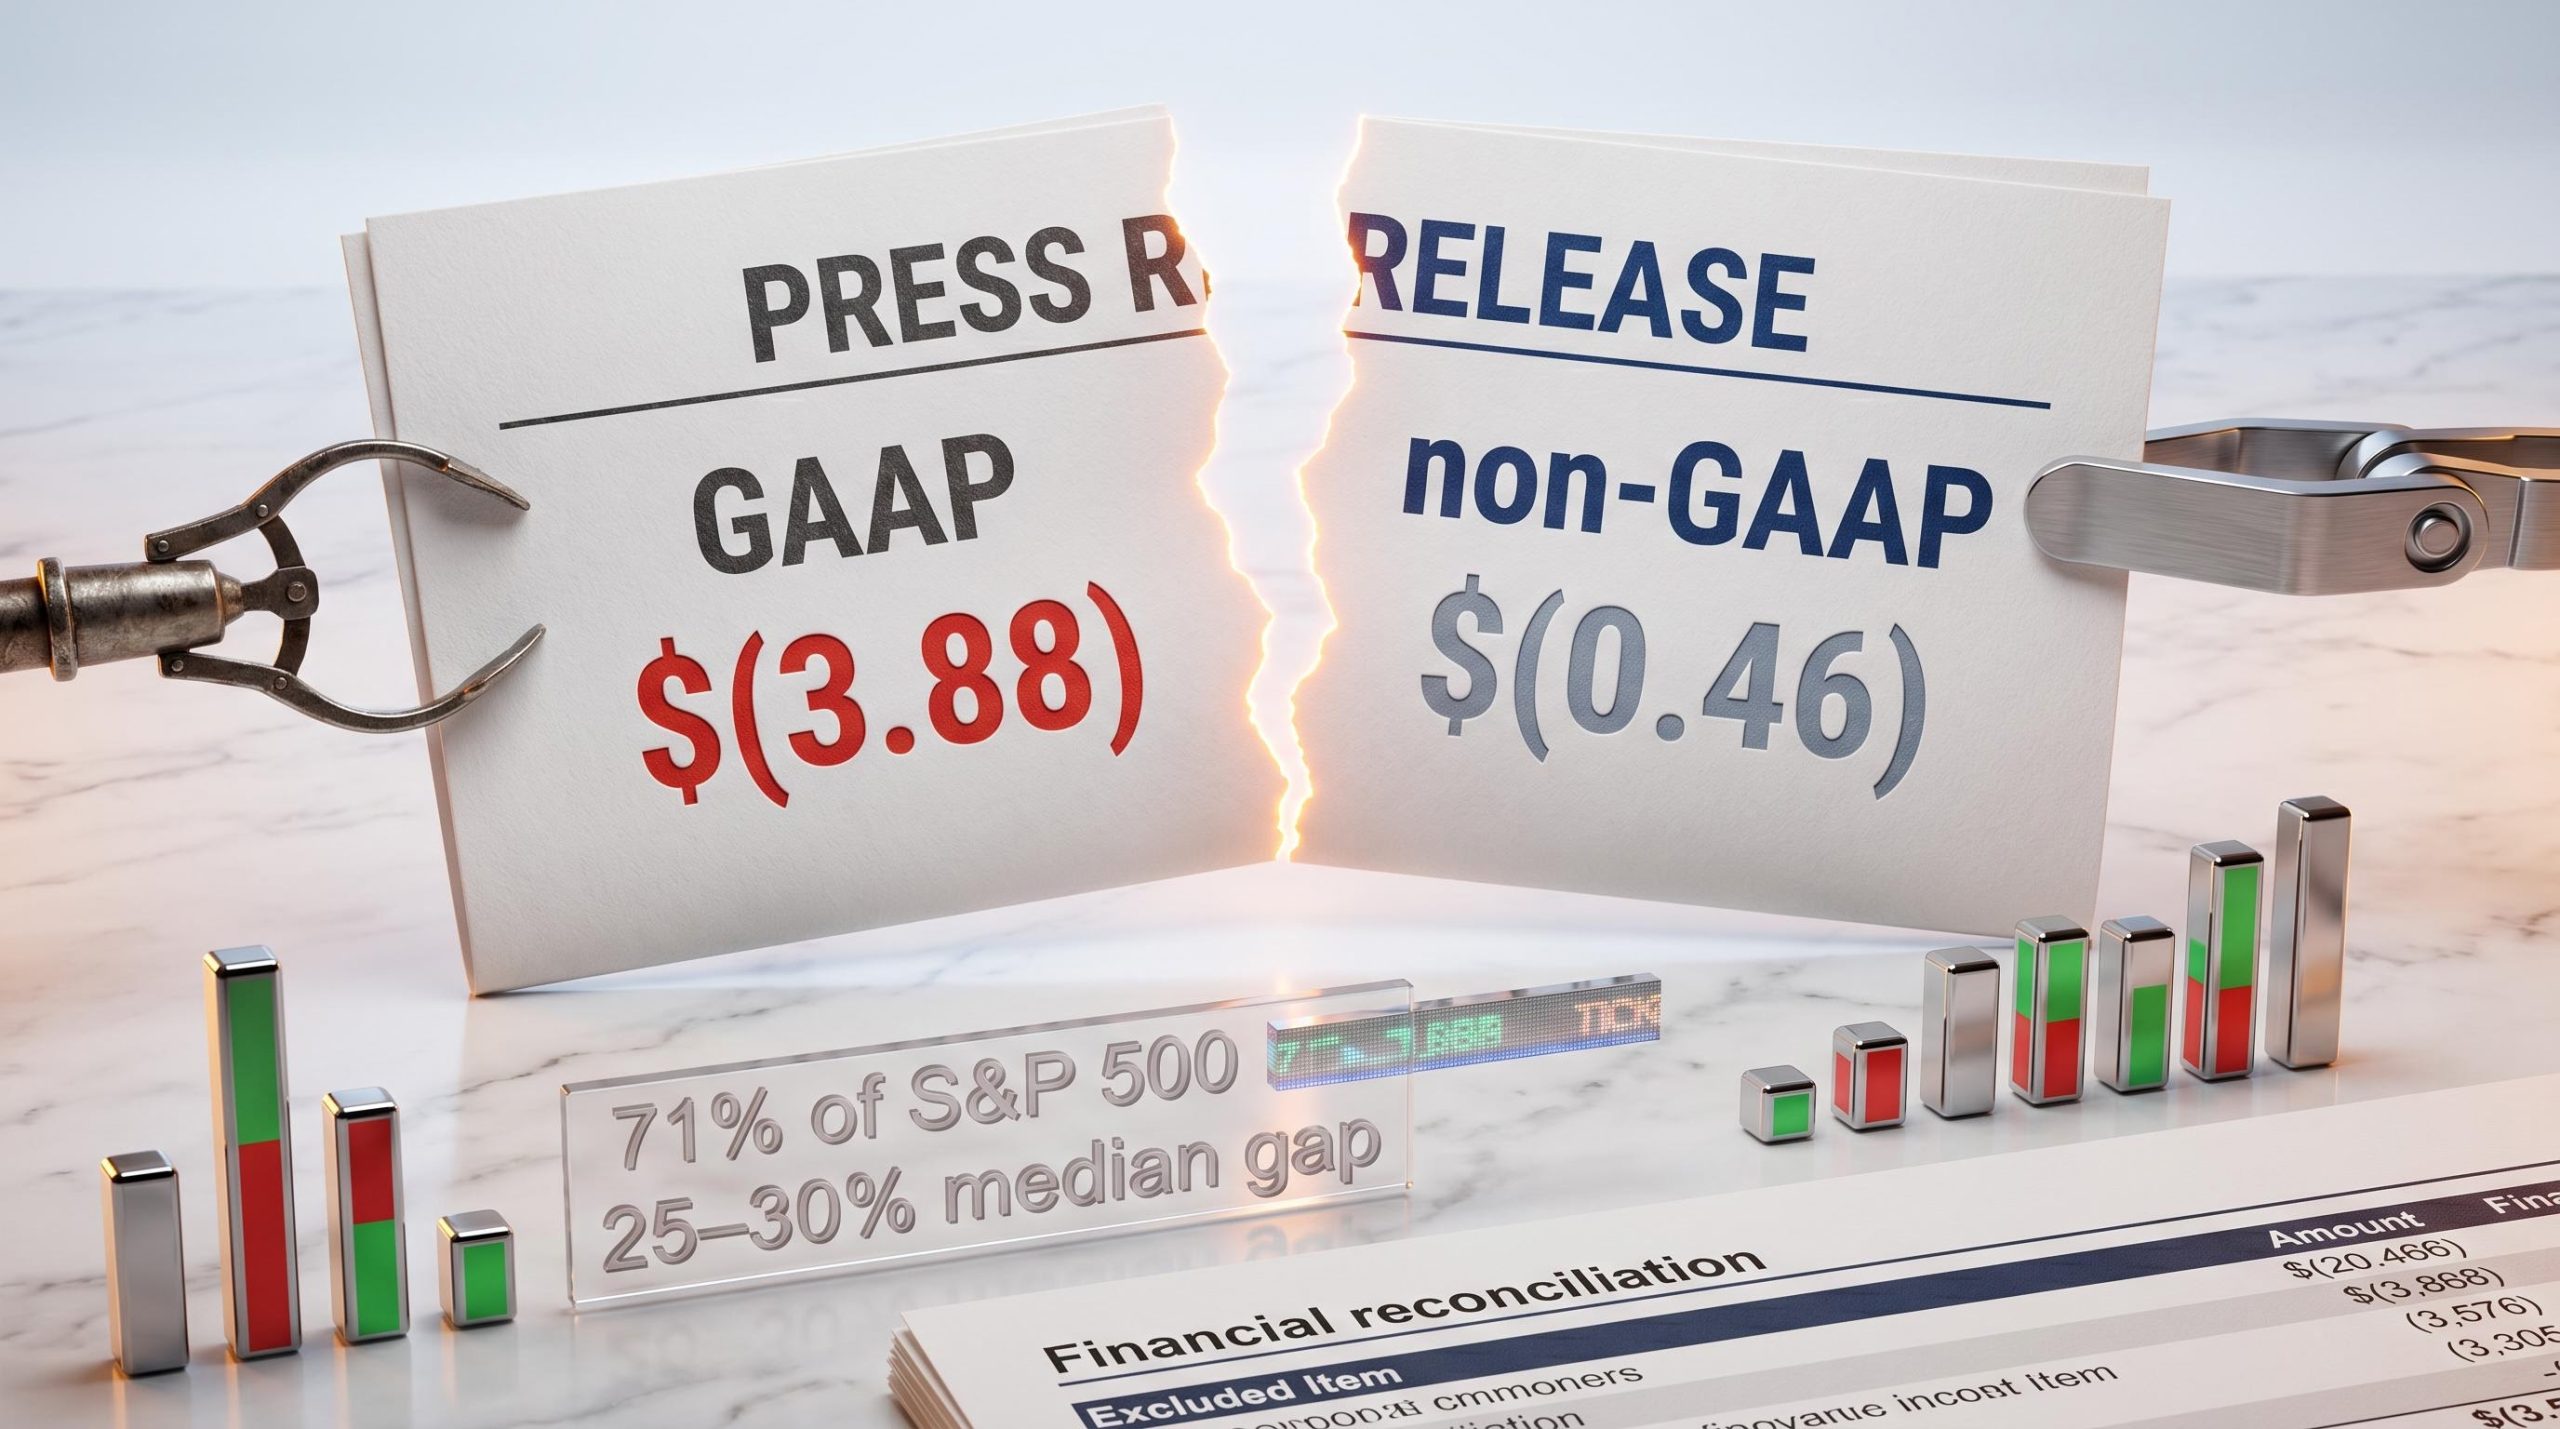
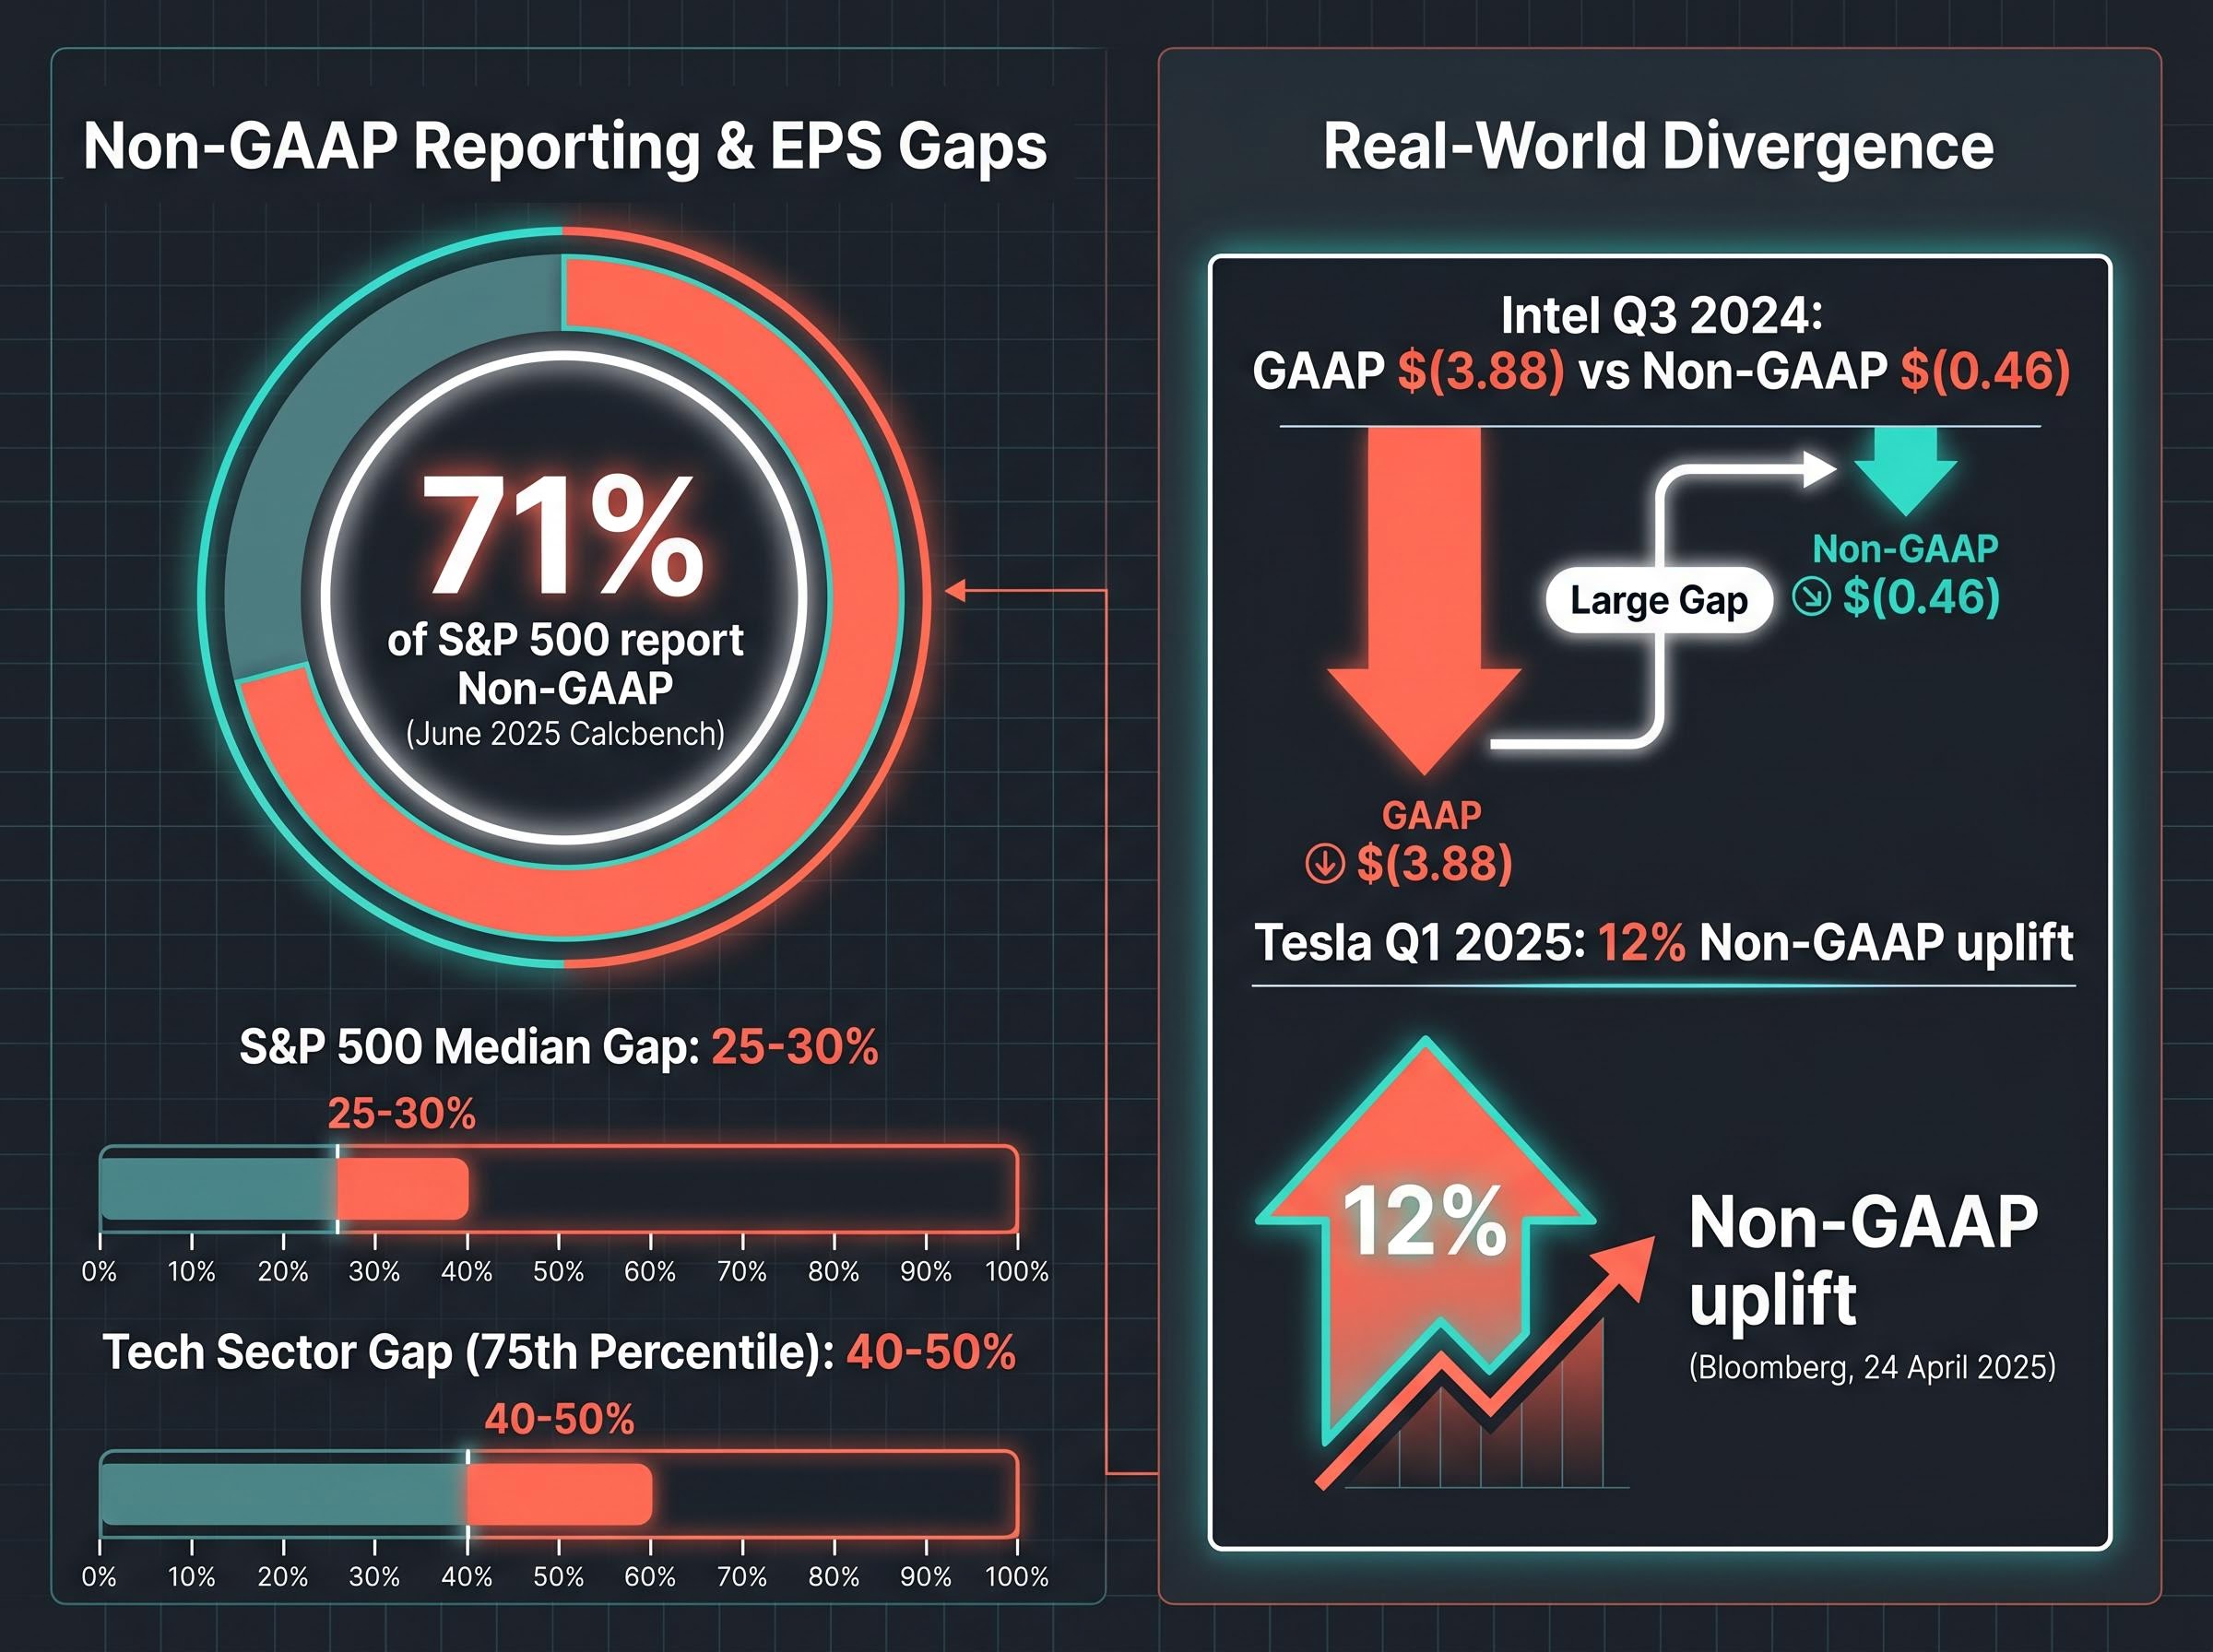
Approximately 71% of S&P 500 companies now report two different versions of their earnings, according to a June 2025 Calcbench study. One number follows the standardised accounting rules every public company is required to use. The other is a supplemental figure, adjusted by management to exclude costs they characterise as non-recurring or not reflective of ongoing operations. For investors scanning headlines on earnings day, the difference between GAAP and non-GAAP figures can be the gap between an apparent beat and an actual miss. This article explains what each number measures, how the SEC regulates adjusted disclosures, where the figures most commonly diverge, and how to evaluate whether a company’s adjustments are analytically honest or selectively flattering. By the end, readers will hold a practical framework they can apply to any earnings release.
Two sets of numbers, one company: what GAAP and non-GAAP actually measure
On earnings day, the first number a reader encounters in a press release headline is almost always the one management wants them to see. Whether that figure follows GAAP or departs from it determines what story the company is telling.
GAAP (Generally Accepted Accounting Principles) is the standardised, SEC-mandated ruleset governing how all U.S. public companies must recognise revenues, expenses, assets, and liabilities in their official filings. Every line item in a 10-Q or 10-K follows these rules. GAAP exists to make one company’s financials comparable to another’s.
Non-GAAP measures are voluntary supplemental metrics. Companies disclose them to strip out items management characterises as non-recurring, non-cash, or not reflective of ongoing operations. The Calcbench study found roughly 71% of S&P 500 companies now publish at least one such metric alongside their GAAP results.
Neither number is inherently correct or dishonest. They answer different questions. GAAP captures the full economic picture under a uniform standard. Non-GAAP attempts to isolate what management considers the underlying operational trend. The investor’s job is knowing which question each number answers.
The four non-GAAP metrics investors encounter most frequently:
- Adjusted EPS: Earnings per share after management removes items it deems non-recurring or non-cash
- Adjusted EBITDA: Earnings before interest, taxes, depreciation, and amortisation, with additional exclusions applied
- Adjusted Operating Income: Operating profit with selected costs stripped out
- Free Cash Flow: Cash generated by operations minus capital expenditures, sometimes further adjusted
When big ASX news breaks, our subscribers know first
What the SEC requires when companies go beyond GAAP
Non-GAAP reporting is not an unregulated side channel. It operates within a structured disclosure regime, and the rules give investors specific protections worth knowing.
Two regulatory anchors govern the practice. Regulation G applies to all public disclosures of non-GAAP measures, including earnings calls and press releases. Item 10(e) of Regulation S-K applies to non-GAAP measures in SEC filings. Together, they impose four core requirements:
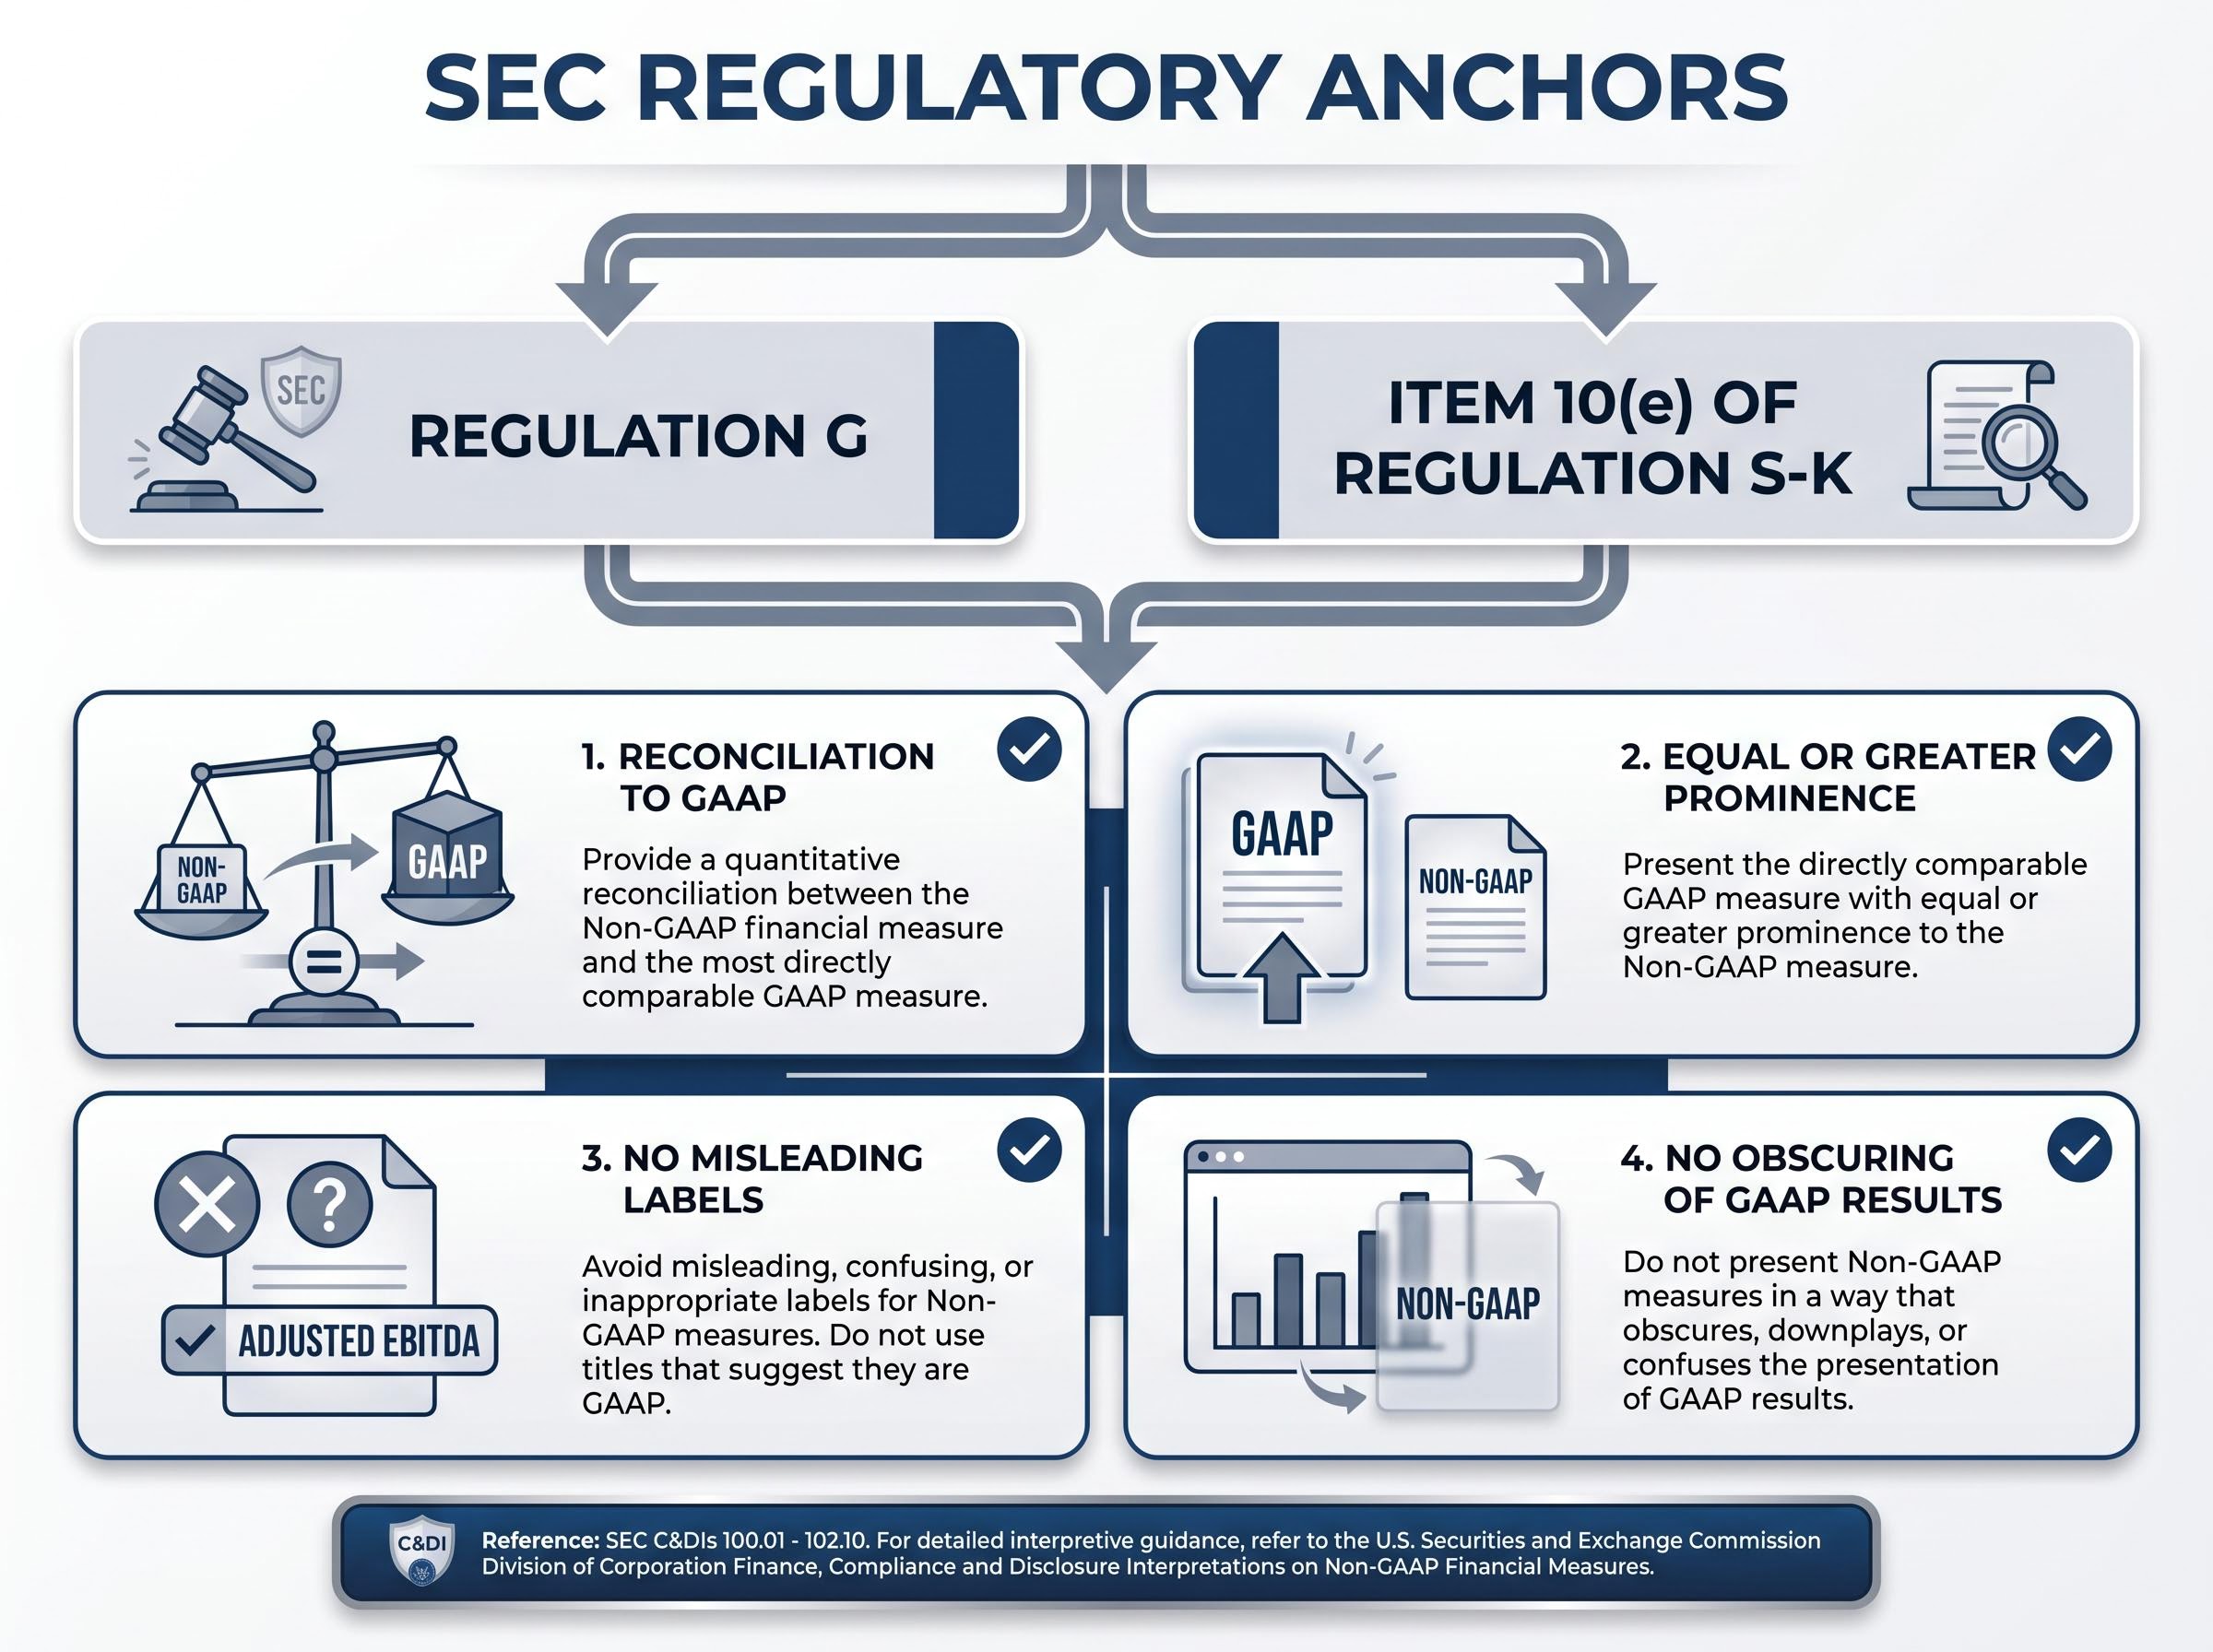
- Reconciliation to GAAP: Every non-GAAP metric must be accompanied by a reconciliation to the most directly comparable GAAP measure, showing exactly what was excluded and by how much.
- Equal or greater prominence: Non-GAAP figures cannot be presented more prominently than their GAAP equivalents in any disclosure.
- No misleading labels: Companies cannot characterise recurring charges as non-recurring or use language that misrepresents the nature of excluded items.
- No obscuring of GAAP results: The presentation must not bury or contradict the GAAP figures.
The SEC’s Compliance and Disclosure Interpretations (C&DIs), spanning sections 100.01 through 102.10, provide ongoing interpretive guidance on what constitutes permissible versus misleading presentation. The SEC enforces these rules through comment letters, periodic filing reviews, and enforcement actions, with ongoing scrutiny directed at companies that habitually exclude the same cost categories year after year under a one-time label.
SEC reporting frequency changes currently under proposal would allow eligible companies to file semiannually rather than quarterly, a shift that would reduce the number of reconciliation tables investors receive each year and extend the period during which insiders hold information that outside investors cannot access.
For investors, the practical takeaway is straightforward: the reconciliation table is not optional. If it is difficult to find in an earnings release, that difficulty is itself a signal worth noting.
The five items companies most commonly strip out, and why it matters
Knowing the rules is one layer. Recognising the patterns is the next. Across S&P 500 non-GAAP disclosures, five categories of exclusions appear far more frequently than any others, and each carries both a legitimate use case and a red flag scenario.
| Excluded Item | Legitimate Use Case | Red Flag Scenario |
|---|---|---|
| Stock-based compensation (SBC) | Non-cash charge; excluding it can clarify cash-generation trends | SBC exceeds 10% of revenue annually, creating persistent shareholder dilution that the adjusted figure ignores |
| Restructuring and acquisition-related costs | Genuinely one-time transaction fees or severance from a specific event | Restructuring charges appear every single year, suggesting they are the cost of doing business |
| Amortisation of acquired intangibles | Excluding it helps compare organic performance against acquired performance | Serial acquirers exclude amortisation every period, permanently inflating margins |
| Litigation settlements | A single large settlement unrelated to core operations | Legal costs recur across multiple periods, indicating systemic regulatory or compliance risk |
| Impairment charges | A write-down tied to a discrete asset revaluation event | Goodwill impairments recur annually, masking structural deterioration in acquired brand or asset value |
The scale of these exclusions is material. The median non-GAAP EPS for S&P 500 companies exceeds GAAP EPS by roughly 25-30% in recent periods. In the technology sector, that gap frequently widens beyond 40-50% at the 75th percentile.
Stock-based compensation remains the most consequential and contested exclusion. It is a non-cash charge on the income statement, but it represents a real economic cost to shareholders through dilution. When a company excludes SBC every quarter, the adjusted earnings figure omits a cost that is as predictable and recurring as salaries.
Two verified examples illustrate the gap at its most extreme. Intel reported Q3 2024 GAAP EPS of $(3.88) against non-GAAP EPS of $(0.46), with large restructuring and impairment charges driving the difference. Tesla’s Q1 2025 adjusted earnings excluded a crypto-related loss, producing a roughly 12% uplift in the non-GAAP figure, according to Bloomberg reporting from 24 April 2025.
Intel’s Q3 2024 earnings release confirmed GAAP EPS of $(3.88) against non-GAAP EPS of $(0.46), with the reconciliation table attributing the difference primarily to restructuring charges and impairment costs that management characterised as non-recurring.
How the same exclusions become a problem when they never stop recurring
A restructuring charge in a single year is a one-time event. A restructuring charge that appears in the reconciliation table for three consecutive years is something else entirely.
The logic of non-GAAP reporting depends on the premise that excluded items are genuinely non-recurring. When a company removes the same cost category from adjusted earnings every period, the exclusion ceases to function as a clarifying adjustment. It becomes a permanent filter that inflates the reported picture of operational performance. Analysts and institutional investors refer to this pattern as “perma-exclusions.”
The analytical consequence is direct: a company whose non-GAAP EPS grows while GAAP EPS deteriorates over the same multi-year window may be expanding the scope of its adjustments rather than improving its underlying business. The CFA Institute has published guidance emphasising that non-GAAP measures require particular scrutiny when the same exclusions recur consistently across periods.
“If the same ‘one-time’ charge appears in the reconciliation for three consecutive years, it is not one-time. It is the cost of doing business.”
Named patterns worth knowing
Kraft Heinz has habitually excluded goodwill impairment charges from adjusted earnings across multiple annual periods, with large write-downs characterised as non-recurring despite appearing repeatedly. Value investors and analysts have pointed to this practice as an example of how perma-exclusions can mask structural deterioration in brand value.
Palantir has faced criticism from institutional investors for the breadth of items excluded from its non-GAAP operating income, with a meaningful share of operating expenses characterised as non-recurring across multiple consecutive periods. Snowflake has drawn similar attention for the magnitude of SBC exclusions relative to revenue in its FY2025 results.
Naming these companies is not an investment judgement. It is an illustration of a disclosure pattern that any investor can learn to recognise by reading reconciliation tables across multiple periods.
A practical framework for reading any earnings release
Conceptual knowledge converts into an edge only when it becomes a repeatable process. The following six-step framework, drawn from SEC regulatory requirements and established analytical best practices, can be applied to any earnings press release.
- Locate the reconciliation table. SEC rules require it. Find the bridge between GAAP and non-GAAP figures and read every line item that was excluded.
- Test each exclusion for recurrence. Pull up the same reconciliation from the prior two or three periods. If the same “non-recurring” item appears every time, treat it as a recurring cost when forming a view on the business.
- Assess stock-based compensation in context. Check whether SBC is excluded and, if so, how large it is relative to revenue and total compensation expense. A company where SBC represents a significant share of total pay is excluding a real and ongoing economic cost.
- Compare GAAP and non-GAAP trends side by side. Plot both figures across four or more consecutive quarters. Diverging trends, where non-GAAP improves while GAAP deteriorates, warrant closer investigation into whether the adjustment scope is expanding.
- Evaluate the gap size in context. A 5-10% difference between GAAP and non-GAAP EPS at a company that recently completed an acquisition is analytically very different from a persistent 40-50% gap at a company with no major M&A activity.
- Read management’s explanation for each excluded item. Regulation G requires companies to explain why excluded items are not reflective of ongoing operations. Vague, boilerplate, or inconsistent explanations across periods are a warning sign.
Understanding both numbers is the real edge for retail investors
The documented pattern in earnings announcement research is consistent: retail investors tend to focus on the non-GAAP headline figure reported in press releases and financial media. Institutional investors conduct deeper analysis of GAAP results and reconciliation footnotes.
Institutional earnings analysis goes beyond the reconciliation table to include sector-specific metrics such as net revenue retention for SaaS companies, book-to-bill ratios for industrials, and loan loss provisions for banks, each of which can signal trajectory shifts that adjusted EPS figures are specifically designed to obscure.
This divergence creates short-term price dislocations. Retail-driven buying on a non-GAAP beat is sometimes followed by institutional selling once the full GAAP picture is absorbed. Intel’s Q3 2024 results illustrated this dynamic: the non-GAAP loss of $(0.46) per share offered a temporarily more favourable picture than the GAAP loss of $(3.88), and the stock experienced significant volatility as the full restructuring scale became apparent through deeper GAAP analysis.
Non-GAAP figures are not inherently manipulative. When adjustments are genuinely non-recurring and clearly disclosed, they can offer a more useful picture of underlying operational performance than the GAAP number alone. The problem arises when exclusions are habitual, growing, or poorly explained.
In a market where approximately 71% of S&P 500 companies publish two earnings numbers, the investor who understands both is operating with the full picture. The one who reads only the headline is operating with whichever half the company chose to lead with.
“Non-GAAP figures are management’s narrative. GAAP figures are the rulebook. Investors who read both are harder to mislead.”
The bottom line: one company, two numbers, your decision
Dual reporting is now the default across U.S. public markets. Non-GAAP figures can be useful or misleading depending entirely on the quality, consistency, and honesty of the adjustments behind them. The SEC’s reconciliation requirement gives every investor, regardless of experience, the tools to evaluate the difference.
The practical takeaway is three actions: always locate the reconciliation table, test exclusions for recurrence across multiple periods, and compare GAAP and non-GAAP trends together before drawing a conclusion. A significant gap between the two figures is not automatically a red flag or an endorsement. It is a question to investigate.
Beat source and cash flow quality are two of the four analytical layers that determine whether a headline result represents genuine improvement or a one-period outcome unlikely to persist, and tracking operating cash flow against net income across several consecutive quarters is one of the most reliable signals that adjusted earnings figures lack genuine cash backing.
This article is for informational purposes only and should not be considered financial advice. Investors should conduct their own research and consult with financial professionals before making investment decisions.