EUR/USD just did something its own analysts had ruled out. The pair broke convincingly below 1.1400, a level UOB had characterised as unlikely to sustain a downside break, then accelerated to an intraday low of 1.1358. That single breach is now the reason those same analysts are calling for range-bound consolidation rather than more selling.
As of 25 September 2026, EUR/USD trades at approximately 1.1391, coming off a two-week downtrend that has pushed it into what UOB’s Quek Ser Leang and Lee Sue Ann describe as deeply oversold conditions. Momentum has visibly slowed, but the broader technical structure remains negative, with moving averages, MACD, and multi-SMA configurations still pointing lower across several analyst dashboards.
What follows is a framework for reading this setup properly: what UOB’s projected 1.1355 to 1.1400 range actually means technically, why 1.1430 is the level that changes the near-term story, and how to interpret an oversold reading without assuming it automatically signals a reversal.
How EUR/USD broke into oversold territory, and why it matters that analysts were caught off-guard
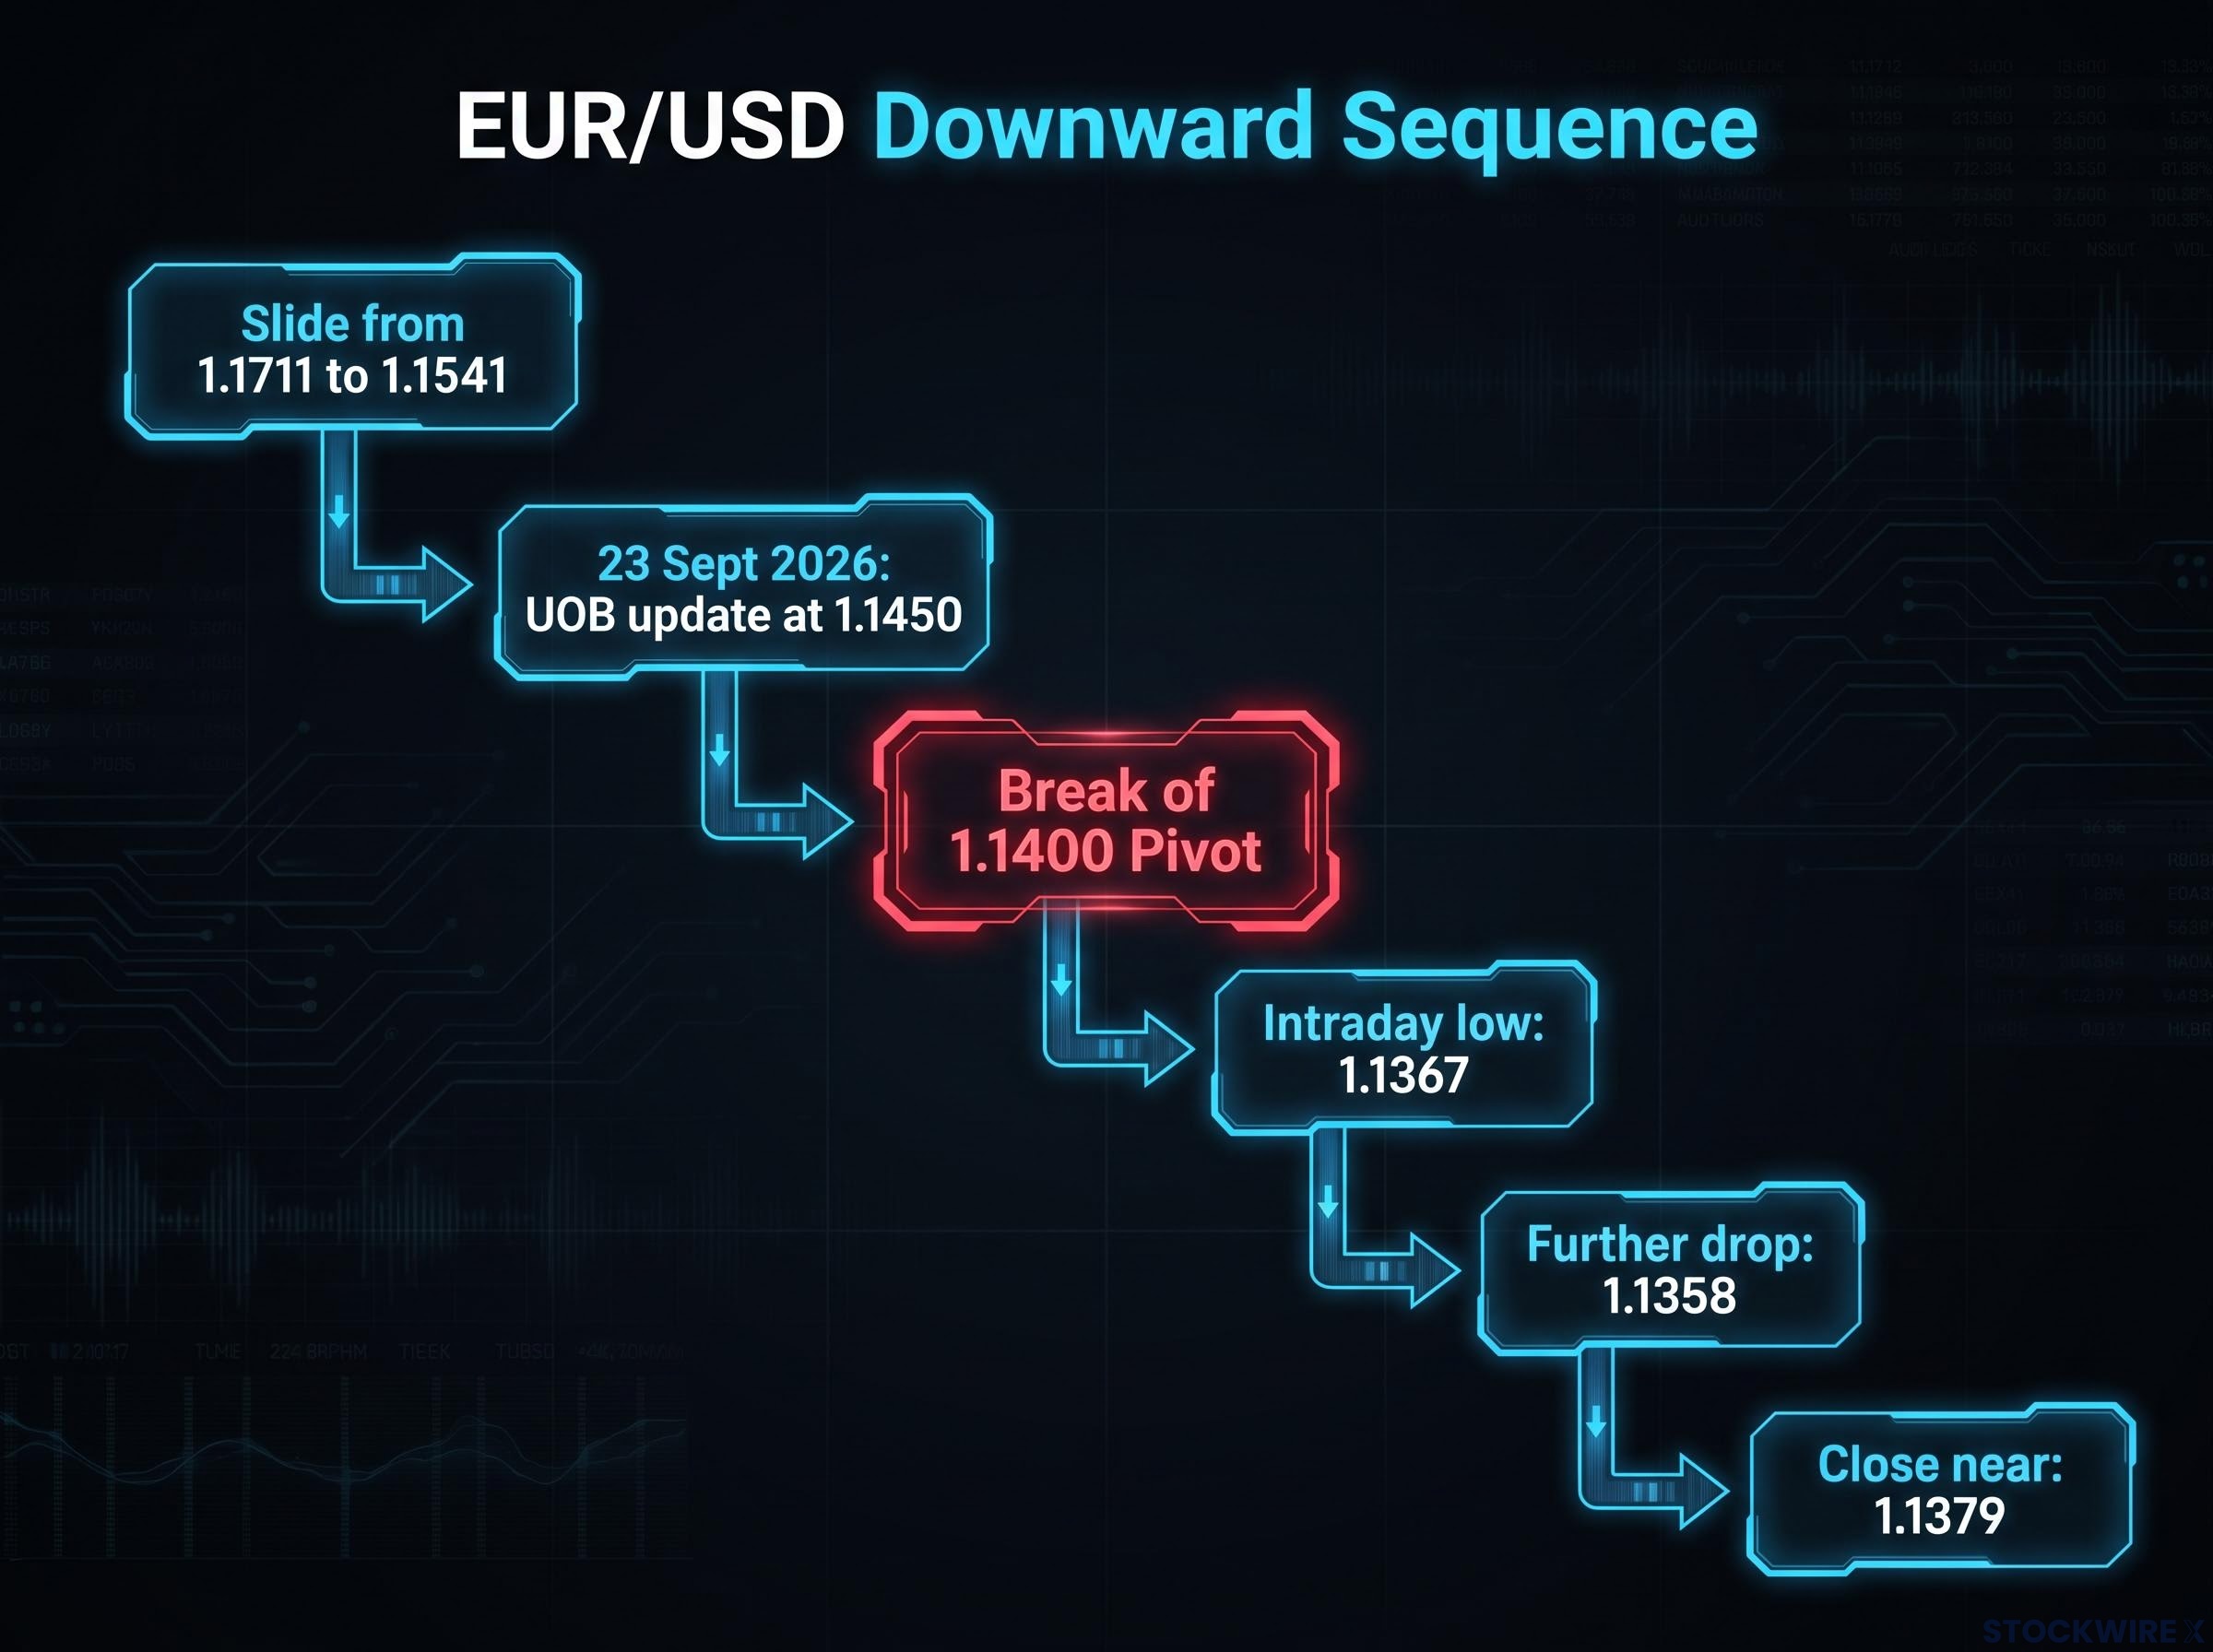
The move did not happen in a single session. According to DailyForex, EUR/USD had already slid from roughly 1.1711 to 1.1541 in recent weeks, a decline pinned on a stronger US dollar and rising oil prices. That set the stage for what came next.
By 23 September 2026, UOB reported the pair trading at 1.1450. Then the downtrend compressed. EUR/USD hit an intraday low of 1.1367, dropped further to 1.1358 the following session, and closed around 1.1379, a marginal daily loss.
Here is the sequence in one view:
- Slide from approximately 1.1711 to 1.1541 on USD strength and oil (DailyForex)
- 1.1450 at the prior UOB update, 23 September 2026
- Intraday low of 1.1367
- Further drop to 1.1358
- Close near 1.1379
The pivot was the break of 1.1400.
UOB’s earlier forecast had flagged a test of 1.1400 as possible but a sustained break below it as unlikely. The actual breach triggered an accelerated sell-off rather than a slow grind lower.
That invalidation matters more than the price itself. When a considered analyst consensus expects a level to hold and the market blows through it, the move carries genuine informational content: EUR/USD went faster and further than professional expectations allowed. That is precisely why the oversold characterisation now carries weight rather than reading as a routine dip.
The macro structure underneath is consistent with the breakdown. TMGM reports the pair sliding along the lower Bollinger band with a 14-day RSI of 36, still capped by the 100-day simple moving average (SMA) near 1.1545. Fortrade’s dashboard shows 20-, 50-, and 100-day SMAs plus MACD all flashing SELL signals.
The DXY technical structure in late September 2026, with price near 100.40-100.70 holding above its 20-day EMA and RSI at approximately 67.40, provides the dollar-side context that EUR/USD’s breakdown does not show in isolation; a structurally bid dollar creates a fundamentally different environment for range consolidation than a dollar simply catching a temporary bid.
For a trader, understanding this chain rather than just the current quote is what separates a useful signal from noise. The oversold reading is earned here. It is the product of a documented, multi-stage decline, not a single random shock, and that changes how much confidence you can place in the exhaustion thesis.
When big ASX news breaks, our subscribers know first
What UOB’s three key levels actually tell you about near-term price structure
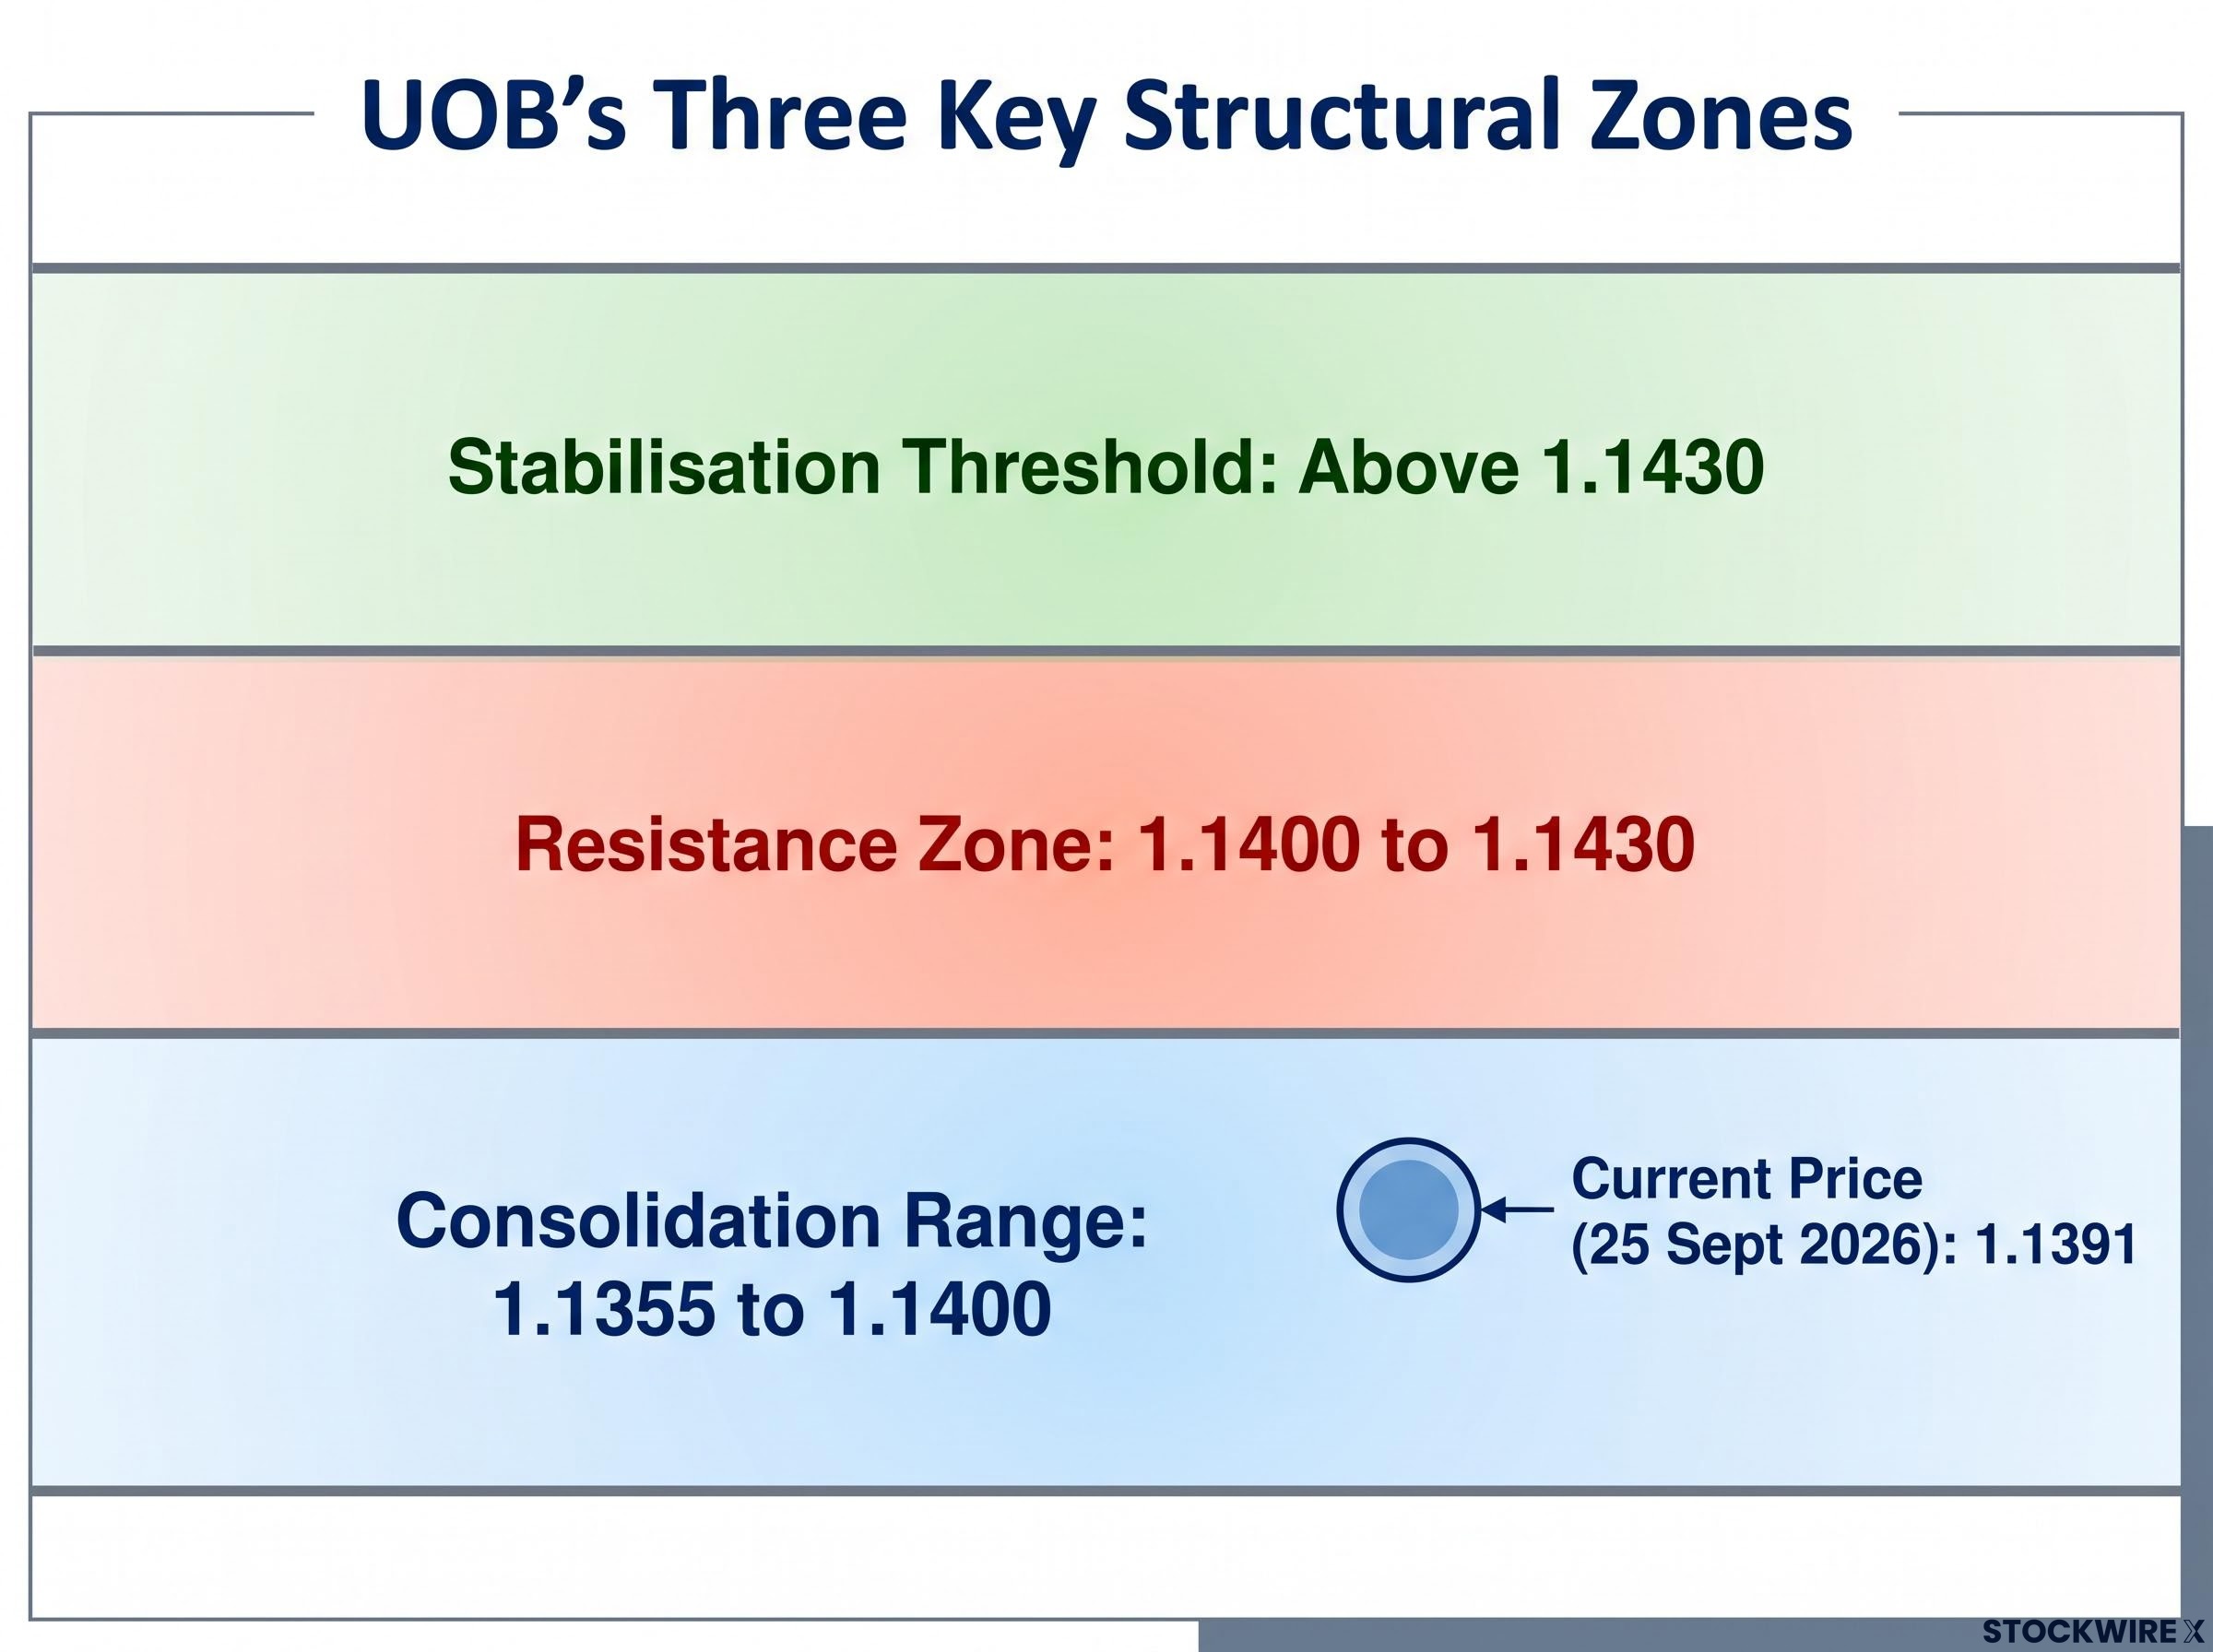
Not all levels on a chart do the same job. UOB’s framework separates EUR/USD’s near-term structure into three distinct zones, each with a different analytical function, and confusing them is where reader errors begin.
The first is the intraday trading range: 1.1355 to 1.1400. This is where UOB expects the pair to oscillate under its consolidation thesis. The second is the resistance zone, 1.1400 to 1.1430, the band the pair must reclaim to signal fading downside pressure. The third is the stabilisation threshold: a close above 1.1430 would indicate Euro weakness is genuinely stabilising.
That 1.1430 figure tells its own story. UOB had previously designated a stronger resistance at 1.1490. The downward revision to 1.1430 is a direct measure of how much the technical structure deteriorated during the downtrend; the ceiling has been lowered because the pair could no longer support the higher one.
| Level | Type | Source | Analytical significance |
|---|---|---|---|
| 1.1325 | Key support | UOB | Critical downside; a breach would mark a material shift in the technical picture |
| 1.1353 | Support | TMGM | 28 July low; breach exposes further negative momentum |
| 1.1355 | Support / range floor | UOB | Lower boundary of projected consolidation range |
| 1.1365 | Support cluster | StoneX | August-identified support, adding confluence near the range floor |
| 1.1400 | Range ceiling / resistance base | UOB | Upper boundary of range; start of the resistance zone |
| 1.1430 | Stabilisation threshold | UOB | A close above confirms Euro weakness is stabilising |
With EUR/USD at 1.1391 as of 25 September 2026, the pair sits squarely inside UOB’s projected 1.1355 to 1.1400 range. That is exactly where the consolidation thesis predicts it should be, which means the coming sessions offer a clean test of the range’s boundaries rather than an abstract forecast.
Independent confirmation from TMGM and StoneX
UOB’s levels do not stand alone, and that matters for how much you should trust them. TMGM’s downside targets sit at 1.1378 (14 July low) and 1.1353 (28 July low), price-structure marks derived independently of UOB’s framework. StoneX’s August work flagged a support cluster at 1.1365.
When three separate analytical processes converge on nearly the same price zone, the case strengthens considerably. These are not arbitrary projections drawn to fit a narrative. They are technically meaningful levels confirmed by multiple methodologies, which is what lets you frame entry, exit, and risk parameters around a coherent structural map rather than reacting to individual ticks.
Three frameworks for interpreting an oversold reading, and why the right one depends on context
An oversold reading is not a signal by itself. It is a condition that means different things depending on the structure it sits inside, and the analyst commentary on EUR/USD splits cleanly into three interpretive frameworks. Read them as a progression in sophistication, not a menu of equals.
- Mean-reversion. Oversold signals exhaustion, inviting profit-taking and a bounce. Diagnostic question: is downside momentum genuinely decelerating, or does it just feel stretched?
- Trend-following. Oversold can persist and deepen while a strong downtrend runs. Diagnostic question: are the moving averages and trend indicators still aligned against a bounce?
- Range-consolidation. Oversold is simply an oscillation within a larger structural pattern. Diagnostic question: is the pair inside a defined multi-month range where oversold readings recur without producing trend change?
The mean-reversion case draws on TMGM’s note that the Bollinger lower band near 1.1445 is where “sellers could start to take some profit on stretched intraday moves,” and on UOB’s view that deeply oversold conditions are constraining further Euro depreciation. Both point toward consolidation rather than continued selling.
The trend-following case draws on the opposite signals. TMGM stresses the pair “retains a negative tone below the 100-day SMA” with RSI at 36, and Fortrade’s all-SELL configuration across the 20-, 50-, and 100-day SMAs plus MACD reinforces that oversold can coexist with ongoing downside. TradingKey’s 4-hour chart from 14 September captures the ambiguity directly: an oversold Williams %R of 99.928 alongside a neutral RSI of 41.365 and a neutral MACD of -0.002.
The same diagnostic gap appears across major pairs in macro downtrends: GBP/USD’s mid-September 2026 setup showed an RSI failure swing absent at 31.9, which meant the oversold reading carried no standalone reversal signal even as the pair sat below three clustered moving averages.
The range-consolidation case belongs to StoneX.
StoneX frames EUR/USD as still potentially inside a massive multi-month consolidation pattern, where guidance comes from breaks of the range rather than from isolated oversold readings.
Here is the distinction that resolves the apparent conflict. UOB calls the pair “deeply oversold” while TMGM calls RSI 36 “just above oversold territory.” That is not a contradiction. It reflects different timeframes and indicator methodologies, and knowing which one matches your own analytical horizon is the whole point.
What you should take from this is a diagnostic discipline. Before applying any oversold narrative, ask which framework the current structure actually supports, rather than defaulting to whichever reading confirms a trade you already want to make. Misapplying mean-reversion inside a live downtrend is one of the most consistent ways to lose money in FX technical trading.
What the research says about applying oversold signals practically, including where analysts identify the real pitfalls
The gap between understanding a setup and knowing whether to act on it comes down to what experienced analysts do differently. Three habits stand out across the commentary.
The first is confluence. StoneX does not act on a single reading; it stacks them. Its identification of resistance at 1.1635, where former support turned resistance overlaps with the 200-day SMA, is a deliberate search for multiple technical factors aligning before treating a level as actionable.
The second is using oversold for risk management rather than as an entry trigger.
TMGM frames support near the Bollinger lower band around 1.1445 as a level where sellers could take profit on existing shorts, not as a signal to buy.
That inverts the assumption most readers bring to an oversold chart. StoneX applies the same discipline from the other direction, noting that “losses would need to be limited to 1.1472 IF Euro is heading higher on this stretch,” defining a concrete cut-loss point around structure.
The third is respecting event risk. Both StoneX and DailyForex flag scheduled macro catalysts as capable of overriding technical range conditions entirely. DailyForex identifies a symmetrical triangle ahead of US CPI, with a bullish breakout target at the August high of 1.1710, a reminder that a single data release can dissolve a clean range.
The four pitfalls analyst commentary identifies most consistently
Distilled from the same commentary, four errors recur:
- Treating oversold as an automatic reversal signal while the broader trend and moving averages remain negative.
- Entering trades on oversold readings without accounting for scheduled catalysts such as Fed meetings and CPI.
- Relying on a single oscillator (an oversold Williams %R while RSI and MACD stay neutral) as a standalone entry trigger.
- Treating oversold in a strong downtrend as structurally equivalent to oversold in a confirmed range.
For anyone currently positioned in EUR/USD or considering a trade on the oversold condition, the first question is not “is it oversold?” It is “what event risk sits between now and my exit?” UOB’s 1.1325 support is the level that would mark a material shift if breached, and that is the number worth watching more closely than any single oscillator.
What confirms or breaks the range-bound thesis from here
The range thesis is not a prediction. It is a conditional framework with defined invalidation levels, and the next few sessions carry more information than the current oversold reading on any single oscillator.
Three outcomes define the map:
- Holds the range (1.1355 to 1.1400 maintained): confirms UOB’s consolidation thesis and suggests the oversold condition reflected exhaustion rather than the early phase of a deeper decline.
- Breaks lower (below 1.1355 toward 1.1325 or 1.1353): a breach of TMGM’s 28 July low at 1.1353 would expose further negative momentum, and a move under UOB’s 1.1325 would signal a material technical shift.
- Breaks higher (close above 1.1430): signals that Euro weakness is stabilising and the downtrend is losing its grip.
The catalysts capable of resolving the binary are macro, not technical. StoneX flags the Fed meeting as a potential trigger for a sharp directional break out of the September range. DailyForex sets a bullish CPI target at the August high of 1.1710 and a bearish continuation toward the mid-1.13s if the USD and oil shock persists.
Macro catalysts in currency markets, including ECB guidance language, Fed rate signals, and CPI sequencing, can override technically clean range conditions in a single session; knowing how to read those events before the announcement, rather than reacting after the fact, is what determines whether a technical framework survives the week.
UOB’s read is that a close above 1.1430 would confirm Euro weakness is stabilising, the clearest single upside benchmark to watch.
For the reader, that turns an abstract analyst call into a monitoring framework. Treat the next close above 1.1430 or below 1.1355 as more informative about where EUR/USD is headed than any individual oscillator reading today.
This article is for informational purposes only and should not be considered financial advice. Investors should conduct their own research and consult with financial professionals before making investment decisions. Past performance does not guarantee future results, and these technical scenarios are speculative and subject to change based on market developments.
Reading the range thesis with the calibration it deserves
The core finding holds together. UOB’s range-bound thesis is analytically coherent and backed by multi-source confluence from TMGM and StoneX at nearly identical price zones. But it rests entirely on the pair holding 1.1355, an assumption that carries identifiable event risk from the Fed and US CPI.
The layered lesson across this analysis is simple: oversold conditions alone do not determine outcome. Structural levels and macro catalysts together define what an oversold reading is actually worth. Two benchmarks now matter more than any oscillator, 1.1325 to the downside and 1.1430 to the upside, and EUR/USD’s next meaningful move will be defined by which of them is tested first.
For readers wanting to situate this EUR/USD setup inside the broader dollar cycle, our full explainer on dollar cycle chart patterns examines how EUR/USD, GBP/USD, USD/JPY, and USD/CNY are simultaneously compressing into shared inflection patterns that suggest the next major dollar move will affect all major pairs together.