Why 30% Recession Odds Are Harder to Trade Than 60%
1 hr ago

Westpac posted A$3.4 billion in statutory net profit for H1 FY26 and grew its loan book by 7%, yet the share price sits roughly 20% above the median analyst price target of A$30.80. That gap between a solid half-year result and a stretched valuation is where the analytical work begins. The result lands in a rate environment that should, in theory, favour big-bank earnings. The RBA has pushed the cash rate to 4.35%, effective 5 May 2026. But not every bank captures the tailwind equally, and Westpac’s balance sheet composition shapes how much of the rate cycle translates into durable profit. What follows is an examination of what Westpac’s H1 FY26 numbers reveal about the quality of its earnings, not just their size, and what 69% mortgage concentration means for investors weighing the stock at current levels.
The headline numbers from Westpac’s H1 FY26 result look reasonable in isolation:
The tension sits in what those numbers say when read together. Lending grew 7%, deposits grew 7%, and pre-provision profit rose 4%, yet statutory net profit still fell 5%.
Pre-provision profit rising 4% while statutory net profit falls 5% signals that volume growth is being absorbed by provisioning and margin dynamics before it reaches the bottom line.
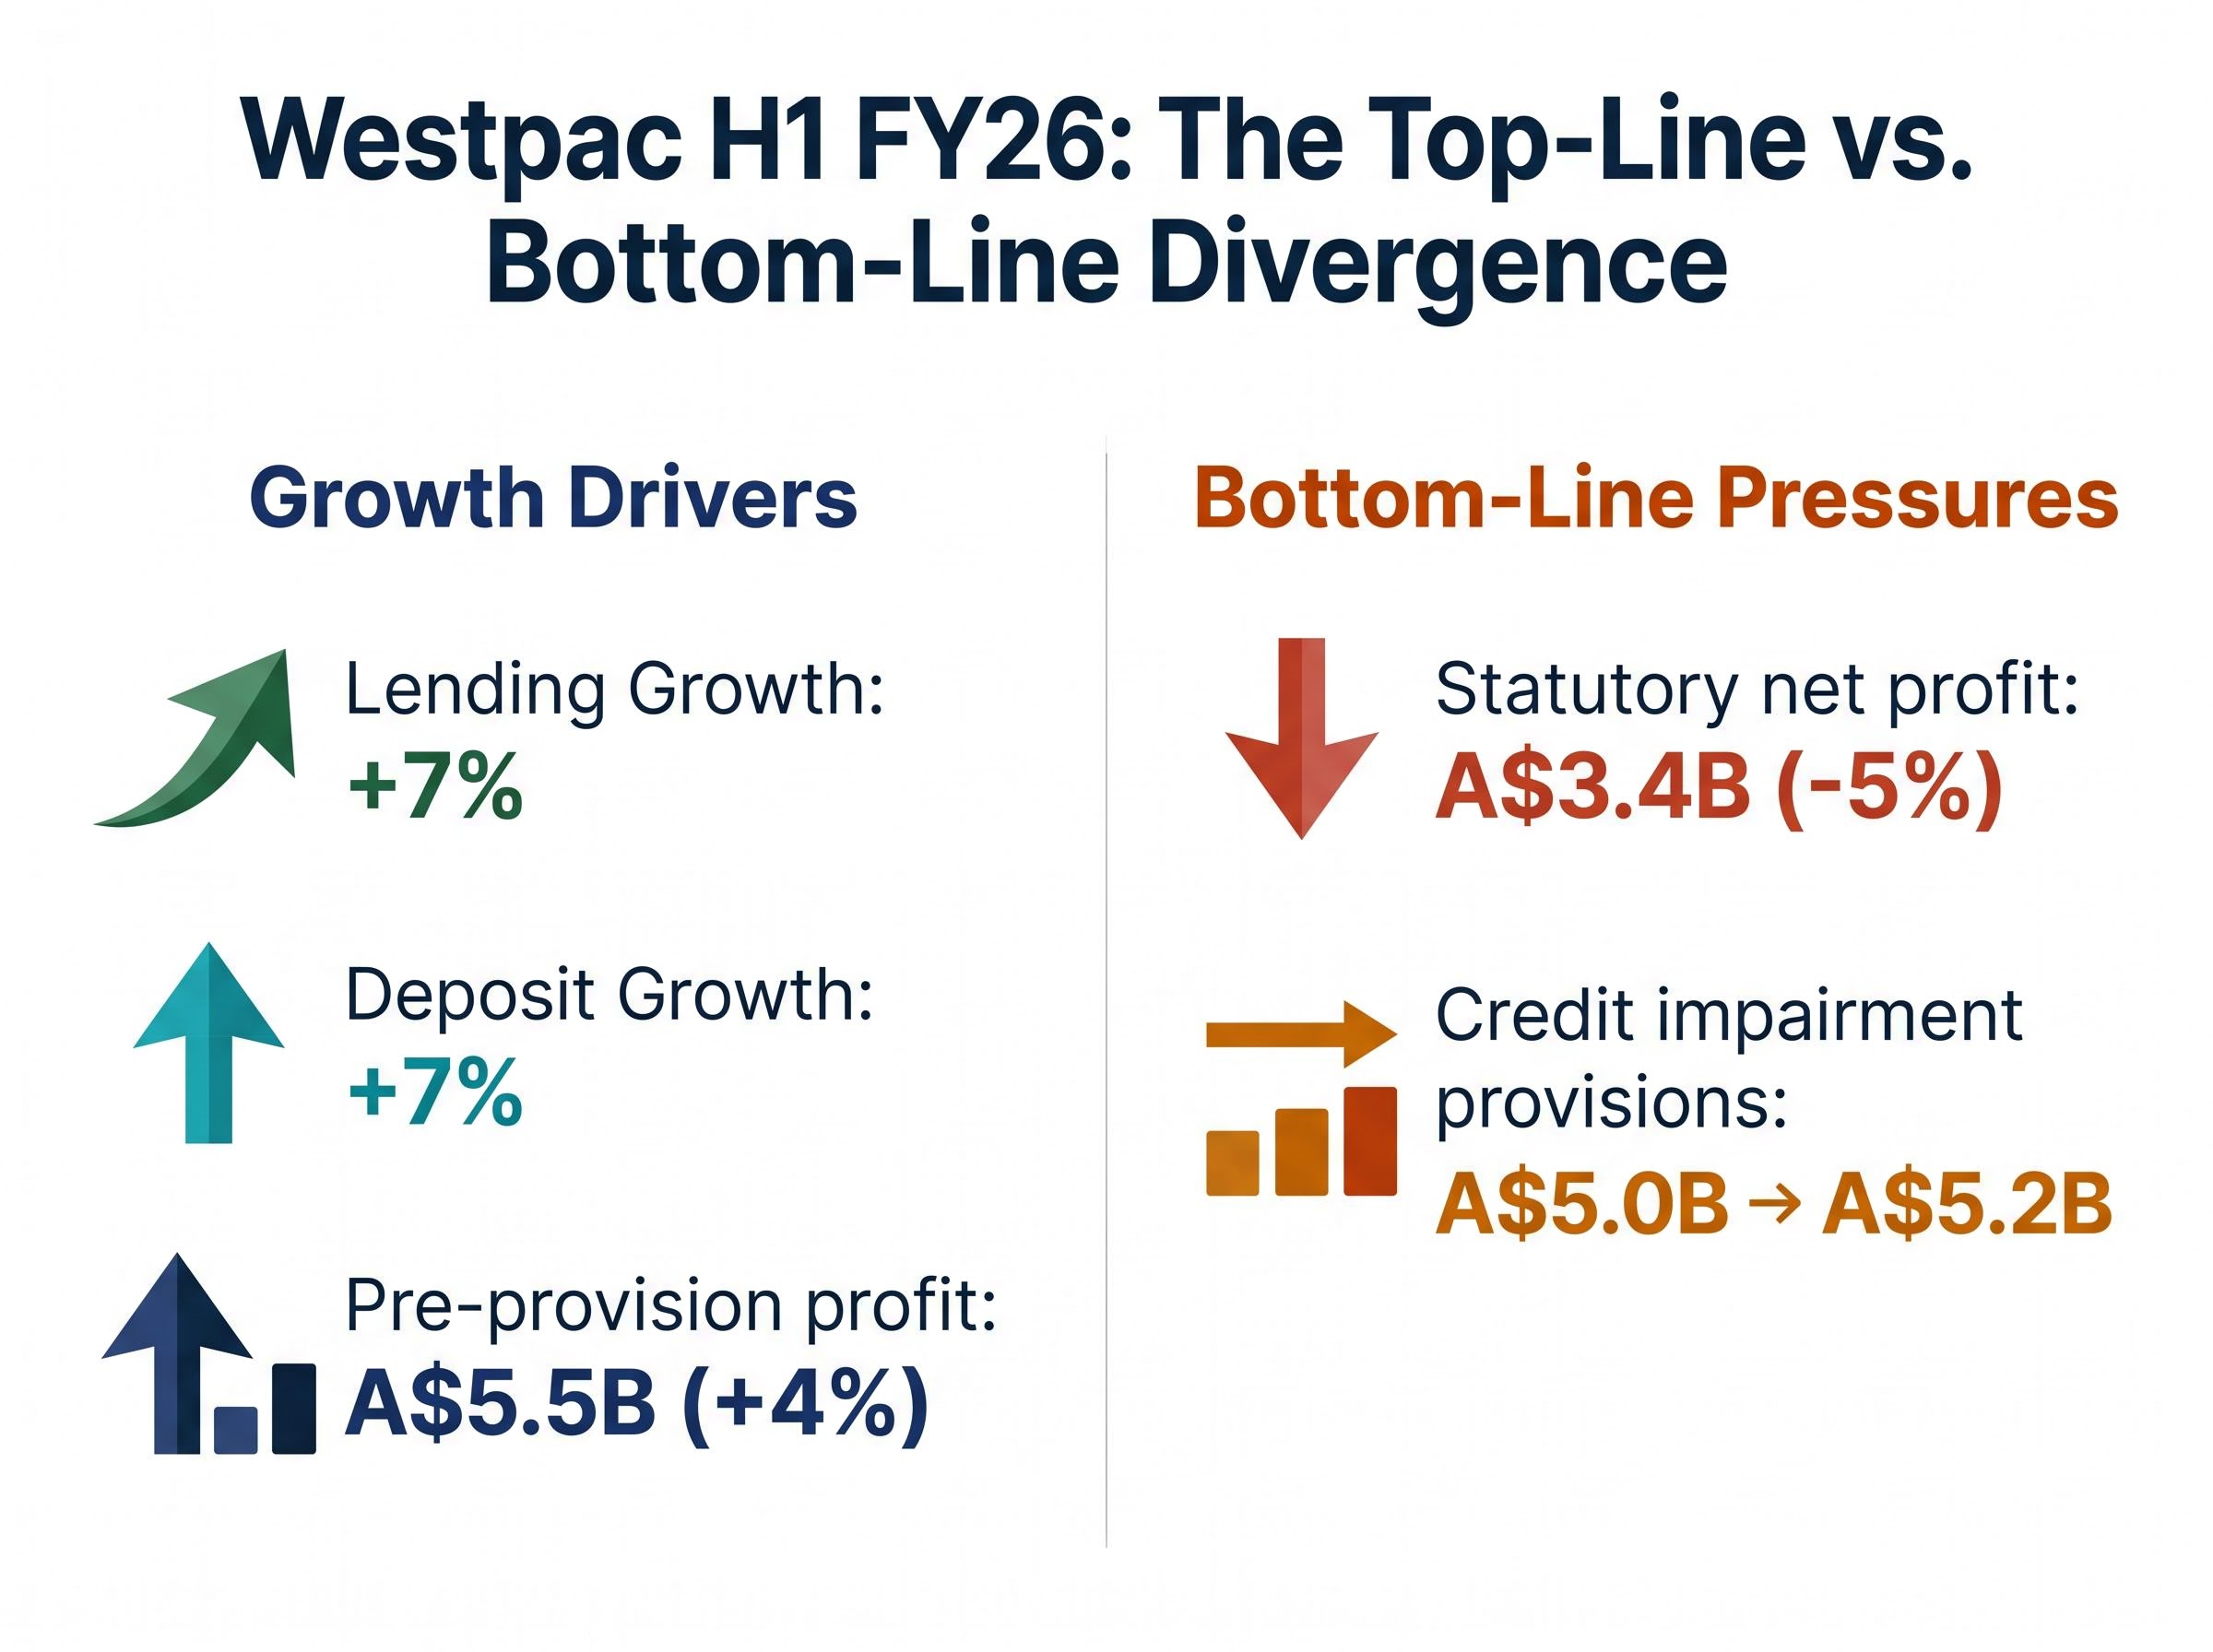
That directional divergence matters. Credit impairment provisions climbing from A$5.0 billion to A$5.2 billion suggests management is quietly building buffers rather than harvesting margin. For investors using headline profit as a health check, the gap between top-line momentum and bottom-line delivery tells a more instructive story about where this bank’s earnings actually stand.
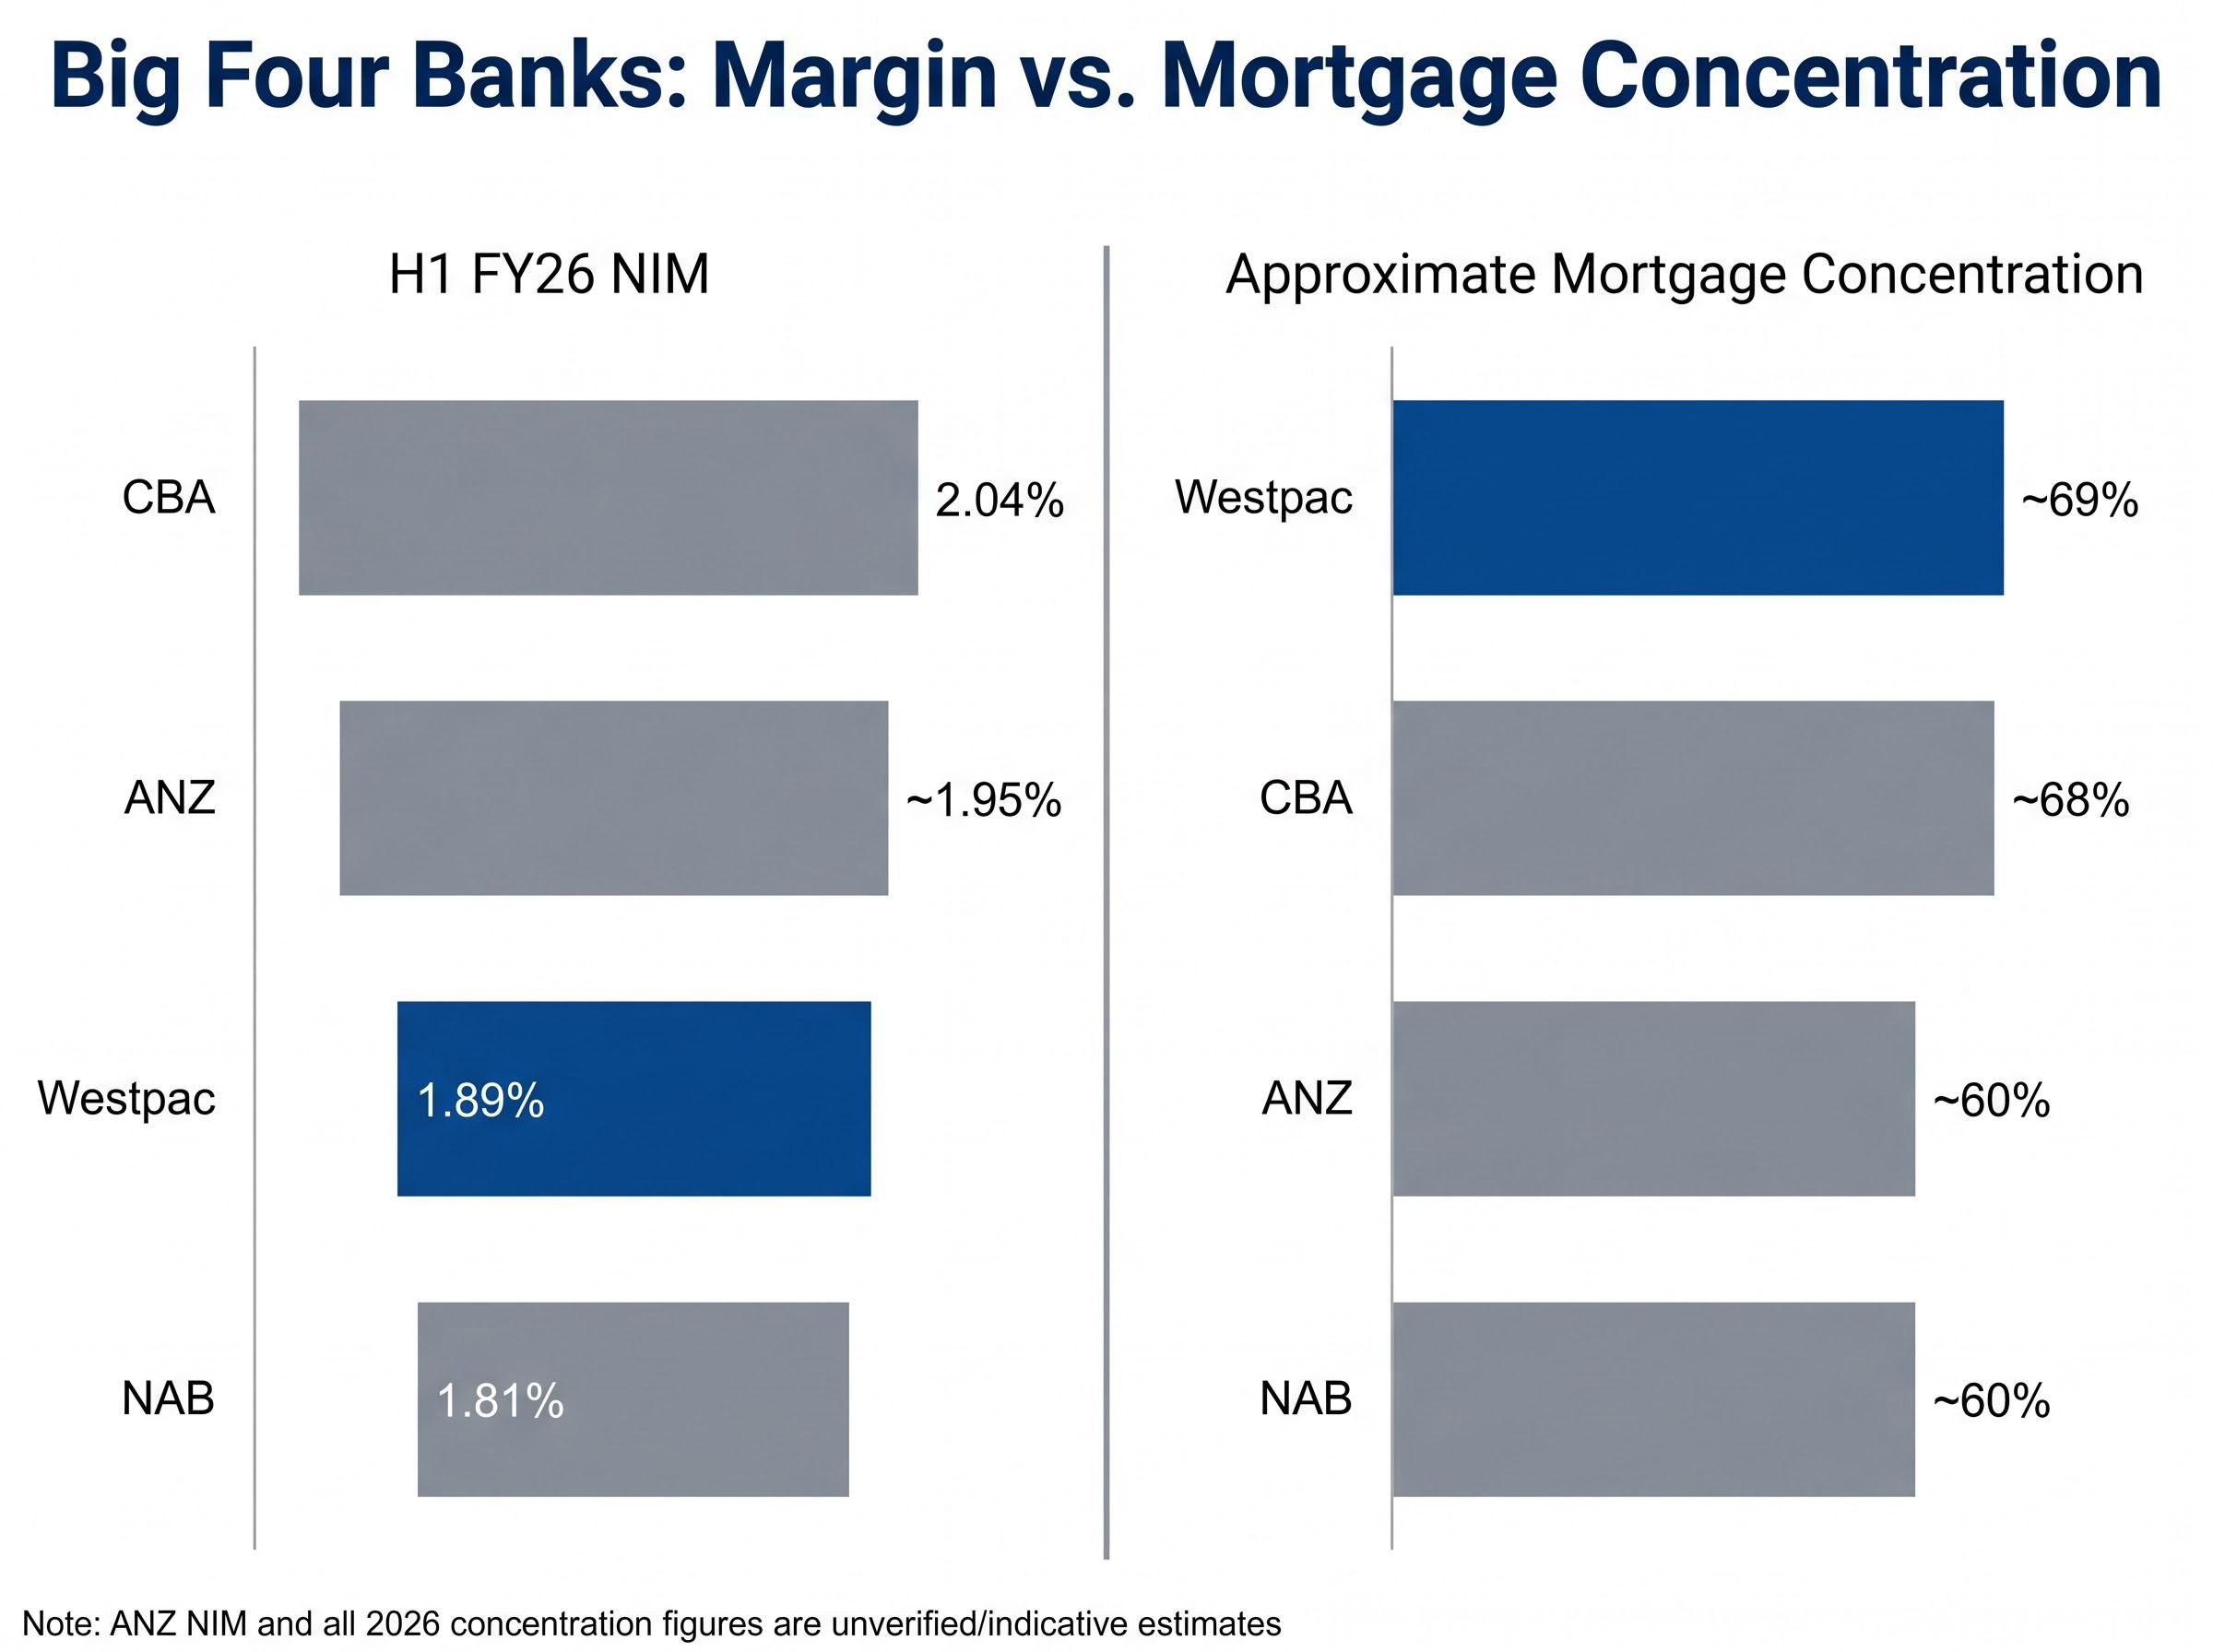
Westpac reported a net interest margin of 1.89% for H1 FY26, down 6 basis points from 2H FY25. The peer comparison tells its own story.
| Bank | H1 FY26 NIM | Change on prior period |
|---|---|---|
| CBA | 2.04% | Not disclosed |
| Westpac | 1.89% | Down 6 bps |
| ANZ* | ~1.95% | Flat (reported) |
| NAB | 1.81% | Up 3 bps |
*ANZ figure is unverified and should be treated as indicative only.
Net interest margin, the difference between what a bank earns on loans and pays on deposits, is the most direct expression of a bank’s profitability engine. Westpac’s mid-pack position clarifies something important: in a rising-rate environment, funding costs are climbing faster than the bank can reprice its loan book.
That partially negates the tailwind investors might expect from a 4.35% cash rate. CBA captures more margin at 2.04%. NAB is leaner at 1.81% but trending upward. Westpac sits between them, neither the sector’s margin leader nor its weakest link, which is precisely why the rate cycle alone does not explain the stock’s premium.
The 4.35% cash rate did not arrive in isolation: it is the product of the third consecutive RBA tightening, with eight of nine Board members voting for the May 2026 move and all four inflation measures still sitting above the 2-3% target band, leaving the July meeting live as a potential fourth hike.
When 69 cents of every dollar a bank lends is tied to residential mortgages, the revenue stream, credit quality, and provisioning behaviour all become heavily correlated with one asset class in one geography. That is Westpac’s position.
| Bank | Approximate residential mortgage concentration |
|---|---|
| Westpac | ~69% |
| CBA | ~68% |
| ANZ | ~60% |
| NAB | ~60% |
Note: Peer concentration figures are unverified estimates for 2026.
The distinction that matters here is between earnings size and earnings quality. A loan book diversified across business lending and residential mortgages produces revenue streams with lower correlation to a single economic variable. A mortgage-heavy book concentrates both the upside and the downside into a single scenario set: Australian house prices, employment, and household debt serviceability.
Macquarie Equities noted on 7 May 2026 that Westpac’s approximately 69% concentration exposes the bank to “modest stress” if unemployment rises above 4.5%.
J.P. Morgan, on 8 May 2026, characterised credit risk as “contained.” The two assessments are not contradictory. They reflect different time horizons. Credit risk is contained today. The question is whether the earnings stream remains stable under less favourable conditions.
The primary mitigant analysts cite for Westpac’s concentration is the low loan-to-value ratio (LVR) composition of the book, meaning most loans carry meaningful equity buffers beneath them. Analyst commentary has referenced a figure suggesting roughly 85% of the book sits below 80% LVR, though this specific breakdown could not be independently verified against Westpac’s disclosures.
Low LVRs reduce the severity of loss in a property correction. They do not protect against volume-driven arrears rises. If unemployment moves materially higher, borrowers struggle with repayments regardless of how much equity sits in their homes. That is the scenario threshold Macquarie flagged, and it remains the structural vulnerability that low LVRs alone cannot close.
RBA research on Australian household debt resilience found that moderate loan-to-valuation ratios provide meaningful insulation against system-wide losses in a property downturn, but that the same buffers do not prevent arrears from rising when unemployment moves materially higher, precisely the distinction the low-LVR argument requires investors to hold.
The housing data feeding into Westpac’s mortgage book paints a picture of near-term strength with conditional fragility:
Rising collateral values reduce effective LVRs over time, strengthening the bank’s mortgage book on paper. Tight rental markets support borrower income capacity by keeping investment property cash flows stable. Both dynamics currently work in Westpac’s favour.
An extended rate plateau rather than a single-hike cycle is the scenario that reshapes Westpac’s NIM trajectory most significantly: Westpac’s own economists projected a further path to 4.85% by August 2026, which would sustain asset repricing tailwinds but also amplify household debt serviceability pressure on the mortgage book that represents 69% of the loan portfolio.
SQM Research national vacancy data for April 2026 recorded a national rental vacancy rate of 1.0%, described as the tightest in approximately 12 months, a supply constraint that supports investor borrower cash flows and reinforces the near-term stability assumption embedded in Westpac’s provisioning posture.
Commentary attributed to the AFR’s Chanticleer column on 9 May 2026 characterised the mortgage concentration as “a strength in boom times, vulnerability if prices correct 10%.” (Note: this source could not be independently verified.)
That framing captures the asymmetry investors need to hold. For a bank with 69% mortgage exposure, housing market conditions are not background noise. They are the operating environment that determines whether concentration is a structural advantage or a structural liability in any given 12-month window.
Westpac’s capital position provides a genuine cushion, though it answers a different question from the one posed by earnings concentration:
The RBA/APRA joint statement from April 2026 retained a neutral macroprudential stance with no counter-cyclical buffer hike, while APRA flagged ongoing monitoring of concentration in owner-occupier loans.
That monitoring language is not a warning. It is a signal that the regulator is watching the same concentration dynamic this analysis has examined. No new residential mortgage concentration limits have been imposed, and the serviceability buffer remains at 3%.
For investors assessing downside scenarios, the CET1 buffer is the metric that shows how much credit loss absorption capacity Westpac holds before regulatory capital thresholds constrain dividends or operations. The buffer is meaningful. It does not, however, resolve whether the earnings themselves are durable; it simply ensures the bank can absorb the answer if they are not.
The post-result analyst landscape reflects genuine disagreement about what Westpac’s balance sheet is worth.
The broker range from $26 to $34 illustrates a broader pattern in ASX banking analysis: the macro assumptions driving bank valuations, particularly on unemployment, property prices, and the rate path, produce wider valuation spreads than any single set of earnings metrics can resolve, and the same loan book can look cheap or expensive depending entirely on which scenario the analyst anchors to.
| Broker | Rating | Price target (A$) | Date | Key rationale |
|---|---|---|---|---|
| Citi | Buy | $34 | 6 May 2026 | Resilient deposit franchise |
| Goldman Sachs | Sell | $26 | 7 May 2026 | NIM compression, mortgage risk |
| UBS | Hold | $31 | 9 May 2026 | Balanced risk-reward |
| Morningstar | Fair value | $32.50 | 10 May 2026 | Intrinsic value assessment |
Note: Analyst price targets and consensus figures are indicative pending live verification.
Reported consensus from Morningstar Direct as of 11 May 2026 places the median 12-month target at A$30.80 with a Hold rating (12 Buy, 8 Hold, 4 Sell). Westpac’s share price of approximately A$37.12 sits roughly 20% above that median. CLSA, on 8 May 2026, viewed the position as “defensible” given approximately 60% of variable-rate loans are hedged.
The structural question the divergence reflects is whether Westpac’s mortgage-heavy balance sheet represents a quality asset in the current housing environment, or a concentration risk priced too optimistically. Two frames exist for the investor decision:
The result does not resolve the question. It clarifies the terms on which the question should be asked.
Westpac’s H1 FY26 result is solid but structurally dependent. Scale advantages in a rising-rate environment are partially offset by the earnings sensitivity that comes with 69% mortgage concentration. Pre-provision profit grew. Statutory profit did not. The margin is mid-pack, not leading.
The distinction between earnings size and earnings quality is the frame investors should carry into subsequent results. The forward indicators that will determine whether concentration proves a strength or a vulnerability in H2 FY26 are specific: the unemployment trajectory, housing price momentum, and APRA’s posture on concentration monitoring.
Investors holding ASX 200 index funds or superannuation with domestic equity bias face concentration risk within index portfolios that compounds the stock-level issue: the four major banks represent approximately 25% of the entire index, meaning a valuation reset in financials would remove the index’s primary structural support at exactly the moment Westpac-specific stress is most visible.
The numbers tell investors what Westpac earned. The loan book composition tells them how much of that is repeatable.
This article is for informational purposes only and should not be considered financial advice. Investors should conduct their own research and consult with financial professionals before making investment decisions. Past performance does not guarantee future results. Analyst price targets and consensus figures cited are indicative and subject to change based on market developments.
Net interest margin (NIM) is the difference between what a bank earns on loans and pays on deposits, and it is the most direct measure of a bank's profitability engine. Westpac reported a NIM of 1.89% for H1 FY26, down 6 basis points from the prior period, placing it in the middle of the big-four pack behind CBA at 2.04%.
Westpac's statutory net profit fell 5% even though lending and deposits both grew 7%, because rising credit impairment provisions (up from A$5.0 billion to A$5.2 billion) and margin compression absorbed the volume growth before it reached the bottom line.
With 69 cents of every lending dollar tied to residential mortgages, Westpac's revenue, credit quality, and provisioning are all heavily correlated with Australian house prices, employment, and household debt serviceability. Macquarie Equities noted this exposes the bank to modest stress if unemployment rises above 4.5%.
A higher cash rate can boost bank margins, but Westpac's NIM actually fell 6 basis points in H1 FY26, suggesting funding costs are rising faster than the bank can reprice its loan book, which partially offsets the tailwind investors might expect from a 4.35% cash rate.
Westpac reported a CET1 ratio of 12.42% as of 31 March 2026, sitting approximately 120 basis points above the APRA minimum target of around 11.25%, providing a meaningful buffer to absorb credit losses without triggering regulatory constraints on dividends or operations.