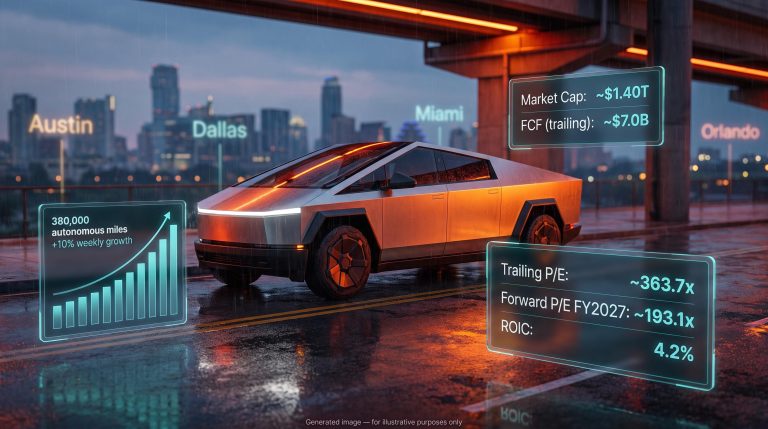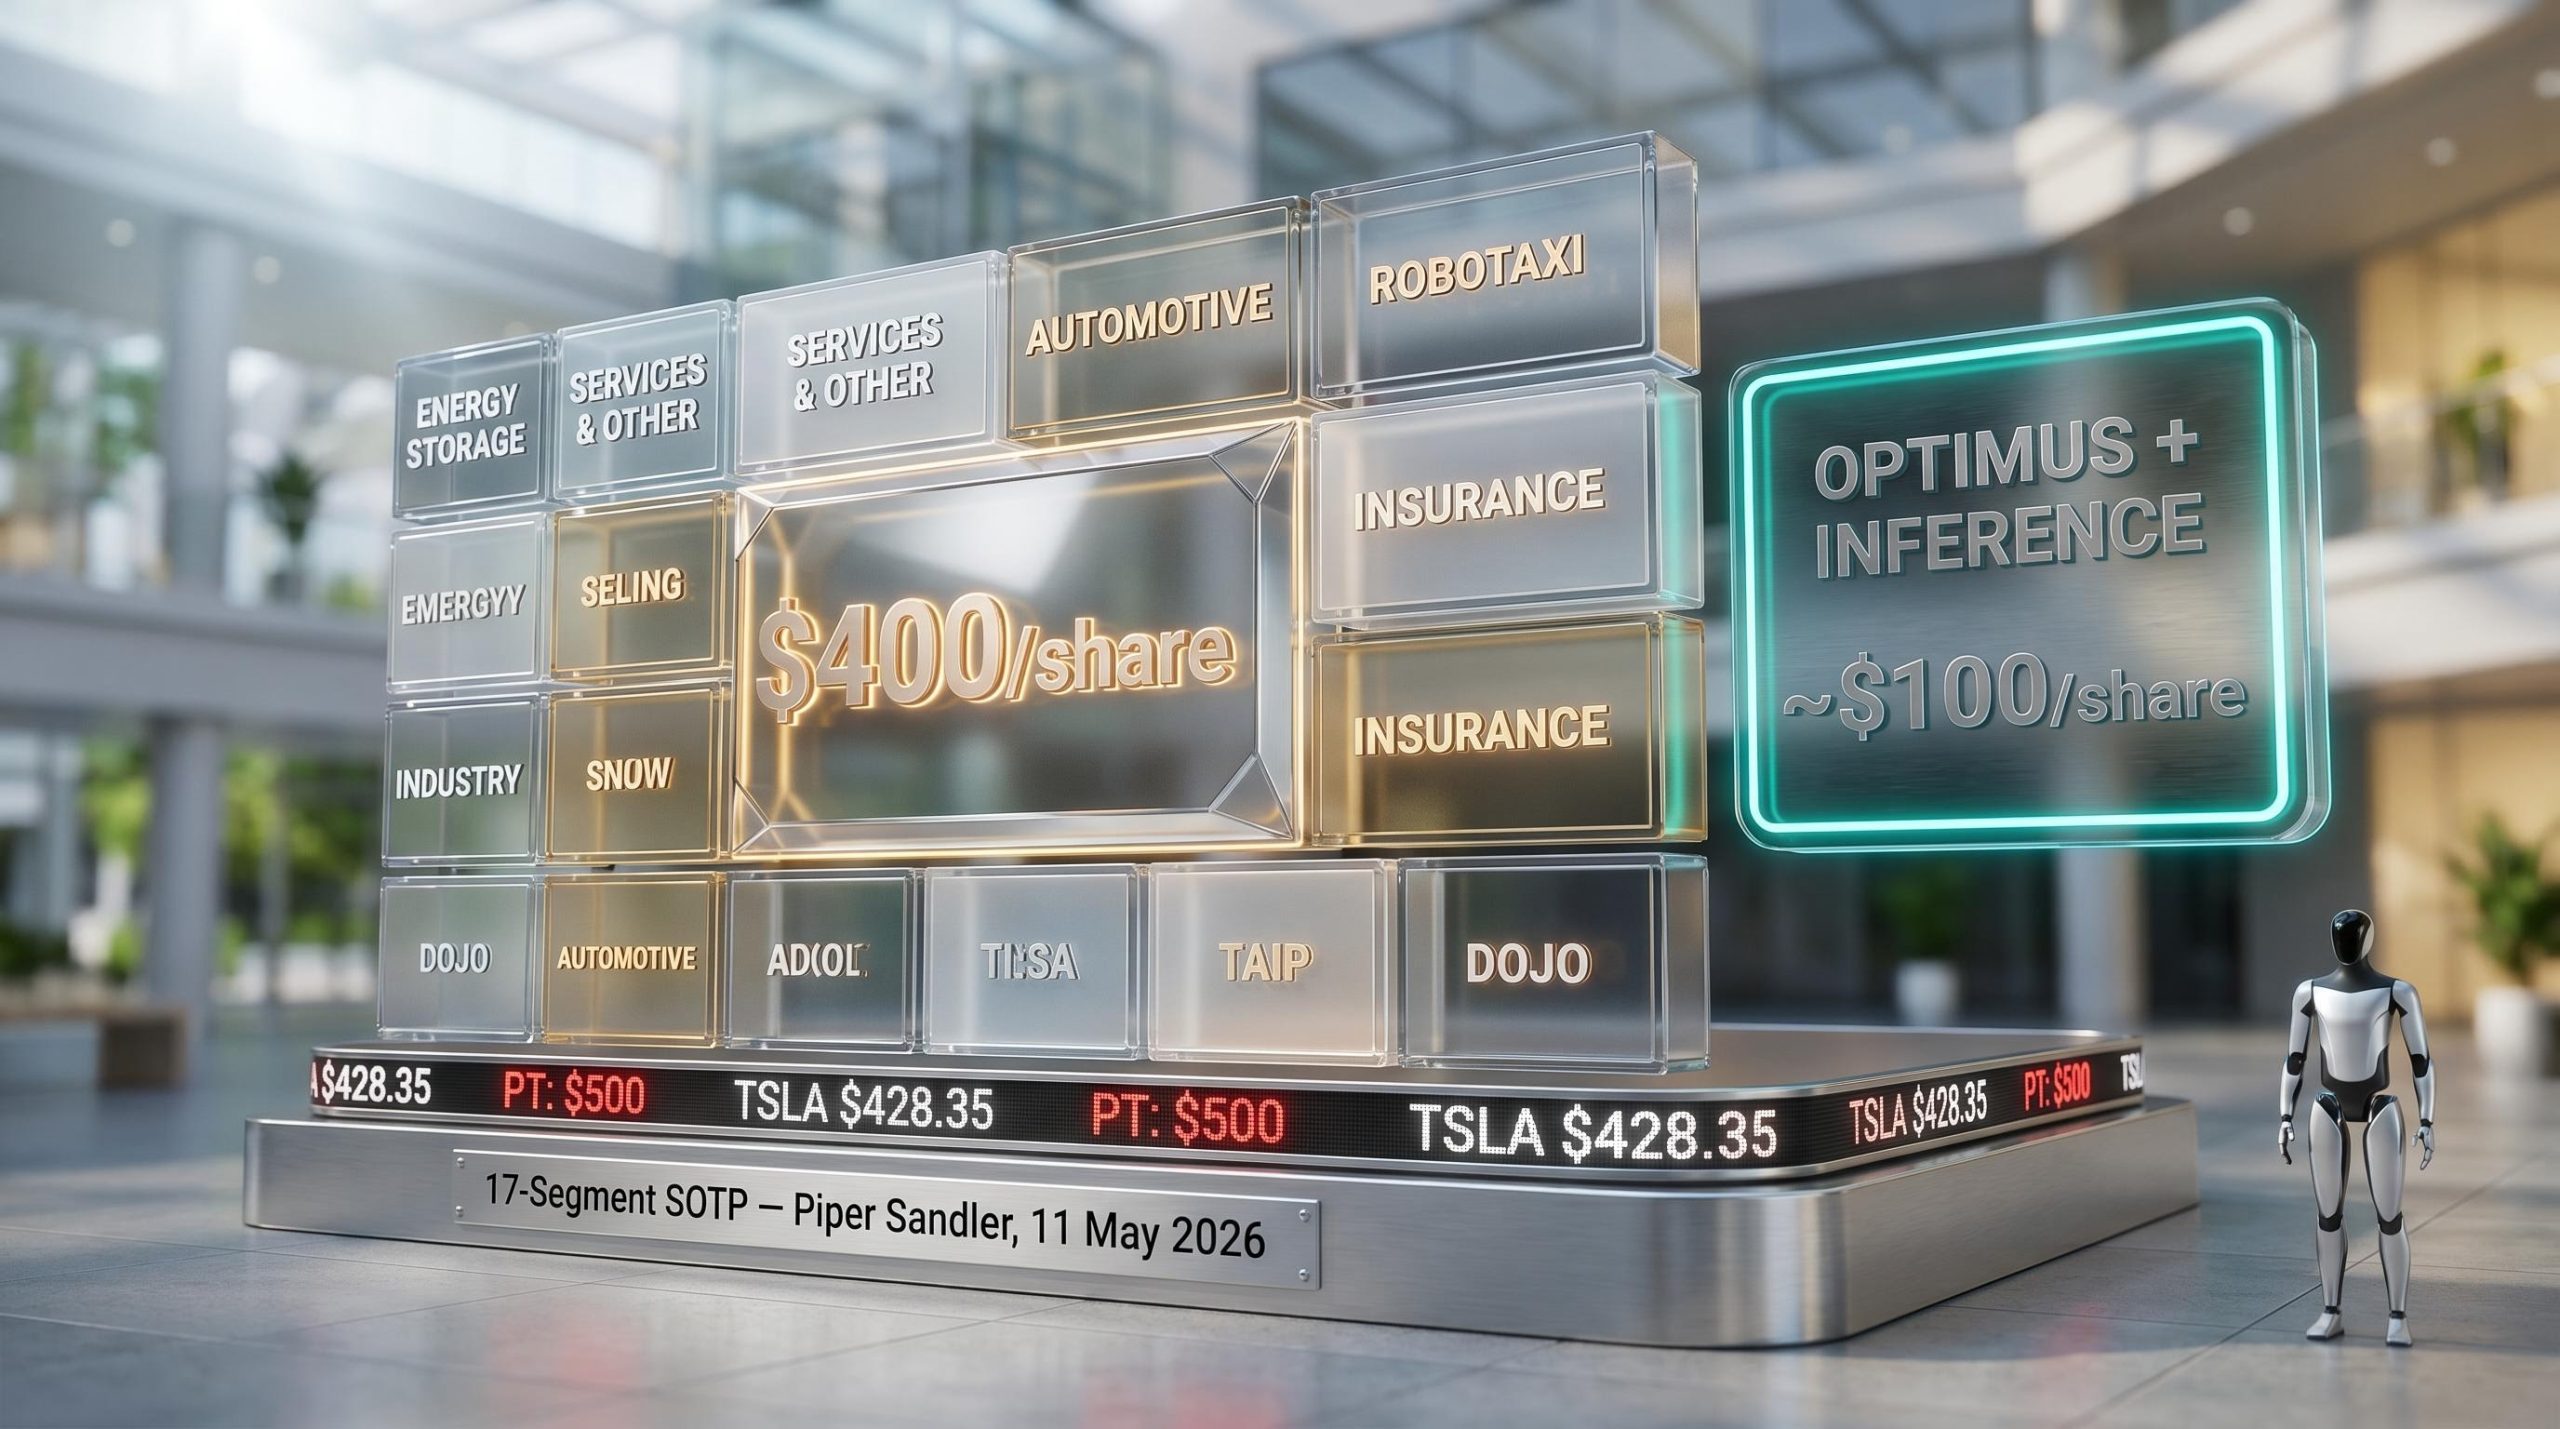
Piper Sandler‘s Alexander Potter published what the firm describes as its most comprehensive Tesla valuation framework to date on 11 May 2026, and the conclusion is striking. By assigning explicit valuations to 17 distinct business segments, Potter’s updated model arrives at approximately $400 per share before accounting for the Optimus humanoid robot division or inference-as-a-service. With TSLA closing at $428.35, the arithmetic implies investors are acquiring those two segments for next to nothing. The $500 price target that accompanies the note suggests roughly 17% upside, yet Potter’s own language frames that figure as conservative. What follows is a breakdown of the model’s construction, the implied Optimus bet, how it compares to competitor valuations and rival analyst estimates, and what the numbers mean for investors evaluating Tesla stock valuation at current levels.
Inside Potter’s 17-segment framework: why Optimus sits outside the $400 sum
Most Wall Street models treat Tesla as two or three businesses. Potter’s updated framework treats it as 17. The segments span the full breadth of Tesla’s commercial footprint:
- Core automotive manufacturing and sales
- Full Self-Driving (FSD) software subscriptions
- Robotaxi (modelled separately from FSD)
- Supercharger network infrastructure
- Proprietary insurance operations
- Energy generation and storage
- CEO compensation plan dilution (included for the first time)
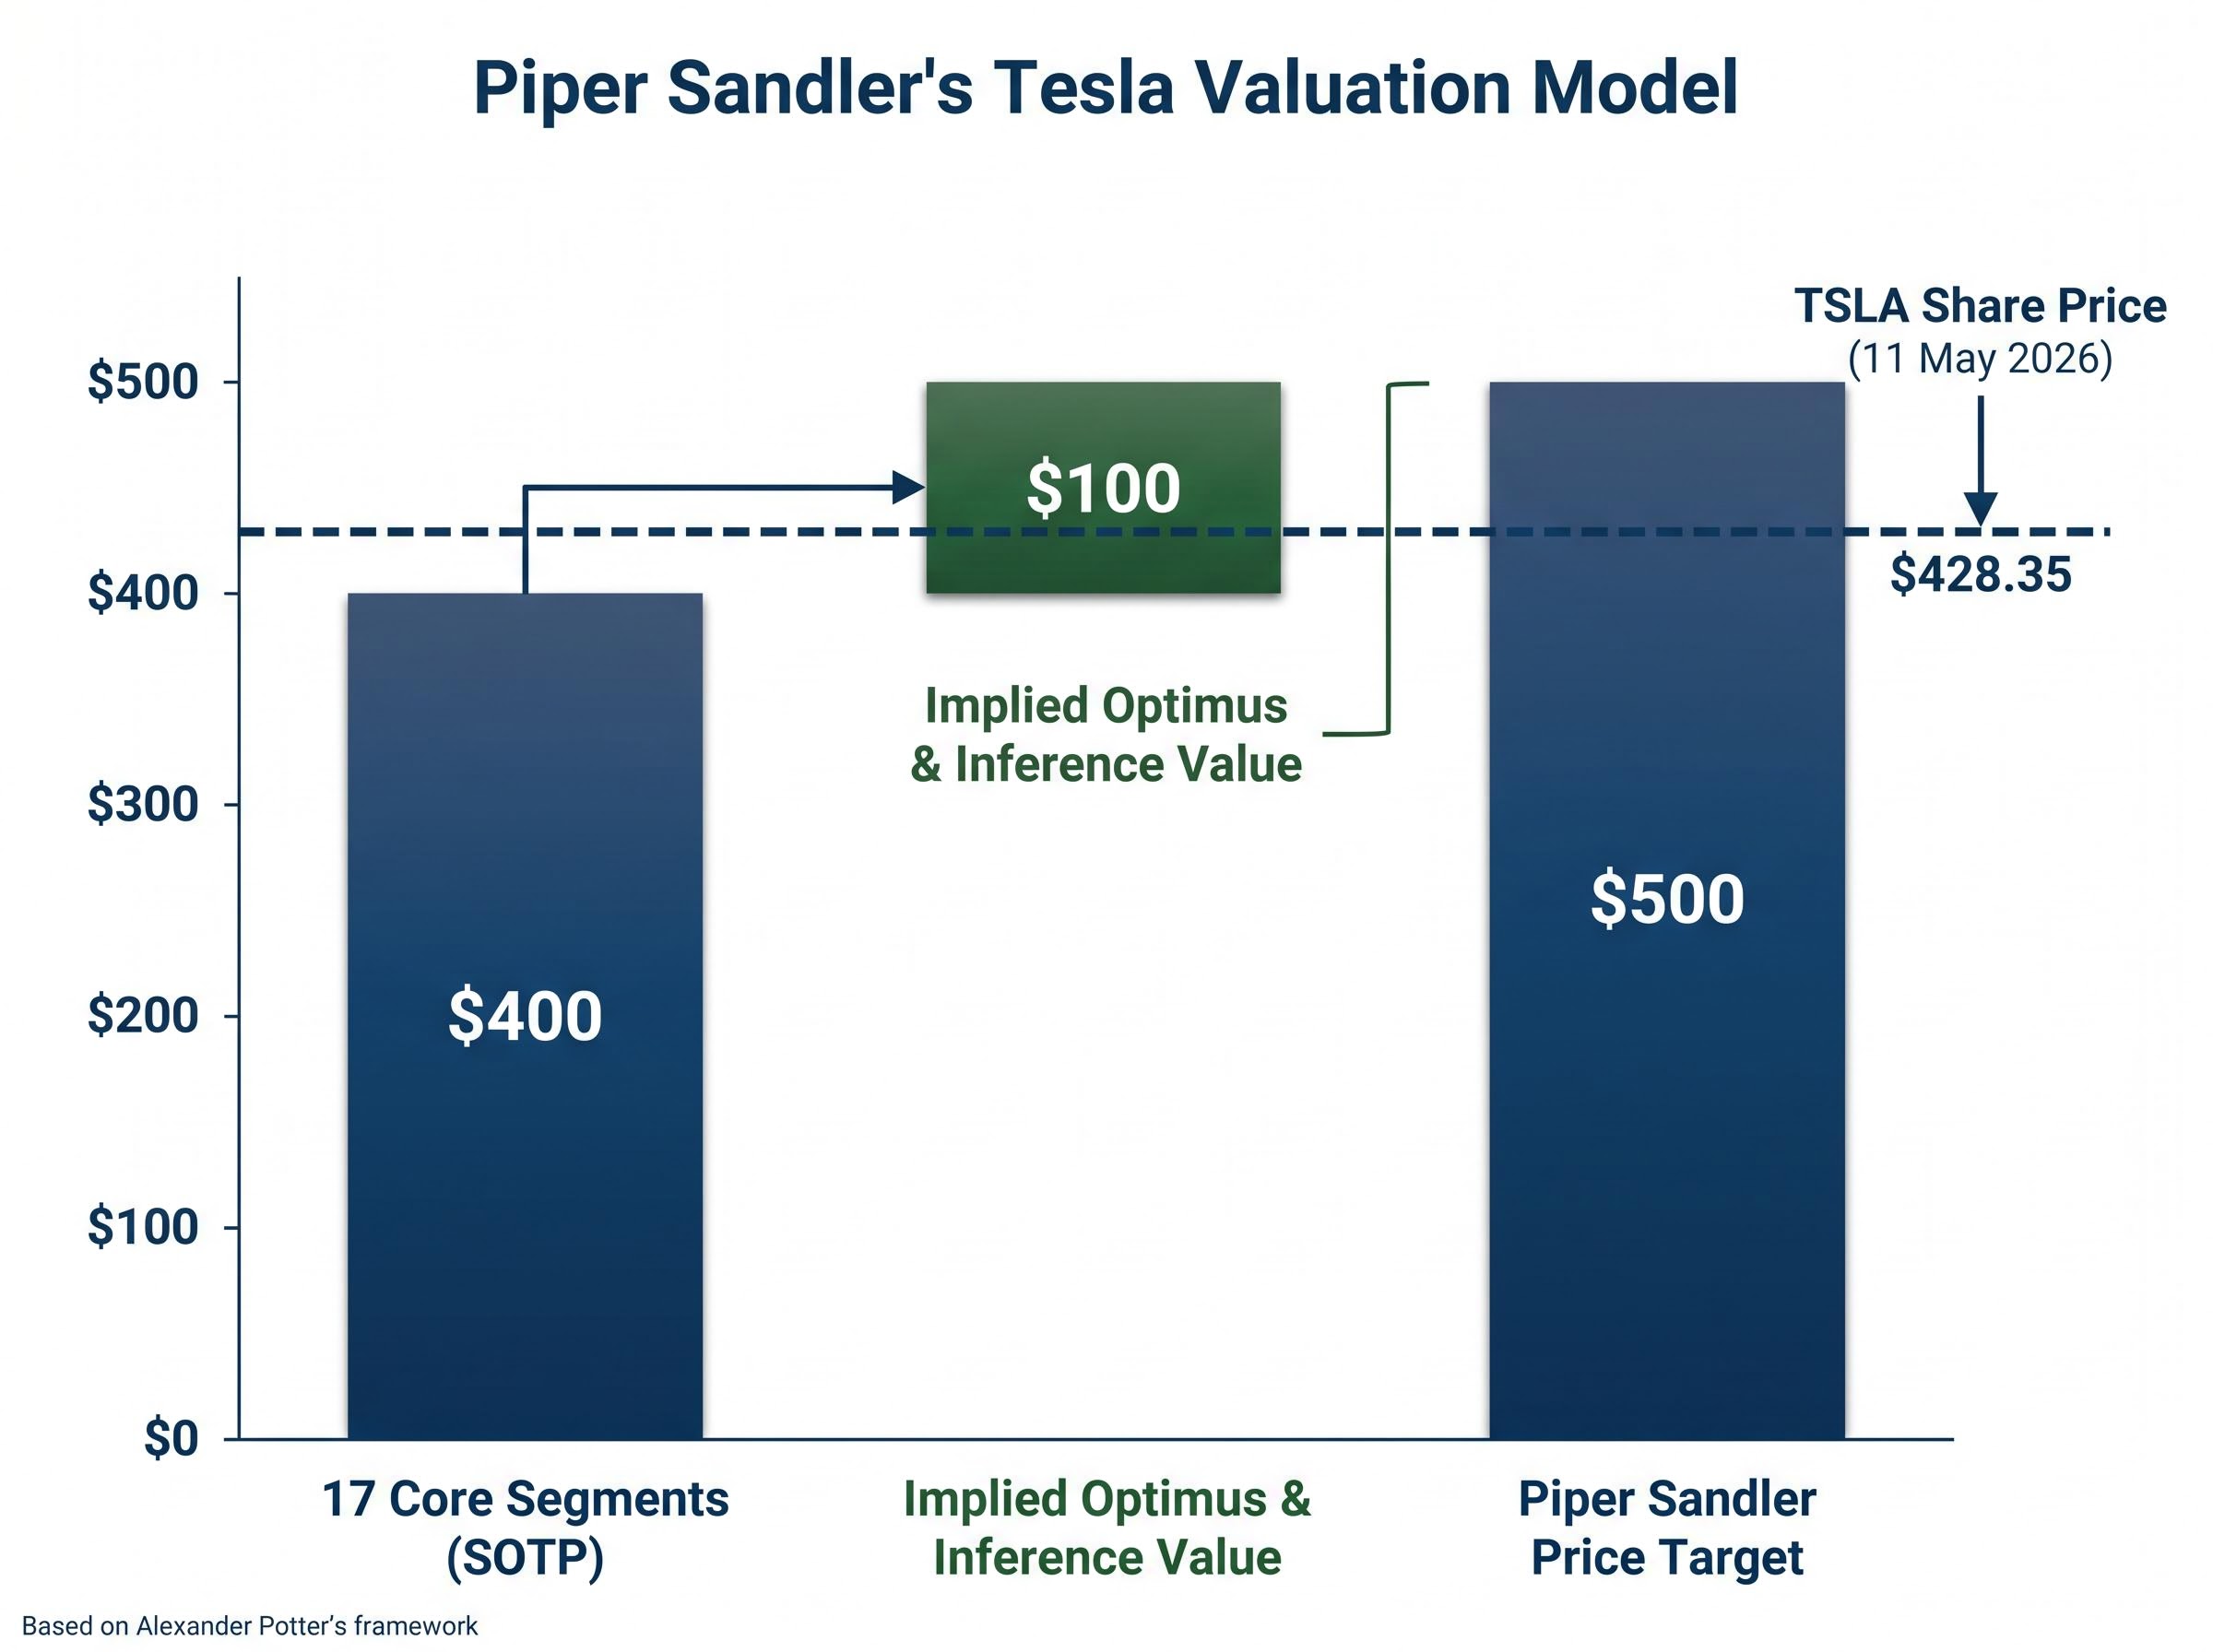
Summing those 17 segments produces approximately $400 per share. That figure sits just below Tesla’s prevailing market price of $428.35 as of the note’s publication date. The logical implication is direct: because the $400 sum-of-the-parts calculation does not include Optimus or inference-as-a-service, the market is currently assigning those two segments a combined value near zero.
Potter characterised the dynamic as investors “getting Optimus for free at current prices,” a framing that redefines the stock’s risk-reward profile for anyone willing to accept the robotics thesis as directionally correct.
The $500 Overweight price target represents the sum of those 17 segments plus whatever residual value accrues from the two excluded businesses. That residual is the subject of the next section.
When big ASX news breaks, our subscribers know first
What humanoid robots are actually worth: the $100-per-share implied bet
The subtraction is clean. $500 minus $400 equals $100 per share, and that figure represents Potter’s embedded bet on Optimus plus inference-as-a-service combined. He has described even this number as likely understating the long-term potential.
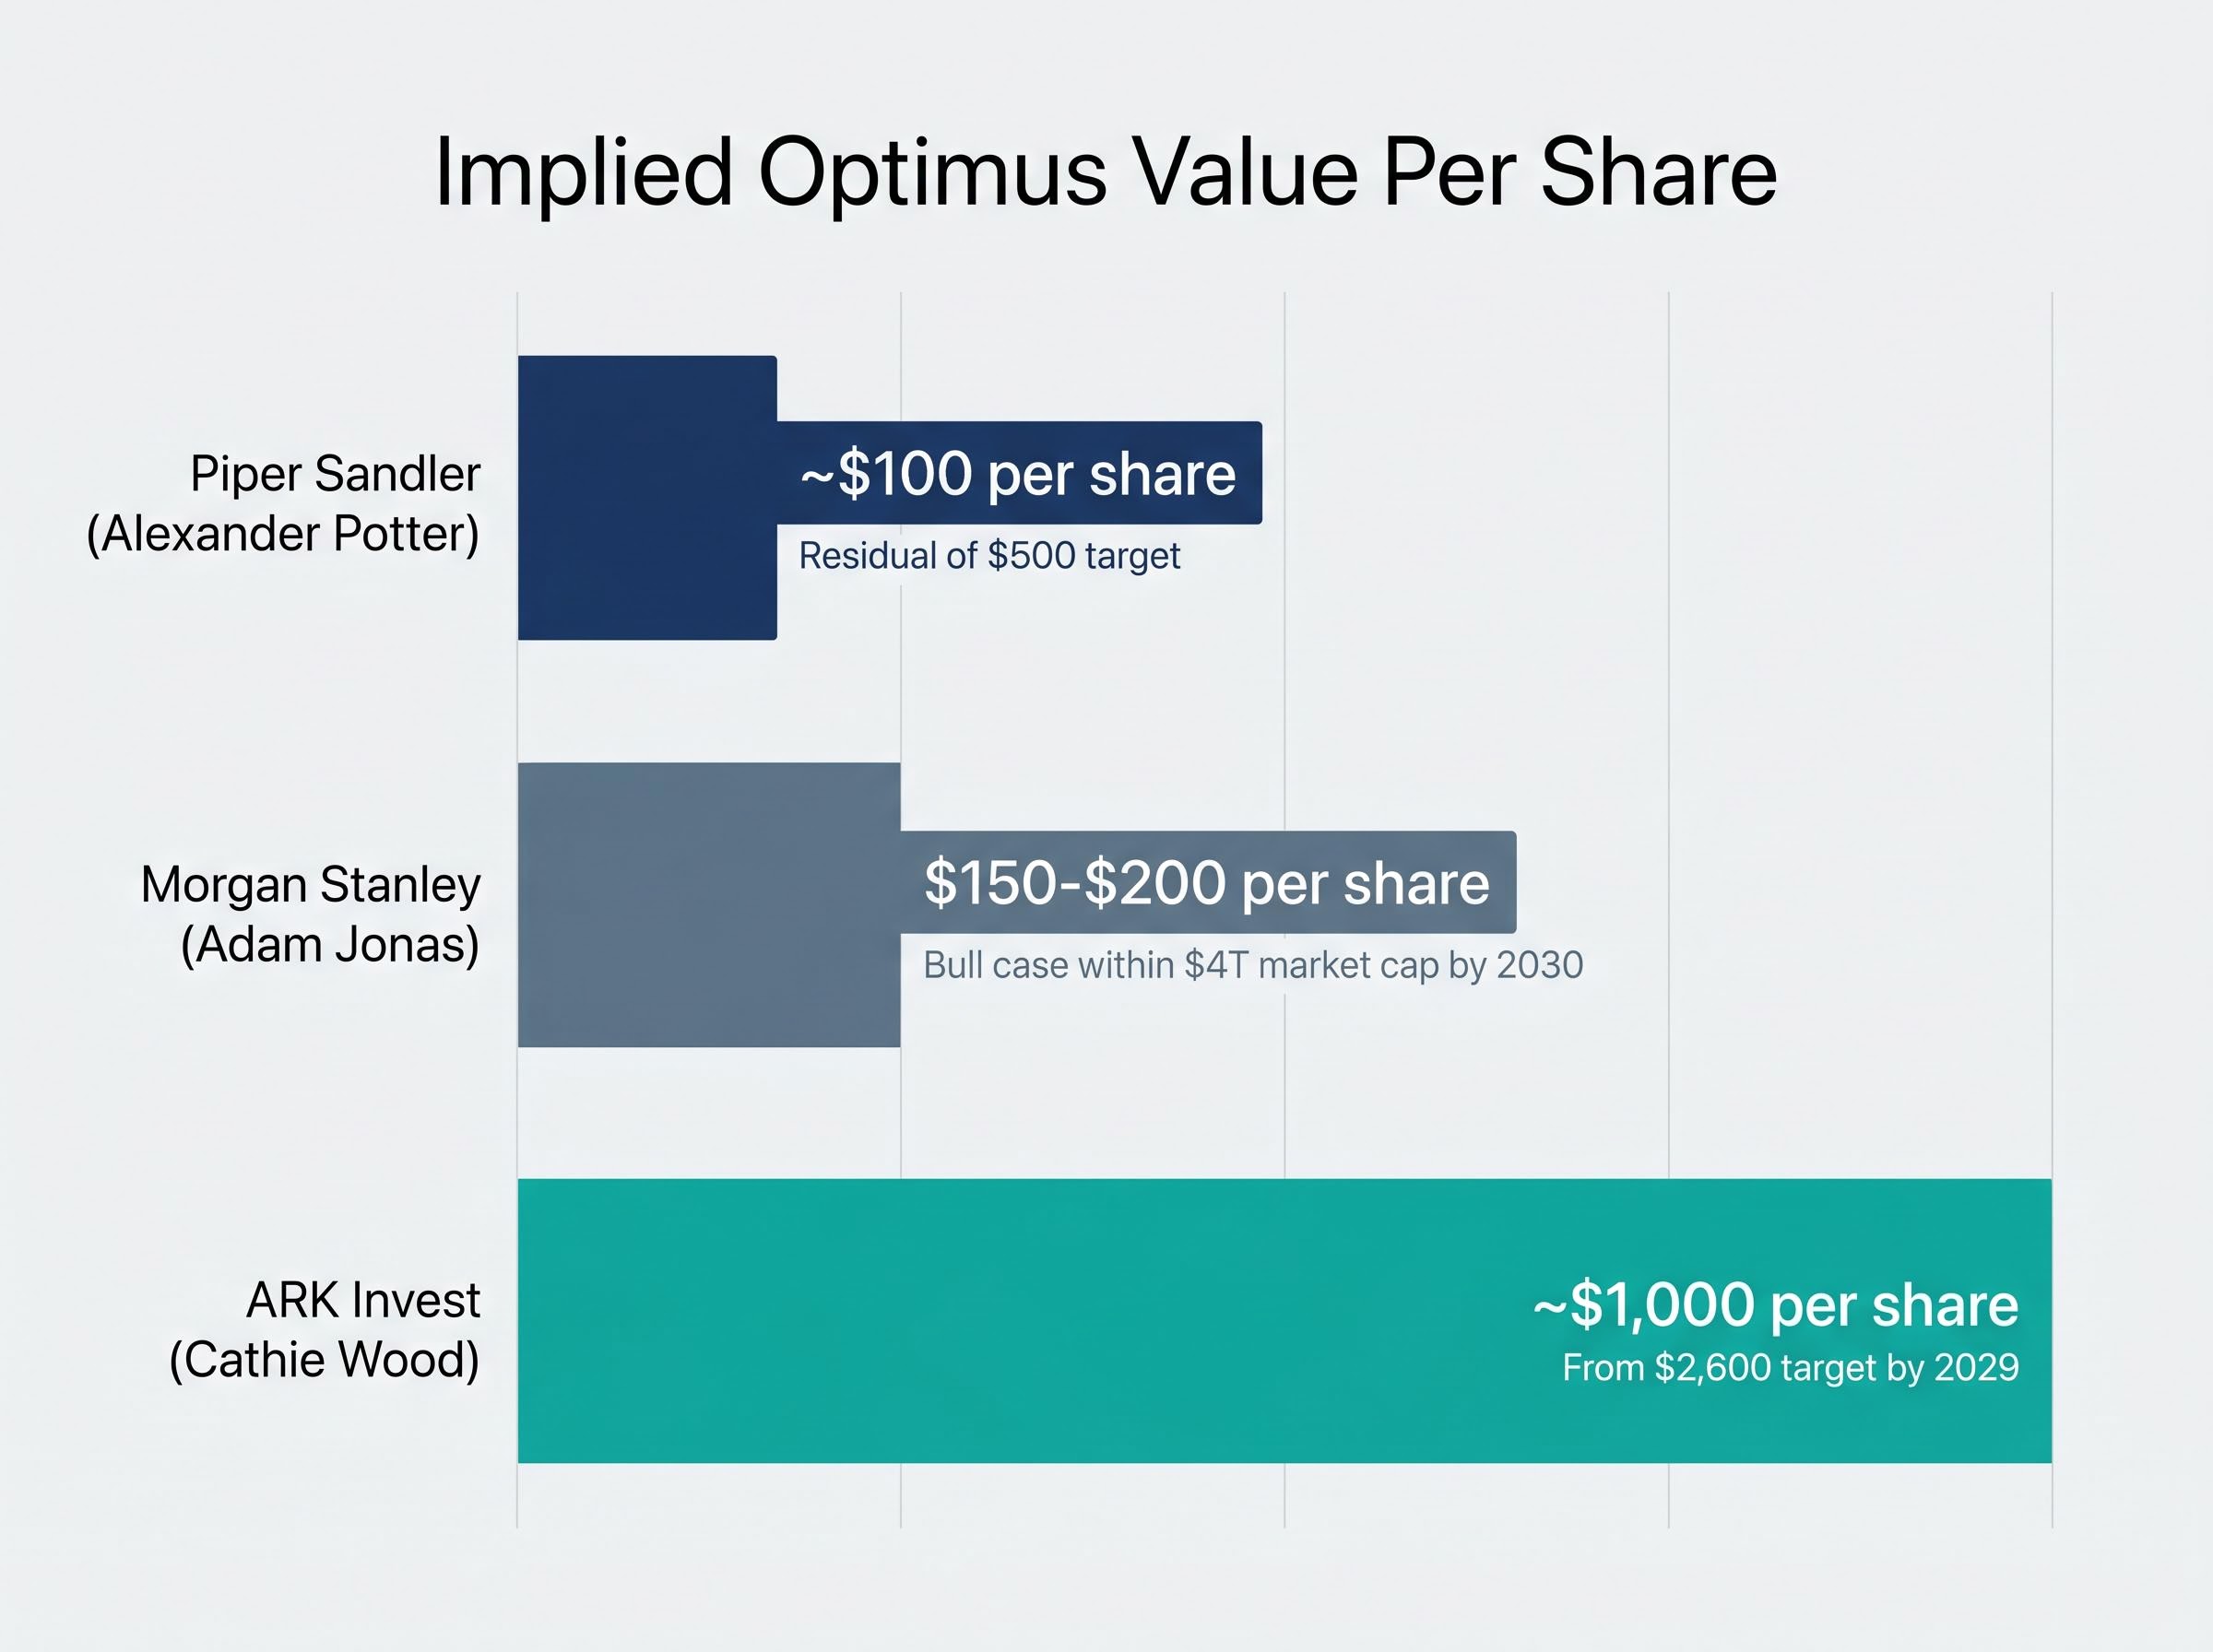
The range across Wall Street is far wider. Morgan Stanley‘s bull case assigns $150-$200 per share to Optimus as part of a scenario in which Tesla reaches a $4 trillion market capitalisation by 2030. ARK Invest‘s $2,600 price target, updated 9 May 2026, attributes approximately 40% of total value to Optimus, implying roughly $1,000 per share from humanoid robotics alone.
Potter has not yet attempted to build formal revenue or profit projections for either Optimus or inference-as-a-service. The $100 figure is a residual placeholder, not a bottom-up estimate. That distinction matters: the number captures what the model does not yet price rather than what it has modelled.
| Analyst / Firm | Price Target | Implied Optimus Value (Per Share) | Methodology Note |
|---|---|---|---|
| Piper Sandler (Alexander Potter) | $500 | ~$100 | Residual after 17-segment SOTP; no formal Optimus model |
| Morgan Stanley (Adam Jonas) | Overweight (bull case) | $150-$200 | Bull case within $4T market cap scenario by 2030 |
| ARK Invest (Cathie Wood) | $2,600 (by 2029) | ~$1,000 | ~40% of total PT; projects 10M+ units, $1T revenue |
The spread from $100 to $1,000 per share reflects fundamentally different assumptions about production scale, software attach rates, and timeline to commercial viability. For investors, the $100 figure is simultaneously the most important and least defensible number in the entire note.
Understanding sum-of-the-parts analysis and why it matters for Tesla
Sum-of-the-parts (SOTP) valuation works by treating each business segment independently. Each segment is valued using the methodology most appropriate for its characteristics, whether that is a revenue multiple, a discounted cash flow model, or a comparable transaction analysis. The individual values are then summed to produce a total per-share figure.
The logic follows three steps:
- Identify discrete business segments with distinct revenue drivers and growth profiles
- Apply segment-appropriate valuation multiples or discounted cash flow assumptions to each
- Sum individual segment values, subtract net debt and dilution, and divide by shares outstanding
The approach is particularly well-suited to conglomerates and companies that span multiple industries. For a single-segment automaker, a price-to-earnings ratio captures most of what matters. For a company operating across automotive manufacturing, software subscriptions, network infrastructure, energy storage, and an emerging robotics platform, a single multiple compresses fundamentally different businesses into one misleading number.
Sum-of-the-parts thinking sits at the core of why Potter’s framework produces a different picture than a single multiple: when Tesla’s AI and software segment accounts for approximately 25-40% of analyst valuations, collapsing those distinct businesses into one P/E ratio buries the variable that separates bull and bear conclusions.
Potter’s inclusion of the 2025 CEO compensation plan in the model for the first time reflects a more rigorous attempt to account for dilution that simpler frameworks have historically ignored.
Why Tesla’s structure makes a single P/E multiple misleading
Tesla‘s trailing price-to-earnings ratio stands at 391.33 as of 11 May 2026. Applied to a traditional automaker, that multiple would imply expectations of extraordinary earnings growth from vehicle sales alone. The SOTP approach reveals a different picture: the automotive segment likely carries a far more modest multiple, while software (FSD subscriptions) and robotics (Optimus) carry much higher ones. Collapsing those distinct businesses into a single P/E obscures where the market is actually placing its bets.
The near-term earnings paradox: why Potter is comfortable being wrong on deliveries
Piper Sandler‘s 2026-2027 delivery and earnings-per-share estimates sit below Wall Street consensus. Two factors drive the gap: lower delivery volumes from discontinued product lines and a reduced contribution from regulatory credit sales.
Potter’s rationale for maintaining a bullish stance despite below-consensus near-term estimates is straightforward. He argues that traditional delivery and EPS metrics are losing relevance as FSD subscriber counts and robotaxi performance become the primary focus for growth-oriented investors. The Q1 2026 earnings call, held 23 April 2026, reinforced this shift: Tesla’s own commentary pivoted away from delivery figures and toward software adoption metrics.
Tesla’s Q1 2026 financial results established the earnings baseline that Potter’s model builds on: $22.39 billion in revenue, a 21.7% gross margin that beat the 17% consensus estimate, and adjusted EPS of $0.41 against a $0.35 expectation, yet the 188x forward P/E means the automotive beat alone does not close the gap between current prices and any fundamentals-based valuation floor.
The supporting data lends the argument some weight. FSD active subscribers reached approximately 476,100 as of Q1 2026, generating roughly $546 million in annual recurring revenue. Q1 2026 GAAP net income came in at $0.5 billion, with non-GAAP net income at $1.5 billion.
The old metric framework centred on:
- Vehicle deliveries and production volumes
- Earnings per share and GAAP profitability
- Regulatory credit revenue contribution
The new framework centres on:
- FSD active subscriber count and growth rate
- Annual recurring software revenue
- Robotaxi waitlist and pilot performance
Not all analysts accept the transition. GLJ Research‘s Gordon Johnson projects a 20% EPS decline for full-year 2026 and has taken a sharply different view of the metric shift.
Gordon Johnson of GLJ Research has characterised the pivot away from delivery and EPS metrics as “smoke and mirrors,” arguing the shift masks deteriorating core automotive economics.
The investment thesis holds or breaks depending on time horizon. Long-term holders need to assess whether the FSD subscriber ramp justifies patience through near-term earnings misses. Sceptics need to weigh whether the metric shift reflects genuine strategic evolution or a reframing of weakness.
Competitive reality check: what private humanoid valuations imply about Tesla’s edge
Figure AI provides the most meaningful valuation benchmark. The company closed a Series C exceeding $1 billion in September 2025, achieving a post-money valuation of $39 billion. It operates an active pilot with BMW in automotive manufacturing and targets approximately 100,000 units by 2028.
Morgan Stanley has argued that Tesla deserves a 2-3x valuation premium over Figure AI on a per-unit economics basis, citing manufacturing scale, an existing battery and compute supply chain, and vertical integration that competitors would need years to replicate.
The broader competitive field remains early-stage. Boston Dynamics (owned by Hyundai) carries an estimated enterprise value of approximately $10-$15 billion, with product sales estimated at $200 million in 2025. Apptronik raised a Series A of approximately $150 million in April 2026 and operates pilots with NASA and Amazon, projecting roughly 5,000 units by 2027.
Tesla’s Optimus programme has 50+ units deployed internally at the Austin Gigafactory as of March 2026, with a first external pilot announced with PepsiCo on 30 April 2026. Elon Musk has guided toward $10 billion in Optimus revenue by 2027, based on approximately 500,000 units at $20,000 per unit. That guidance has not been filed with the SEC.
| Company | Current Valuation | Key Pilot / Customer | 2027-2028 Unit Target | Ownership Status |
|---|---|---|---|---|
| Tesla (Optimus) | ~$100/share implied (Piper Sandler) | PepsiCo (logistics) | ~500,000 by 2027 (Musk guidance) | Public (TSLA) |
| Figure AI | $39B post-money | BMW (automotive manufacturing) | ~100,000 by 2028 | Private |
| Boston Dynamics | ~$10-$15B (estimated) | Multiple commercial clients | Commercial ramp 2026 | Hyundai subsidiary |
| Apptronik | ~$150M Series A | NASA, Amazon | ~5,000 by 2027 | Private |
All major humanoid competitors remain privately held, making direct public market comparisons inherently imprecise. Execution risk, spanning production ramp, cost curve, and commercial adoption, remains the dominant variable across the sector.
Tesla’s robotaxi competitive positioning carries more weight in the bull case than the Optimus section alone implies: Waymo already operates 3,000 vehicles with over 20 million paid trips and full commercial permits across multiple cities, while Tesla holds zero paid commercial robotaxi rides as of May 2026, a gap that the Optimus and FSD subscriber metrics do not yet close.
The $500 target is a floor, not a ceiling, for those who believe the robotics thesis
Potter’s $500 target implies roughly 17% upside from the 11 May closing price of $428.35. Yet his language around Optimus being a “conservative” residual, one that could eventually exceed all other Tesla segments combined, suggests the real bull case is not $500 but a number that depends entirely on how the robotics ramp unfolds over the next three to four years.
Goldman Sachs holds a $420 Buy target and projects humanoid robotics at approximately 20% of Tesla revenue by 2028. ARK Invest‘s $2,600 target by 2029 sits at the far end of the spectrum. The Wall Street consensus, a $398.42 median across 41 analysts (19 Buy, 17 Hold, 5 Sell), sits below the current share price, indicating the market is already pricing in more optimism than the median analyst endorses.
Scenario probability sensitivity explains much of Tesla’s day-to-day price volatility: a 10-percentage-point shift in the probability assigned to the bull scenario moves the blended fair value estimate by approximately $80-$120 per share, which is why a single earnings beat or regulatory headline can swing the stock by double digits without any change to the underlying business.
The analysis implies three distinct investor postures:
- Bull case: Investors who believe humanoid robotics achieves commercial scale by 2028-2030 are acquiring what Potter describes as a free option on the most valuable segment Tesla has ever developed.
- Base case: Investors comfortable with the $400 sum-of-the-parts figure for the existing 17 segments view the stock as fairly valued at current levels, with Optimus as potential upside.
- Bear case: Investors sceptical of the robotics timeline face a stock trading above median consensus at a trailing P/E of 391, where the margin of safety depends on businesses that have not yet generated revenue.
Past performance does not guarantee future results. Financial projections cited in this analysis are subject to market conditions, execution risk, and various external factors.
This article is for informational purposes only and should not be considered financial advice. Investors should conduct their own research and consult with financial professionals before making investment decisions.