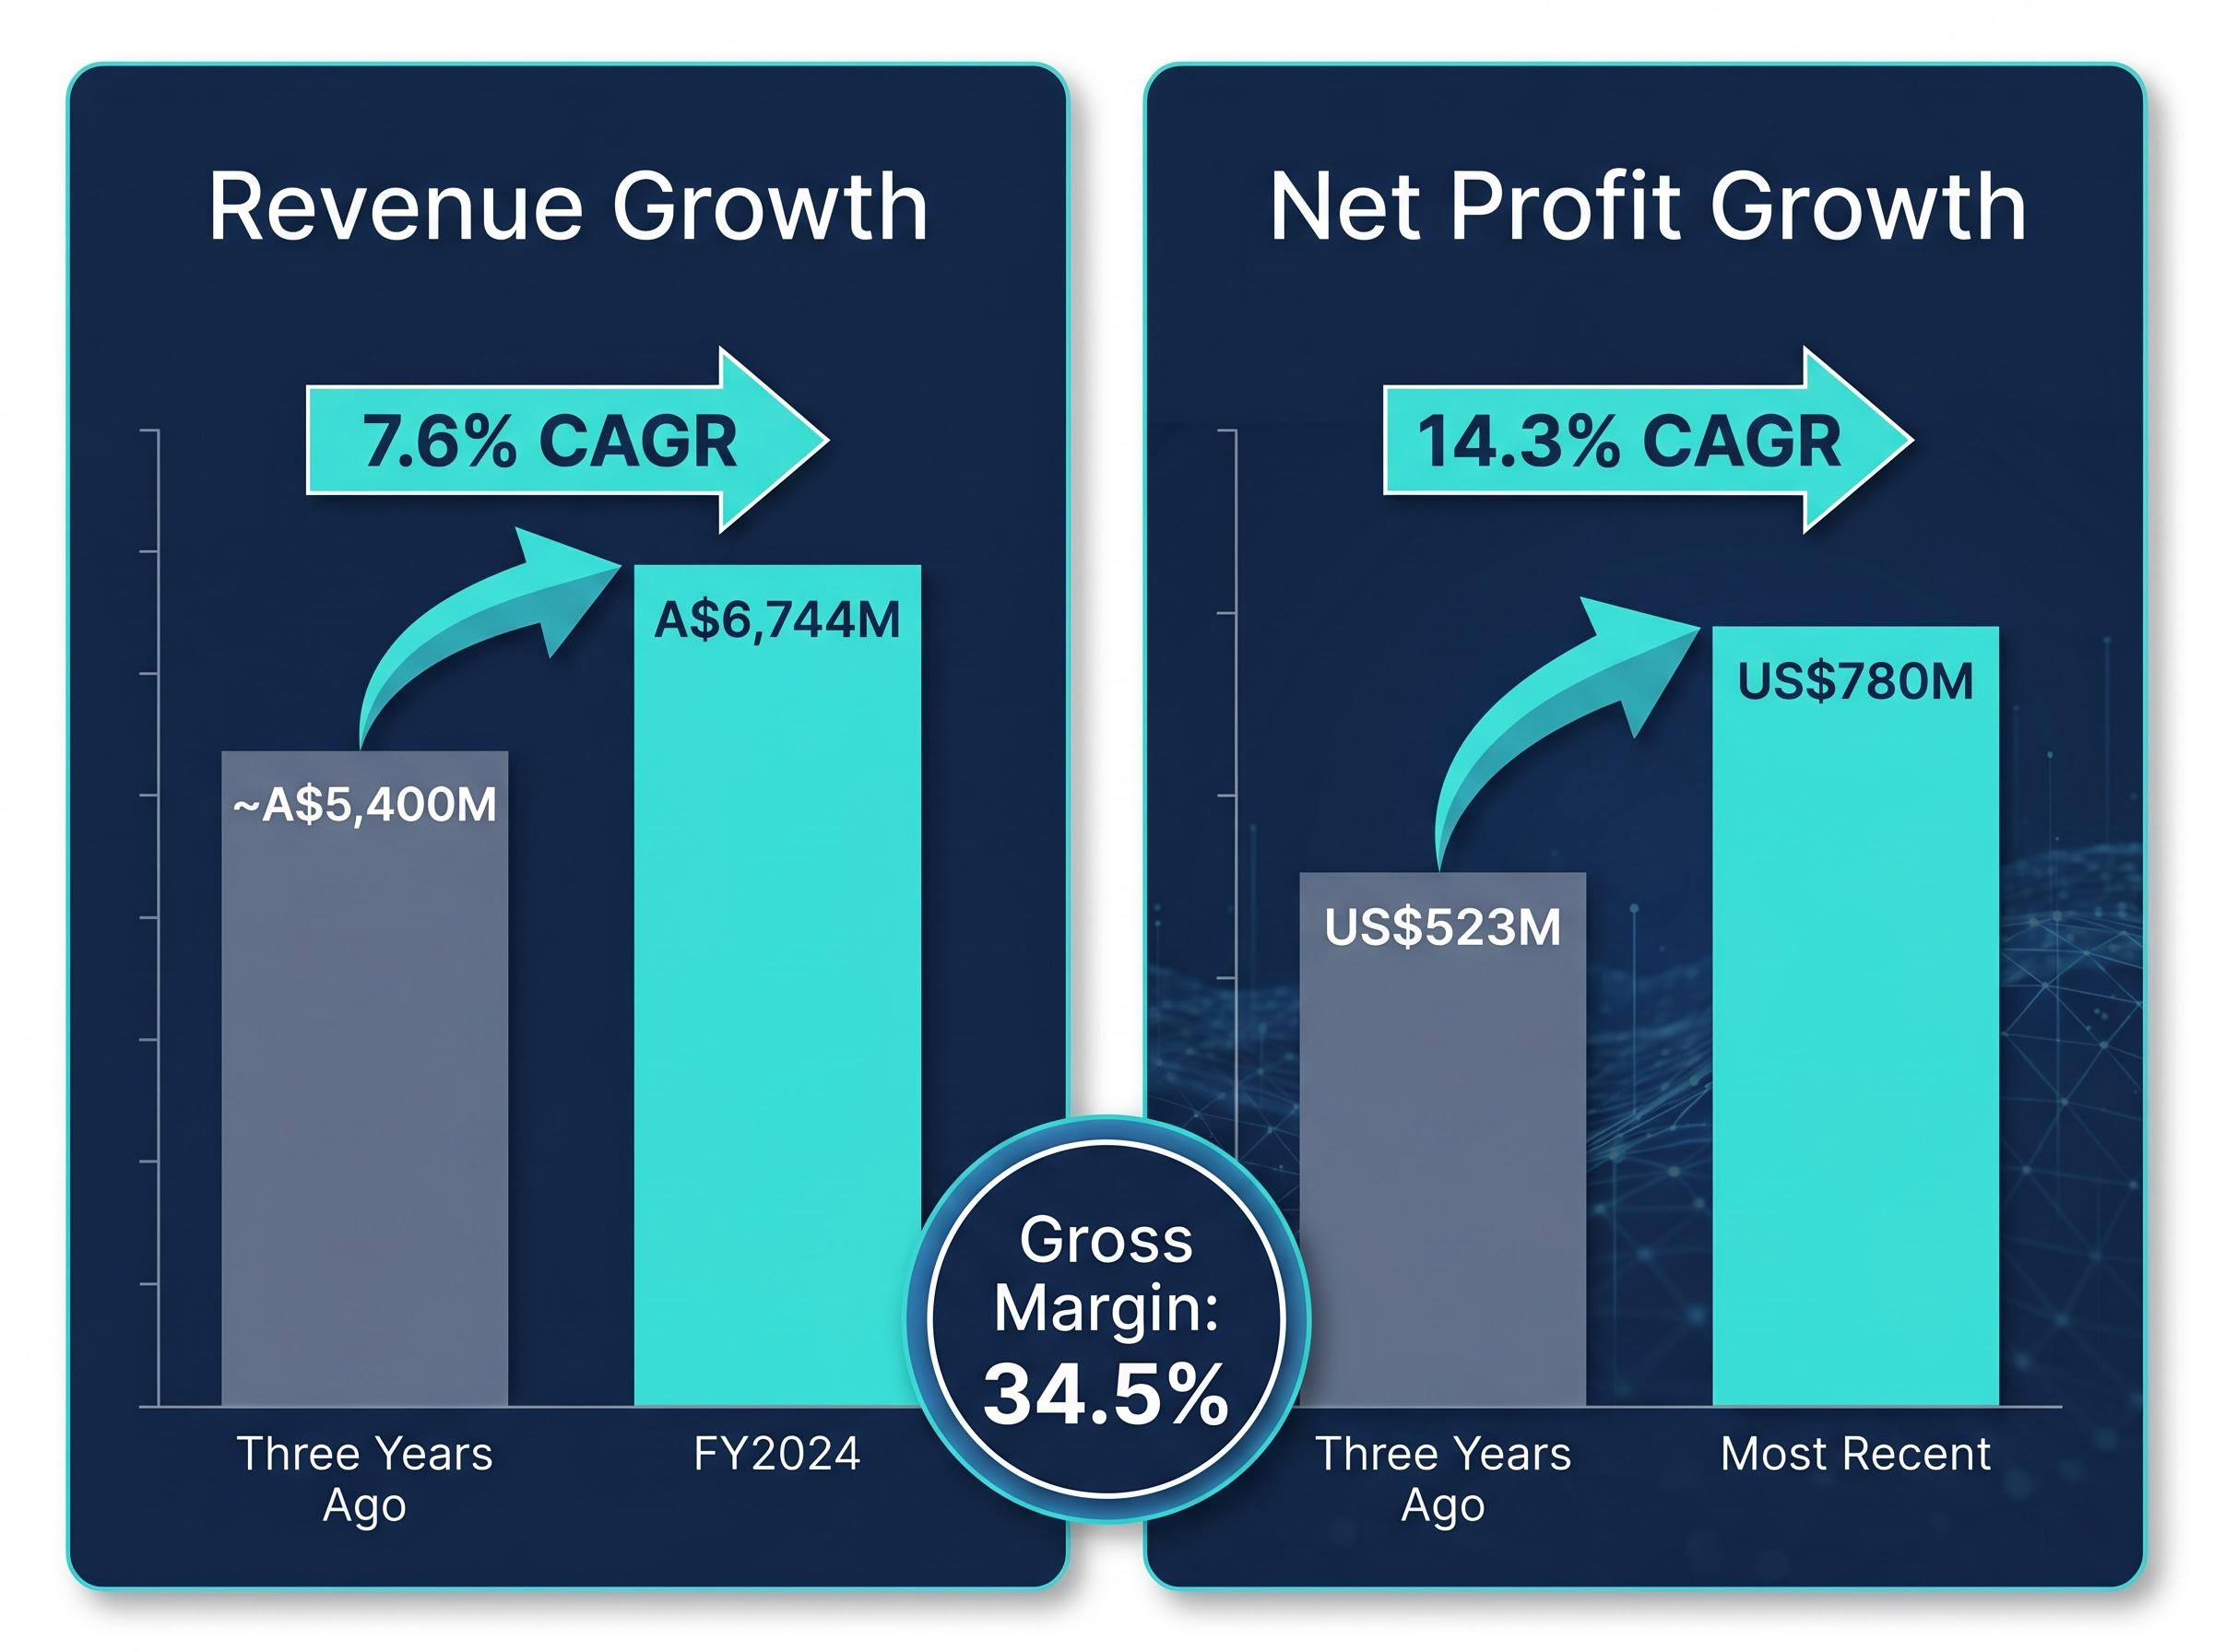
Brambles has grown annual profit from US$523 million to US$780 million in three years, delivering a compound annual growth rate of 14.3%. Yet the BXB share price sits near A$22.50 in mid-May 2026, down roughly 3.5% year-to-date while the ASX 200 has gained ground. That divergence is where the investment question begins.
With 1H FY2026 results already reported, an upgraded free cash flow outlook of US$950-1,100 million, and a consensus analyst target implying 10-11% upside from current levels, Brambles is attracting renewed attention from ASX investors reassessing their industrial holdings. The question is whether subdued revenue growth represents a structural ceiling or a temporary drag on an otherwise high-quality compounder. This analysis walks through the business model, profitability metrics, balance sheet position, and valuation picture to help Australian investors decide whether BXB deserves a spot on their watchlist or in their portfolio.
How Brambles actually makes money: the pallet-pooling model explained
Most investors encountering Brambles for the first time see a logistics company. The reality is more specific, and more durable, than that label suggests. Brambles operates the world’s largest reusable pallet, crate, and container pooling network under the CHEP brand, with divisions spanning Asia-Pacific, the Americas, and EMEA.
The revenue model works like a toll road for physical goods. Manufacturers and retailers do not buy pallets outright. Instead, they pay ongoing daily hire fees as pallets circulate through supply chains, moving from factory to warehouse to store and back again. This creates a recurring revenue stream tied directly to the volume of physical goods moving through the global economy.
Three features define the pallet-pooling model:
- Daily hire fee structure: Revenue recurs as long as pallets remain in circulation, rather than depending on one-off sales or project wins.
- Multi-regional CHEP operations: The network spans three major geographies, diversifying exposure across consumer markets.
- Circular supply chain role: Pallets are collected, repaired, and reissued, embedding Brambles into ongoing logistics operations rather than sitting as a discretionary spend line.
Gross margin: 34.5% This figure reflects the profitability of core pallet-pooling operations before overhead, a level consistent with a business whose revenue is structurally recurring rather than cyclically dependent.
FY2024 revenue reached A$6,744 million, supported by a three-year revenue compound annual growth rate (CAGR) of 7.6%. For investors assessing BXB, understanding this hire fee model is the foundation: the high gross margins and recurring cash flows are structural features, not cyclical luck.
When big ASX news breaks, our subscribers know first
Profit growth that outpaces revenue: reading the three-year scorecard
The headline number is 14.3%. That is the three-year profit CAGR Brambles has delivered, compounding from US$523 million to US$780 million. Set alongside revenue growth of 7.6% over the same period, the implication is clear: profit is expanding roughly twice as fast as the top line.
A gap of that magnitude typically signals one of three things: cost discipline, operational efficiency gains, or pricing power. In Brambles’ case, the 1H FY2026 results suggest all three may be contributing.
| Metric | Three Years Ago | Most Recent | Growth |
|---|---|---|---|
| Revenue (annual) | ~A$5,400M | A$6,744M (FY2024) | 7.6% CAGR |
| Net Profit | US$523M | US$780M | 14.3% CAGR |
| Gross Margin | — | 34.5% | Expanding |
1H FY2026 confirms the trend is holding
The most recent half-year result, reported on 19 February 2026, confirmed this pattern is not a historical artefact. Brambles delivered underlying profit of US$792 million, up 7% in constant currency terms, on sales revenue of US$3.53 billion that grew just 2%. Basic earnings per share rose 13%.
Management’s own signals reinforced the trajectory. The interim dividend increased 21% to 23.0 US cents, and free cash flow guidance was upgraded to US$950-1,100 million from a prior range of US$850-950 million. When a board lifts both the dividend and the cash flow outlook in the same result, it is typically expressing confidence that the margin expansion has further to run.
Balance sheet health: what the debt and ROE figures reveal
Net debt of A$2,528 million is a large number on its own. For a company of Brambles’ scale, the more relevant question is how that debt compares to equity and earnings.
The debt-to-equity ratio stands at 81.8%, meaning shareholders own more of the business than creditors do. For an industrial company with recurring revenue and high capital returns, a reading below 100% is generally considered a moderate leverage position rather than an aggressive one.
| Metric | Value | What It Signals |
|---|---|---|
| Net Debt | A$2,528M | Moderate leverage for an industrial compounder |
| Debt-to-Equity Ratio | 81.8% | Shareholders own more of the business than creditors |
| Return on Equity (FY2024) | 25.6% | Strong profit generation from the equity base |
The figure that ties the balance sheet together is the return on equity (ROE), which measures how effectively management generates profit from shareholders’ capital. At 25.6% for FY2024, Brambles sits well above most ASX industrials. Combined with an active US$400 million share buyback programme (US$191 million completed in 1H FY2026), the capital allocation picture suggests financial discipline rather than borrowed-capital optimism.
Two balance sheet risks warrant monitoring:
- Interest rate sensitivity: Net debt at this level creates exposure to rate movements, a consideration that remains relevant given the current Australian rate environment.
- FX translation risk: Brambles reports in USD, but Australian investors receive returns in AUD. Movements in the AUD/USD exchange rate can materially alter the returns shareholders actually capture.
What the current share price implies about valuation
At approximately A$22.50 in mid-May 2026, BXB is down roughly 3.5% year-to-date. The ASX 200 has gained approximately 2% over the same period. That short-term underperformance gap frames the valuation question: is the market mispricing a high-quality compounder, or is the discount warranted?
| Metric | Value | Implication |
|---|---|---|
| Current Price | ~A$22.50 | Down ~3.5% YTD |
| Consensus Analyst Target | ~A$24.80-25.07 | 10-11% upside implied |
| Simply Wall St Fair Value | A$26.06 | 14-16% upside implied |
| Forward P/E (FY2025E) | ~23x | Not cheap; requires earnings delivery |
| Dividend Yield | ~2.5% | Below 5-year average of ~2.66% |
The consensus analyst target of approximately A$24.80-25.07 (with a high target of A$29.23) implies 10-11% upside. Separately, Simply Wall St’s discounted cash flow model estimates fair value at A$26.06.
Simply Wall St fair value estimate: A$26.06 This independent valuation model implies 14-16% upside from current levels, suggesting the market may be underpricing Brambles’ cash flow generation and margin trajectory.
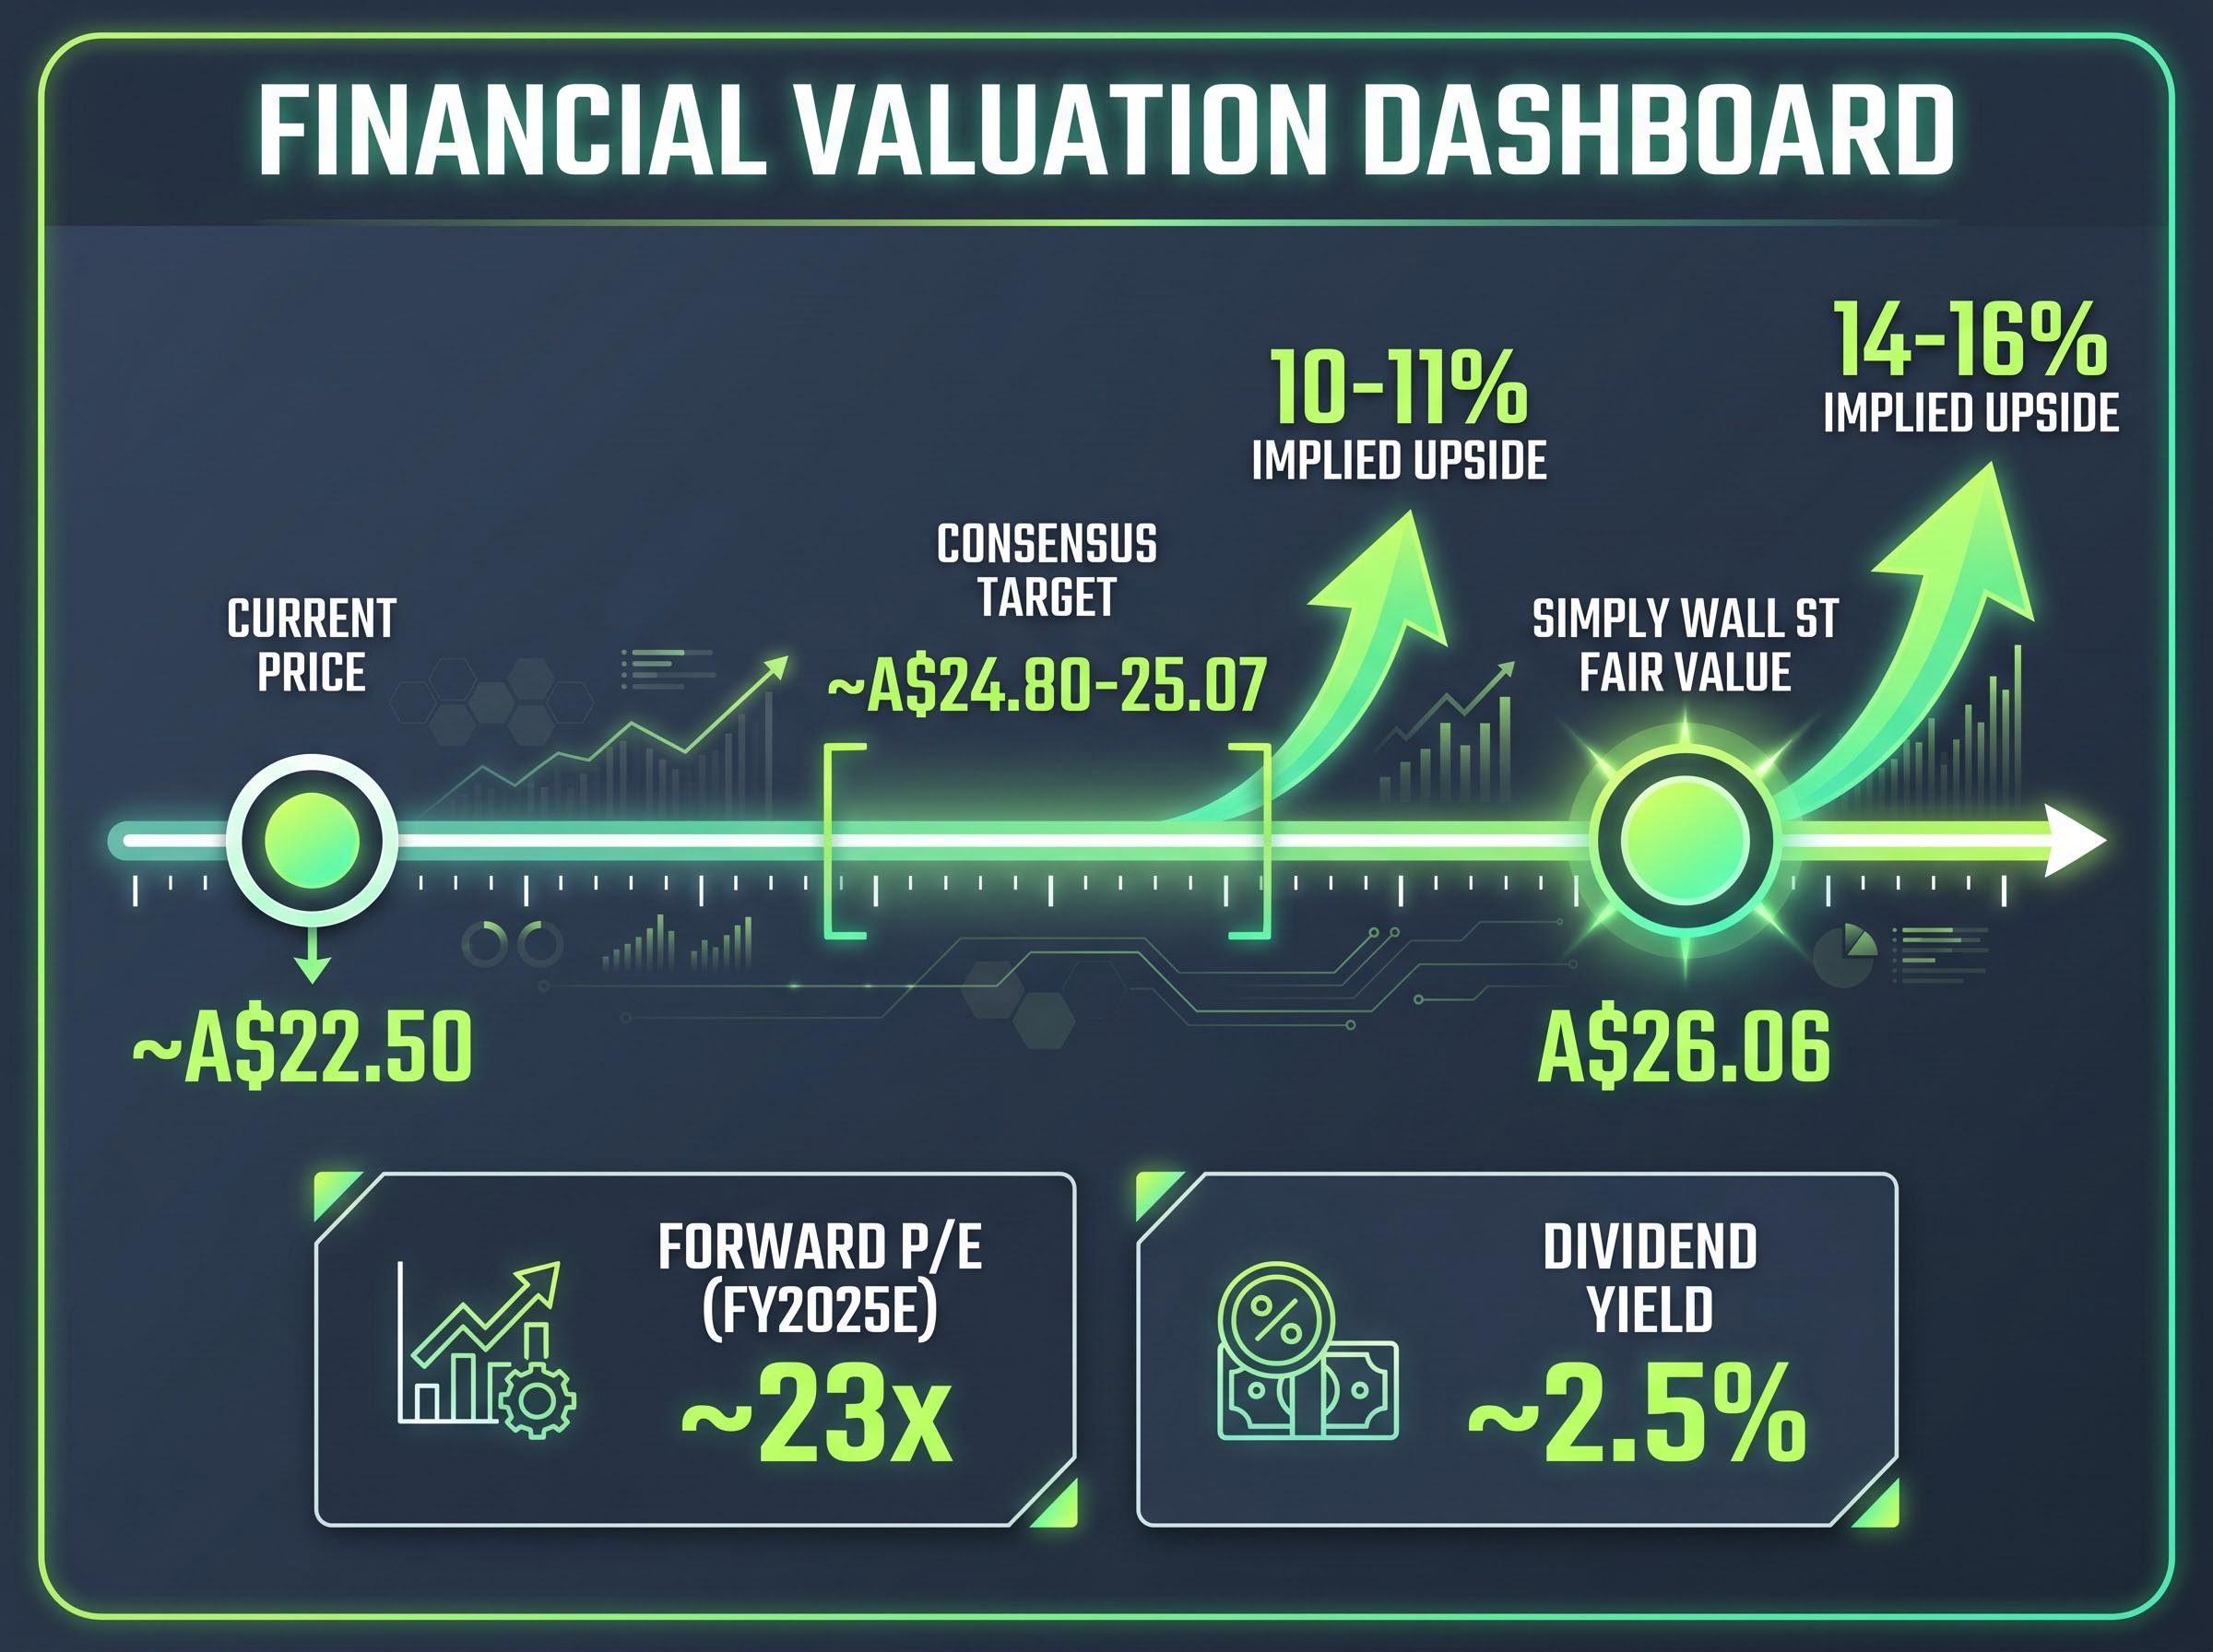
At A$22.50, the implied forward price-to-earnings ratio is approximately 23x on FY2025 consensus earnings per share of approximately A$0.98. That multiple is not cheap in absolute terms. The valuation case depends on continued earnings growth being delivered, and management’s own FY2026 guidance calls for sales growth of 3-4% and underlying profit growth of 8-11%.
The dividend yield of approximately 2.5% sits below the five-year average of approximately 2.66%, providing a modest income return while investors wait for capital appreciation. The 10-15% gap between the current price and consensus fair value is a meaningful signal, but it only pays off if FY2026 full-year earnings meet or exceed guidance.
Past performance does not guarantee future results. Financial projections are subject to market conditions and various risk factors.
The risks that could stall the BXB thesis
The bull case for Brambles is built on margin expansion, cash flow upgrades, and digital transformation optionality. Each of those pillars has a corresponding risk that could slow or reverse the trajectory.
- Volume softness in core markets: Softer consumer demand in the US and Europe has already prompted Brambles to narrow its FY2026 sales growth guidance from 3-5% to 3-4%. A further deterioration in pallet volumes would compress the revenue line without a guaranteed offset from efficiency gains.
- FX translation risk: Brambles reports in USD. For Australian investors, movements in the AUD/USD exchange rate create translation effects that can materially alter the returns they actually receive, independent of how well the underlying business performs.
- Legal proceedings: A class action judgment on 13 April 2026 remains an unresolved uncertainty. Market commentary has treated this as manageable noise rather than a structural threat, but the final financial impact remains unclear.
Digital transformation: upside optionality or execution risk?
- Digital execution risk: The Serialisation+ and autonomous tracking rollout is central to the long-term margin improvement story. These initiatives aim to reduce pallet loss rates, lower capital intensity, and expand margins over time. Delays or cost overruns in the digital programme could slow the free cash flow upgrade that underpins the valuation case.
The counter-argument is that Brambles’ management has a track record of operational delivery. The company was ranked number two in the Dow Jones Best-in-Class sustainability ranking, announced on 1 May 2026, which provides some governance quality context when assessing execution credibility.
None of these risks is individually a dealbreaker. Together, they define the conditions under which the valuation gap fails to close. The three-year total shareholder return of approximately +70% shows what happens when the thesis executes cleanly. Investors who can monitor volume trends and digital rollout progress are better positioned to hold conviction through short-term noise.
These statements are speculative and subject to change based on market developments and company performance.
Strong metrics, modest revenue: BXB’s case rests on what comes next
Brambles presents a familiar tension for quality-focused investors. The profitability metrics are strong: a 14.3% profit CAGR, 25.6% ROE, and upgraded free cash flow guidance of US$950-1,100 million. The revenue growth rate of 7.6% and a narrowing sales guidance range raise a legitimate question about the ceiling on earnings expansion.
At approximately A$22.50, the stock trades at a 10-15% discount to consensus and fair value estimates, with a dividend yield of approximately 2.5% providing a modest income return while investors wait. The FY2026 full-year result, expected in August 2026, will be the clearest test of whether the profit-over-revenue growth pattern holds.
Three watchlist criteria for investors tracking this name:
- Evidence of volume recovery in US and European consumer markets.
- Delivery of 8-11% underlying profit growth guidance for FY2026.
- Digital rollout progress updates, particularly on Serialisation+ and autonomous tracking, in the full-year result.
This article is for informational purposes only and should not be considered financial advice. Investors should conduct their own research and consult with financial professionals before making investment decisions.