HSBC Raises S&P 500 Target to 7,650, Holds Maximum Equity Overweight
1 hr ago

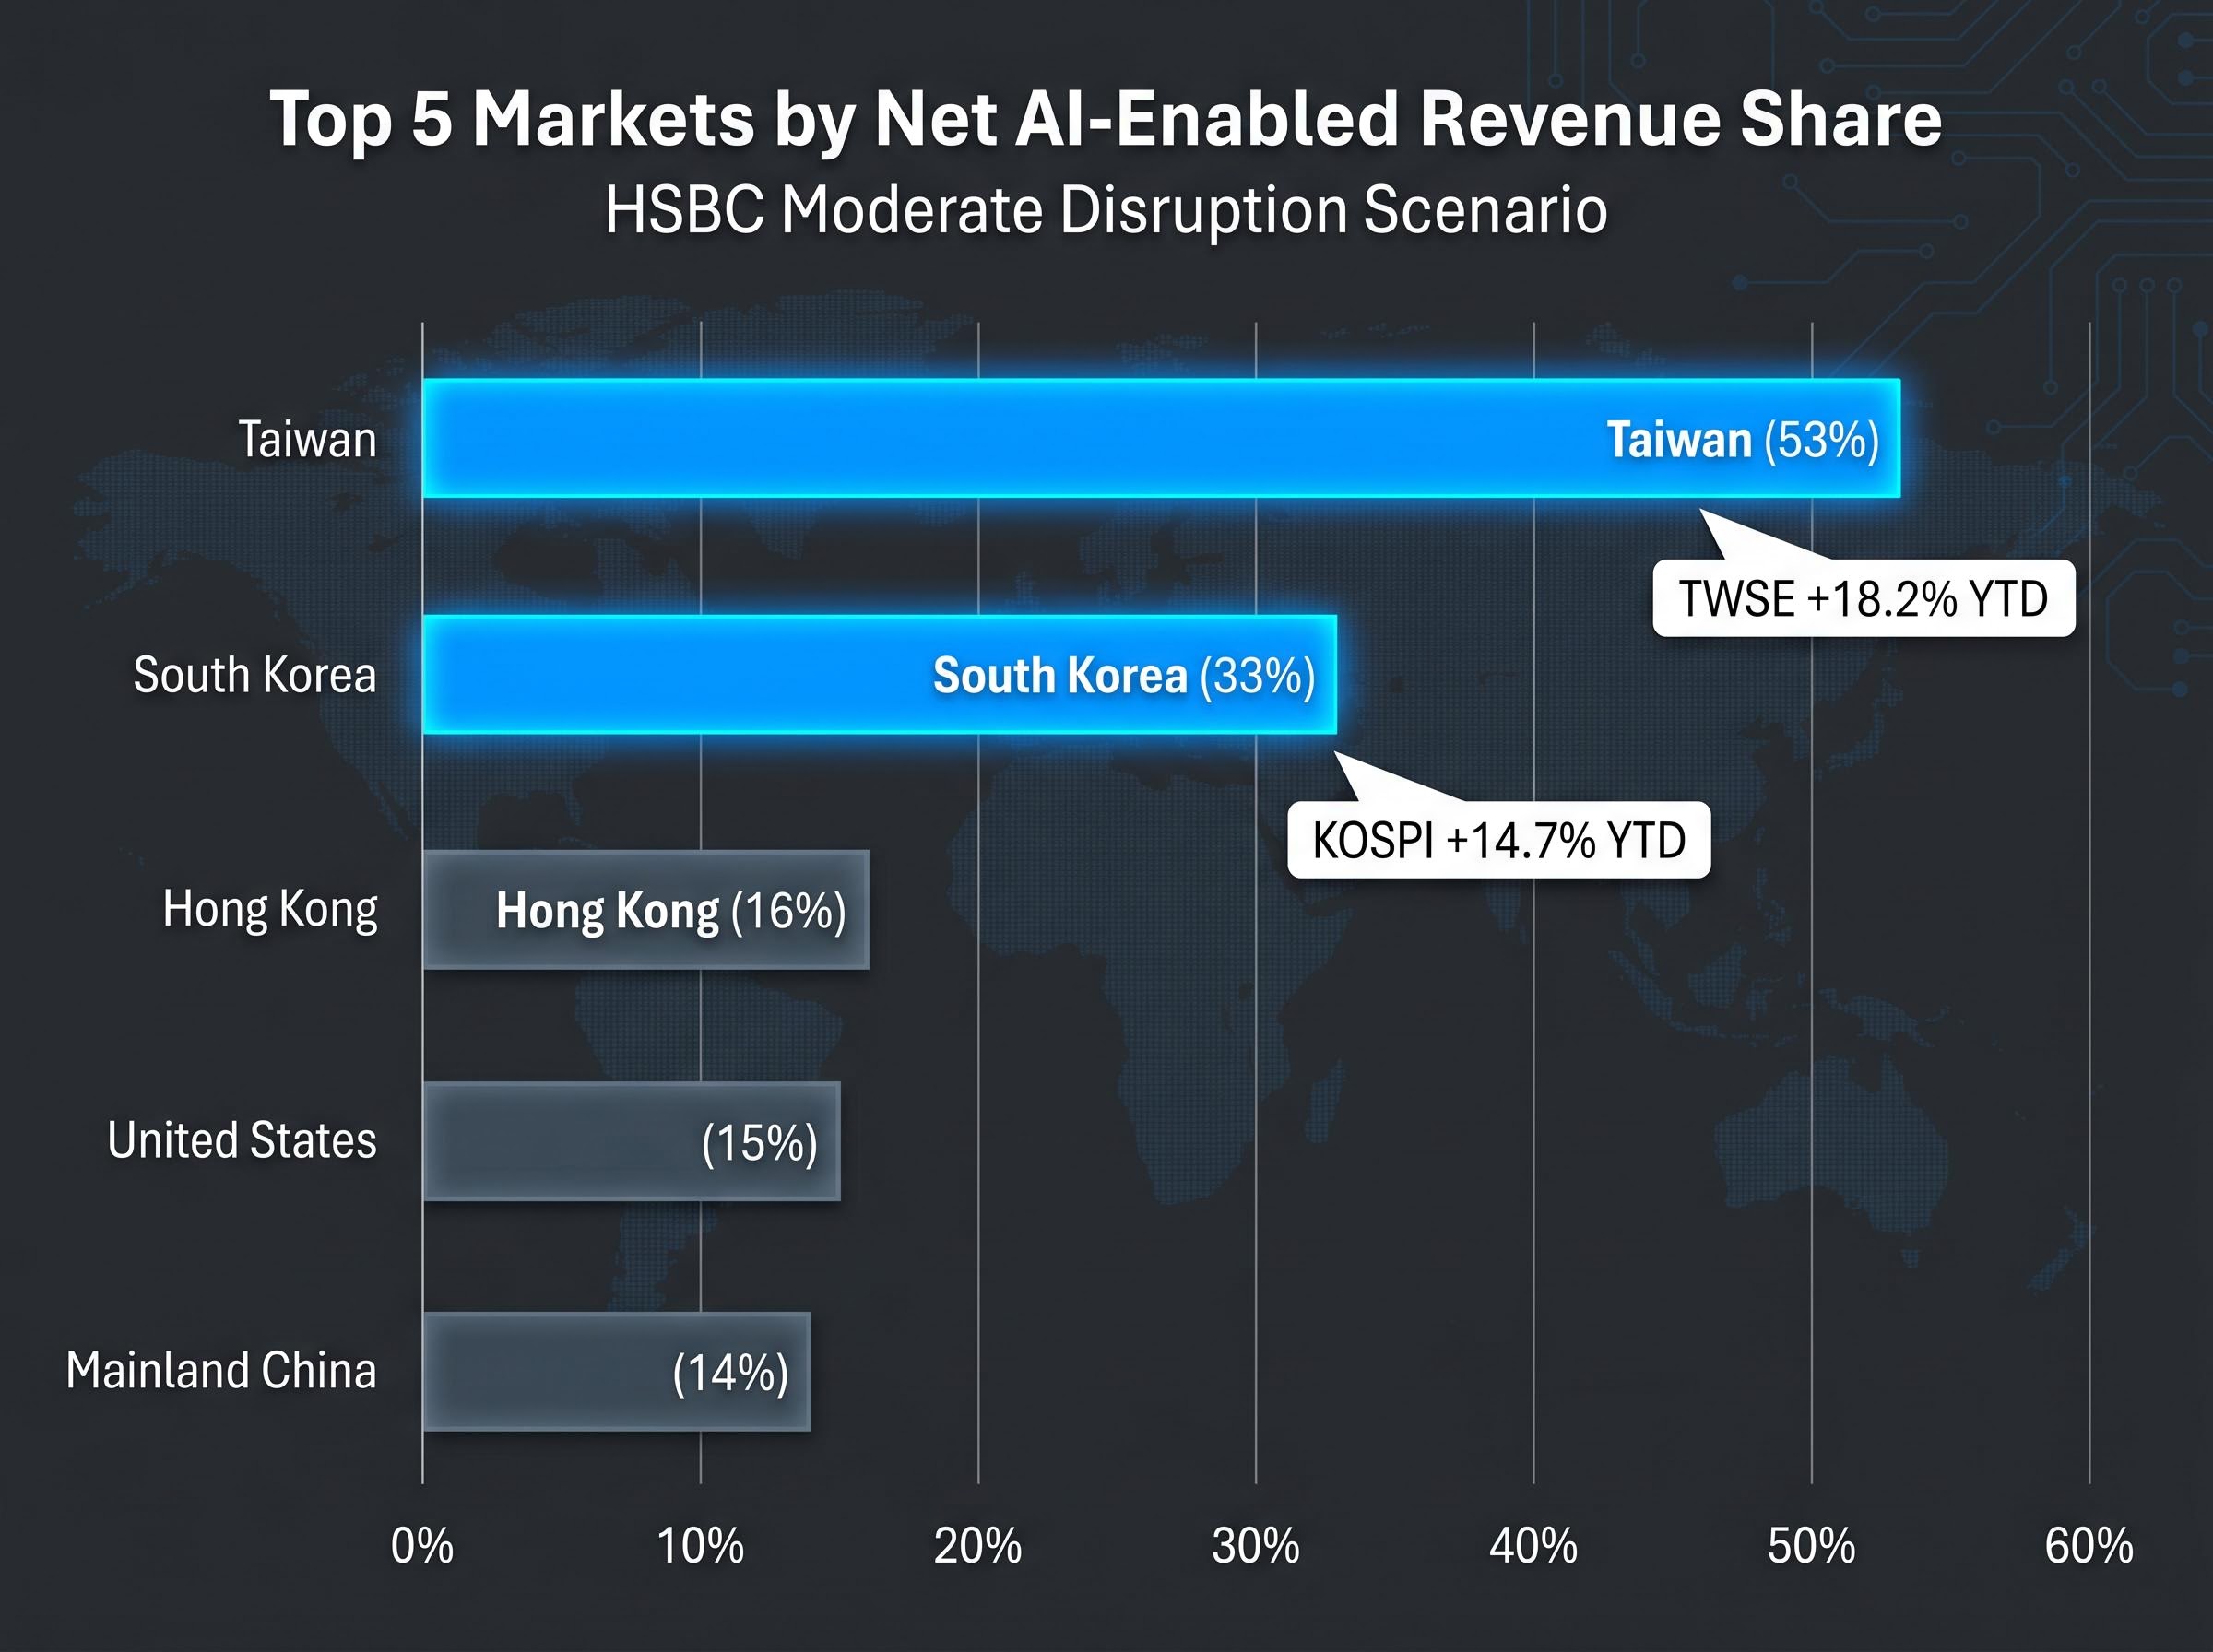
HSBC published its AI equity market framework on 10 May 2026, ranking Taiwan as the highest-exposure national equity market in the world for artificial intelligence revenue capture. The report, built from analysis of nearly 2,000 business categories, assigns Taiwan a 53% net AI-enabled revenue share under a moderate disruption scenario, a figure that dwarfs the next-closest markets and lands as the TWSE has already gained 18.2% year-to-date. With AI capital expenditure accelerating across hyperscalers and semiconductor supply chains, institutional investors are actively mapping which country-level equity exposures convert AI spending into revenue gains and which face structural displacement. What follows breaks down HSBC’s full country-level findings, explains the semiconductor mechanics behind Asia’s lead, examines which markets face the steepest disruption risk, and surfaces how rival institutions are responding for portfolio positioning.
Taiwan: 53% net AI-enabled revenue share, the highest of any national equity market assessed by HSBC under its moderate disruption scenario.
The gap between Asia’s semiconductor economies and the rest of the top five is not incremental. Taiwan at 53% and South Korea at 33% sit in a different tier from Hong Kong (16%), the United States (15%), and Mainland China (14%). These are net figures, meaning they already account for revenue displaced by AI within each market, not just gross gains.
Market performance through 8 May 2026 reflects the gap in real capital flows. TSMC is up 25% year-to-date, SK Hynix has gained 28%, and Samsung Electronics has added 20%.
Reuters reporting on Asia’s AI equity flows through early May 2026 documented leveraged retail buying in South Korea alongside institutional rotation into Taiwanese semiconductor names, a pattern consistent with the capital movement implied by TWSE’s 18.2% year-to-date gain and KOSPI’s 14.7% advance.
| Market | Net AI Revenue Share | YTD Equity Index Performance |
|---|---|---|
| Taiwan | 53% | TWSE +18.2% |
| South Korea | 33% | KOSPI +14.7% |
| Hong Kong | 16% | — |
| United States | 15% | — |
| Mainland China | 14% | — |
The divergence between Taiwan and South Korea at the top and the clustered mid-teens below them suggests that semiconductor-heavy market structures command a premium in AI revenue capture that diversified or services-heavy indices cannot replicate.
Taiwan and South Korea did not arrive at the top of the rankings incidentally. Their positions are structurally determined by the companies that dominate their equity indices.
TSMC controls the most advanced chip fabrication nodes that power AI model training and inference. Its $10 billion CoWoS AI packaging partnership with NVIDIA, announced in November 2025, is a direct supply chain link: every large language model deployed on NVIDIA hardware runs through Taiwanese fabrication capacity. SK Hynix holds a parallel position in high-bandwidth memory (HBM), the memory architecture that AI accelerators require for throughput. Its $5 billion commitment to a U.S.-based HBM plant in January 2026 reinforces rather than dilutes South Korea’s equity-level exposure.
HSBC’s own findings confirm the pattern. Semiconductors and technology hardware rank as top-tier beneficiaries across both disruption scenarios, which is why markets weighted toward these sectors register net positive figures while services-heavy economies diverge.
The AI hardware capex cycle is operating at a scale that structurally links hyperscaler procurement budgets to semiconductor equity performance: major technology firms are projected to spend $600 billion to $750 billion on AI infrastructure in 2026, with hyperscaler infrastructure expenditure forecast to expand from 50% of operating cash flow in 2024 to 90% by 2027.
Public investment in both markets is compounding the private-sector thesis:
The policy layer adds durability to the commercial thesis. Whether the AI capex cycle sustains or moderates, government-backed capital programmes in both economies are designed to maintain semiconductor investment through cyclical downturns.
South Korea’s K-AI semiconductor investment programme, as reported in March 2026, commits government capital alongside Samsung and SK Hynix under a coordinated industrial policy designed to sustain chip sector investment regardless of near-term demand fluctuations, adding a policy durability layer that purely commercial capex projections do not capture.
HSBC’s framework assessed close to 2,000 distinct business lines using the FactSet Revere Business Industry Classification System (RBICS), a standardised taxonomy that categorises company revenue by specific activity. A GPT-5-based model then scored each category for AI exposure, classifying approximately 300 of those lines as AI-related. The RBICS framework groups each company’s revenue into granular business categories, enabling country-level aggregation by weighting each market’s index composition against its AI-affected revenue share.
The report operates under two scenarios:
SaaS displacement mechanics are central to understanding why HSBC’s moderate disruption scenario produces the country-level rankings it does: the $1 trillion loss in US enterprise software market capitalisation recorded in February 2026 illustrates precisely the type of per-seat licensing erosion that HSBC’s model treats as the primary revenue-displacement channel before extending to financial services and healthcare software under the large disruption case.
Net figures in both scenarios account for revenue gains and losses within each market. Taiwan’s 53% is not an upside-only projection; it reflects the composite after disruption losses are subtracted.
BlackRock fund managers praised the methodology as a “breakthrough” but flagged scenario sensitivity, according to the Financial Times (10 May 2026).
That sensitivity matters. Morningstar estimates only a 40% probability for the moderate disruption scenario that underpins HSBC’s baseline, according to Reuters (10 May 2026). The rankings are contingent, not deterministic, and readers should calibrate how much weight to assign the headline figures accordingly.
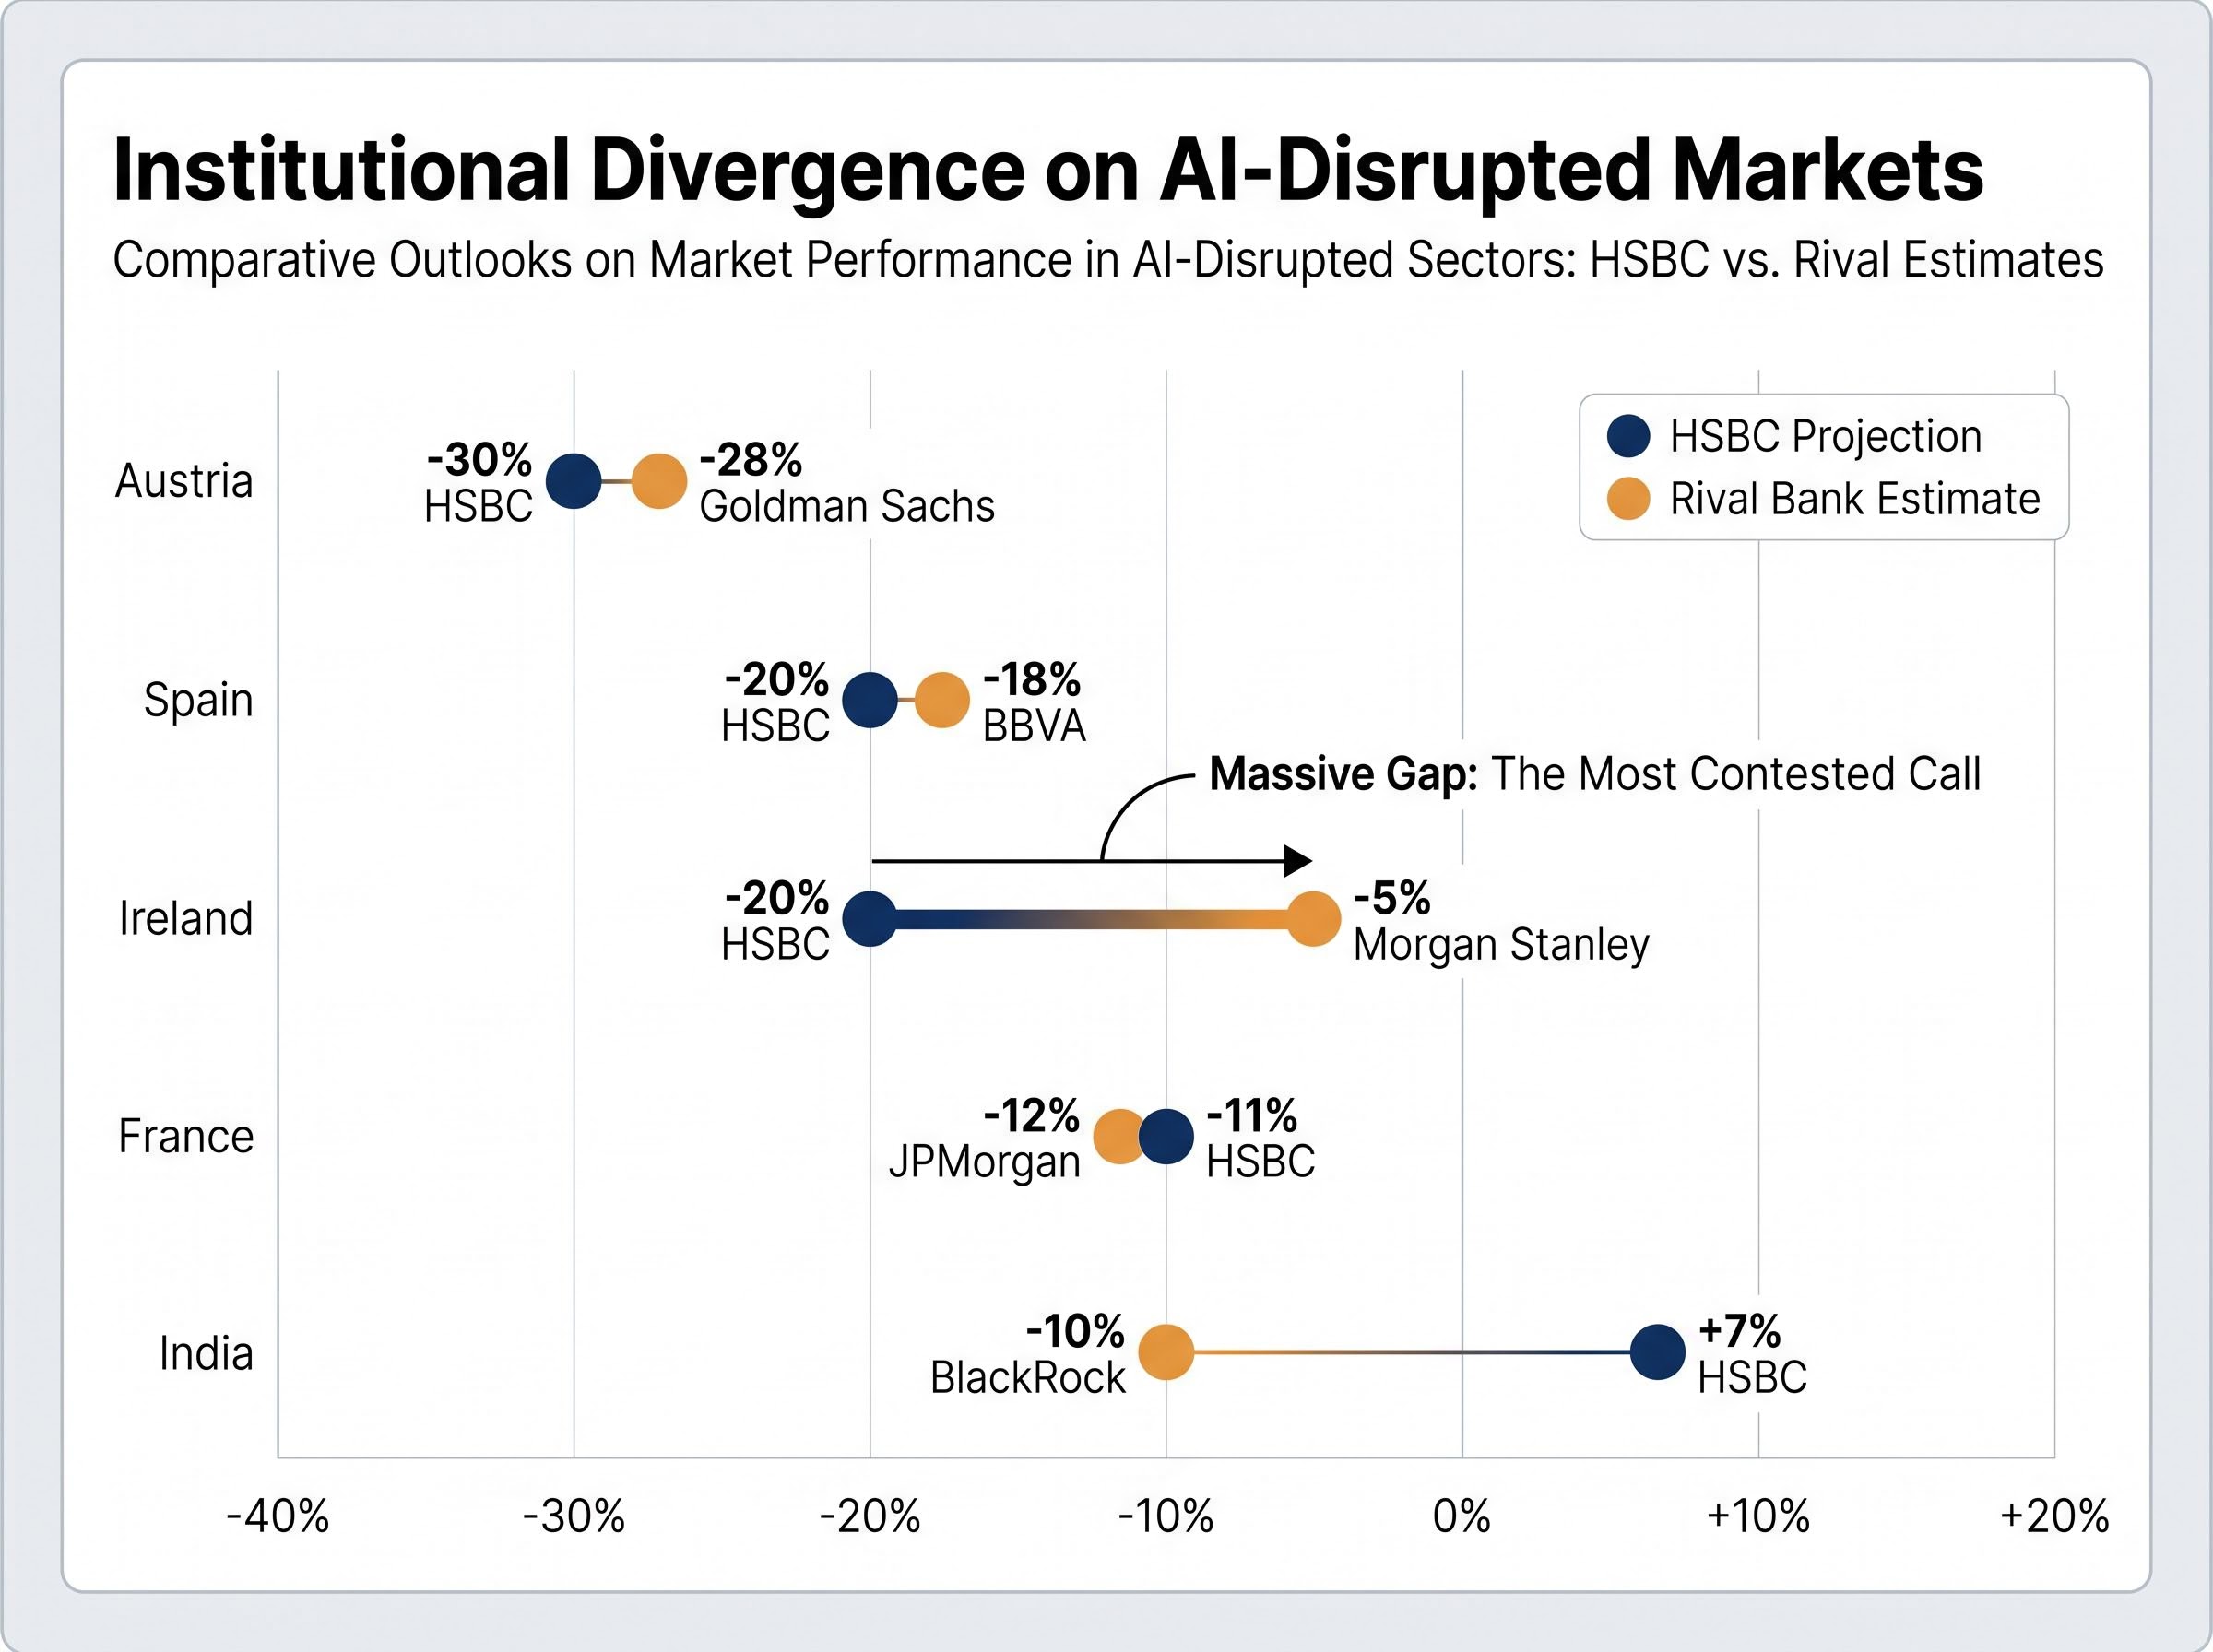
Austria faces the steepest projected loss at -30% under the large disruption scenario, a figure Goldman Sachs echoed at -28% in February 2026, driven by manufacturing automation exposure. Spain follows at -20%, with BBVA Research projecting -18% in December 2025 for banking and tourism sectors. The IBEX 35 has gained just 5% year-to-date in 2026, lagging the broader AI beneficiaries.
Ireland is the most contested country-level call in institutional research. HSBC projects -20%, but Morgan Stanley revised its estimate sharply to -5% in April 2026, citing pharmaceutical sector resilience and data-centre growth from U.S. hyperscalers. Jefferies also described HSBC’s Ireland figure as “overly punitive” given the data-centre boom, according to Bloomberg (10 May 2026). France sits at -11% in HSBC’s assessment, with JPMorgan projecting -12% for the CAC 40 in January 2026, identifying luxury and auto sectors as most vulnerable.
| Market | HSBC Projection | Rival Bank Estimate | Most Vulnerable Sector |
|---|---|---|---|
| Austria | -30% | Goldman Sachs: -28% | Manufacturing |
| Spain | -20% | BBVA Research: -18% | Banking, Tourism |
| Ireland | -20% | Morgan Stanley: -5% | Financial Services |
| France | -11% | JPMorgan: -12% | Luxury, Auto |
| India | 7% net disrupted | BlackRock: -10% IT drag | IT Services, BFSI |
India’s disruption risk operates on a different mechanism from Europe’s. HSBC assigns India a 7% net AI-disrupted revenue share under the moderate scenario, driven primarily by IT services and financial services outsourcing (BFSI) automation vulnerability rather than the broad financial-system displacement that defines Europe’s large-disruption losses.
BlackRock’s Q2 2026 outlook projects a -10% drag from AI automation on Indian IT services, citing Infosys specifically. JPMorgan takes a more moderate view at -5%, suggesting the India call is also contested among institutional researchers. The Nifty 50 has gained 8% year-to-date versus the TWSE’s 18.2%, a performance gap consistent with the structural divergence the research identifies.
HSBC itself identified Latin America and Central and Eastern Europe as low AI-exposure regions, alongside Energy, Materials, and Utilities as the sector-level equivalents. Several institutional fund managers have translated that finding into active allocation rationale.
Amundi notes Poland and Romania trade at a price-to-earnings ratio of approximately 8x versus Taiwan’s 25x, a valuation gap that makes the hedging case quantitatively concrete, not just conceptually appealing.
For investors already holding AI-exposed Asia positions, these low-correlation markets offer a portfolio construction tool with measurable valuation support rather than a vague diversification gesture.
Five major banks now converge on the same directional finding. Ranked by their Taiwan AI exposure estimates:
This degree of cross-institutional agreement on a single country-level equity thesis is uncommon. It reduces the risk that HSBC’s findings represent an outlier analytical view.
Asian semiconductor valuations carry a structural asymmetry that the headline index gains partly obscure: the MSCI AC Asia Pacific IT Index traded at a forward P/E of approximately 12x in early May 2026, roughly half the Nasdaq 100’s multiple, despite earnings growth forecasts running nearly three times faster than US peers, a gap that several institutional strategists now characterise as the primary rerating catalyst in the sector.
The qualification remains material. Morningstar estimates only a 40% probability for the moderate disruption scenario that produces these headline figures, according to Reuters (10 May 2026). The full 53% Taiwan uplift is scenario-dependent, and investors should size positions with that conditionality in view. Geopolitical risk surrounding Taiwan adds a further layer that no revenue-exposure model captures.
TSMC supply chain concentration is simultaneously the source of Taiwan’s 53% net AI revenue advantage and the most frequently cited geopolitical risk in institutional research: Apple’s early-stage discussions with Samsung Foundry and Intel Foundry Services reflect how even TSMC’s largest non-hyperscaler customer is actively modelling scenarios in which Taiwanese fabrication capacity becomes inaccessible.
The convergence across Goldman Sachs, Morgan Stanley, JPMorgan, BlackRock, and HSBC strengthens the analytical foundation. It does not eliminate the macro and geopolitical variables that sit outside every model’s scope.
HSBC’s 10 May report establishes Taiwan and South Korea as the most data-supported AI equity plays globally, underpinned by a methodology now corroborated across five major institutions. The semiconductor supply chain logic is structural, reinforced by government capital programmes in both markets, and consistent with year-to-date equity performance.
Live debates remain. Ireland’s disruption estimate diverges by 15 percentage points between HSBC and Morgan Stanley. India’s magnitude is contested between BlackRock and JPMorgan. The 40% scenario probability from Morningstar applies to every headline figure in the report.
For investors managing AI-driven volatility, HSBC itself identifies Latin America and Eastern Europe as the portfolio complement, with institutional fund managers already acting on that signal at measurable valuation discounts.
Investors with international equity mandates may benefit from reviewing current country-level AI revenue exposure against the HSBC framework, evaluating how semiconductor-heavy positions in Taiwan and South Korea compare with existing allocations to disruption-vulnerable European or services-heavy emerging market indices.
This article is for informational purposes only and should not be considered financial advice. Investors should conduct their own research and consult with financial professionals before making investment decisions. These projections are scenario-dependent and subject to change based on market developments, geopolitical conditions, and the pace of AI adoption.
HSBC's AI equity framework is a research model that assessed nearly 2,000 business categories using the FactSet RBICS taxonomy and a GPT-5-based scoring system to determine each country's net AI-enabled revenue share, accounting for both revenue gains and losses caused by AI disruption.
Taiwan ranks highest because TSMC dominates the most advanced chip fabrication nodes required for AI model training and inference, giving the Taiwanese equity index outsized exposure to AI semiconductor revenue; HSBC assigns Taiwan a 53% net AI-enabled revenue share under its moderate disruption scenario.
Austria faces the steepest projected loss at -30% under HSBC's large disruption scenario, driven by manufacturing automation exposure, followed by Spain at -20% due to banking and tourism sector vulnerability, and Ireland at -20%, though Morgan Stanley contests that figure with a much milder -5% estimate.
Investors use low AI-exposure markets such as Brazil, Mexico, Chile, Poland, and Romania as portfolio hedges because their equity indices carry low AI beta, trade at significant valuation discounts relative to Asia-Pacific semiconductor names, and offer diversification against AI-driven volatility concentrated in semiconductor-heavy markets.
Morningstar estimates only a 40% probability for the moderate disruption scenario that underpins HSBC's headline country rankings, meaning investors should treat the 53% Taiwan figure and related projections as scenario-dependent rather than deterministic outcomes.