
Tesla’s $145 to $4,600 Gap and What It Teaches About Valuation
4 mins ago

Tesla trades at roughly 189 times forward earnings on a $1.47 trillion market cap, yet its most bearish analyst target implies the stock is worth less than one-third of that figure. Both positions are held by credentialed professionals looking at the same data. That gap is not noise. It is the entire lesson.
With Tesla’s Q1 2026 results now public (revenue of $22.4 billion, gross margin of 21.7%, earnings per share of roughly $0.41), investors face a question that applies to any company in transition: is the current price paying for what the business is, or what it might become? That question sits at the heart of practical stock valuation analysis, and Tesla in May 2026 is the most vivid live case study available. This guide walks through the methodology of building bull and bear case scenarios from actual numbers, shows how dramatically different assumptions about growth, margins, and valuation multiples translate into different return outcomes, and explains why the price paid at entry may be one of the most consequential variables in any investment, regardless of whether the underlying company ultimately succeeds.
At the headline level, Tesla’s Q1 2026 looked strong. Earnings per share came in at approximately $0.40, beating the $0.35 consensus. Gross margin reached 21.7%, well above the 17% analysts had expected. Revenue of $22.4 billion marked a 16% year-over-year increase.
None of that resolved the core valuation question.
Tesla currently carries a forward price-to-earnings multiple of approximately 188.68x and a market capitalisation of roughly $1.47 trillion, despite trailing twelve-month net income of just $3.86 billion. The stock sits approximately 13.24% below its 23 December 2025 all-time high of $491.97. The disconnect between strong quarterly execution and an extreme premium multiple exists because investors cannot agree on what Tesla is.
Three competing frameworks are in active use:
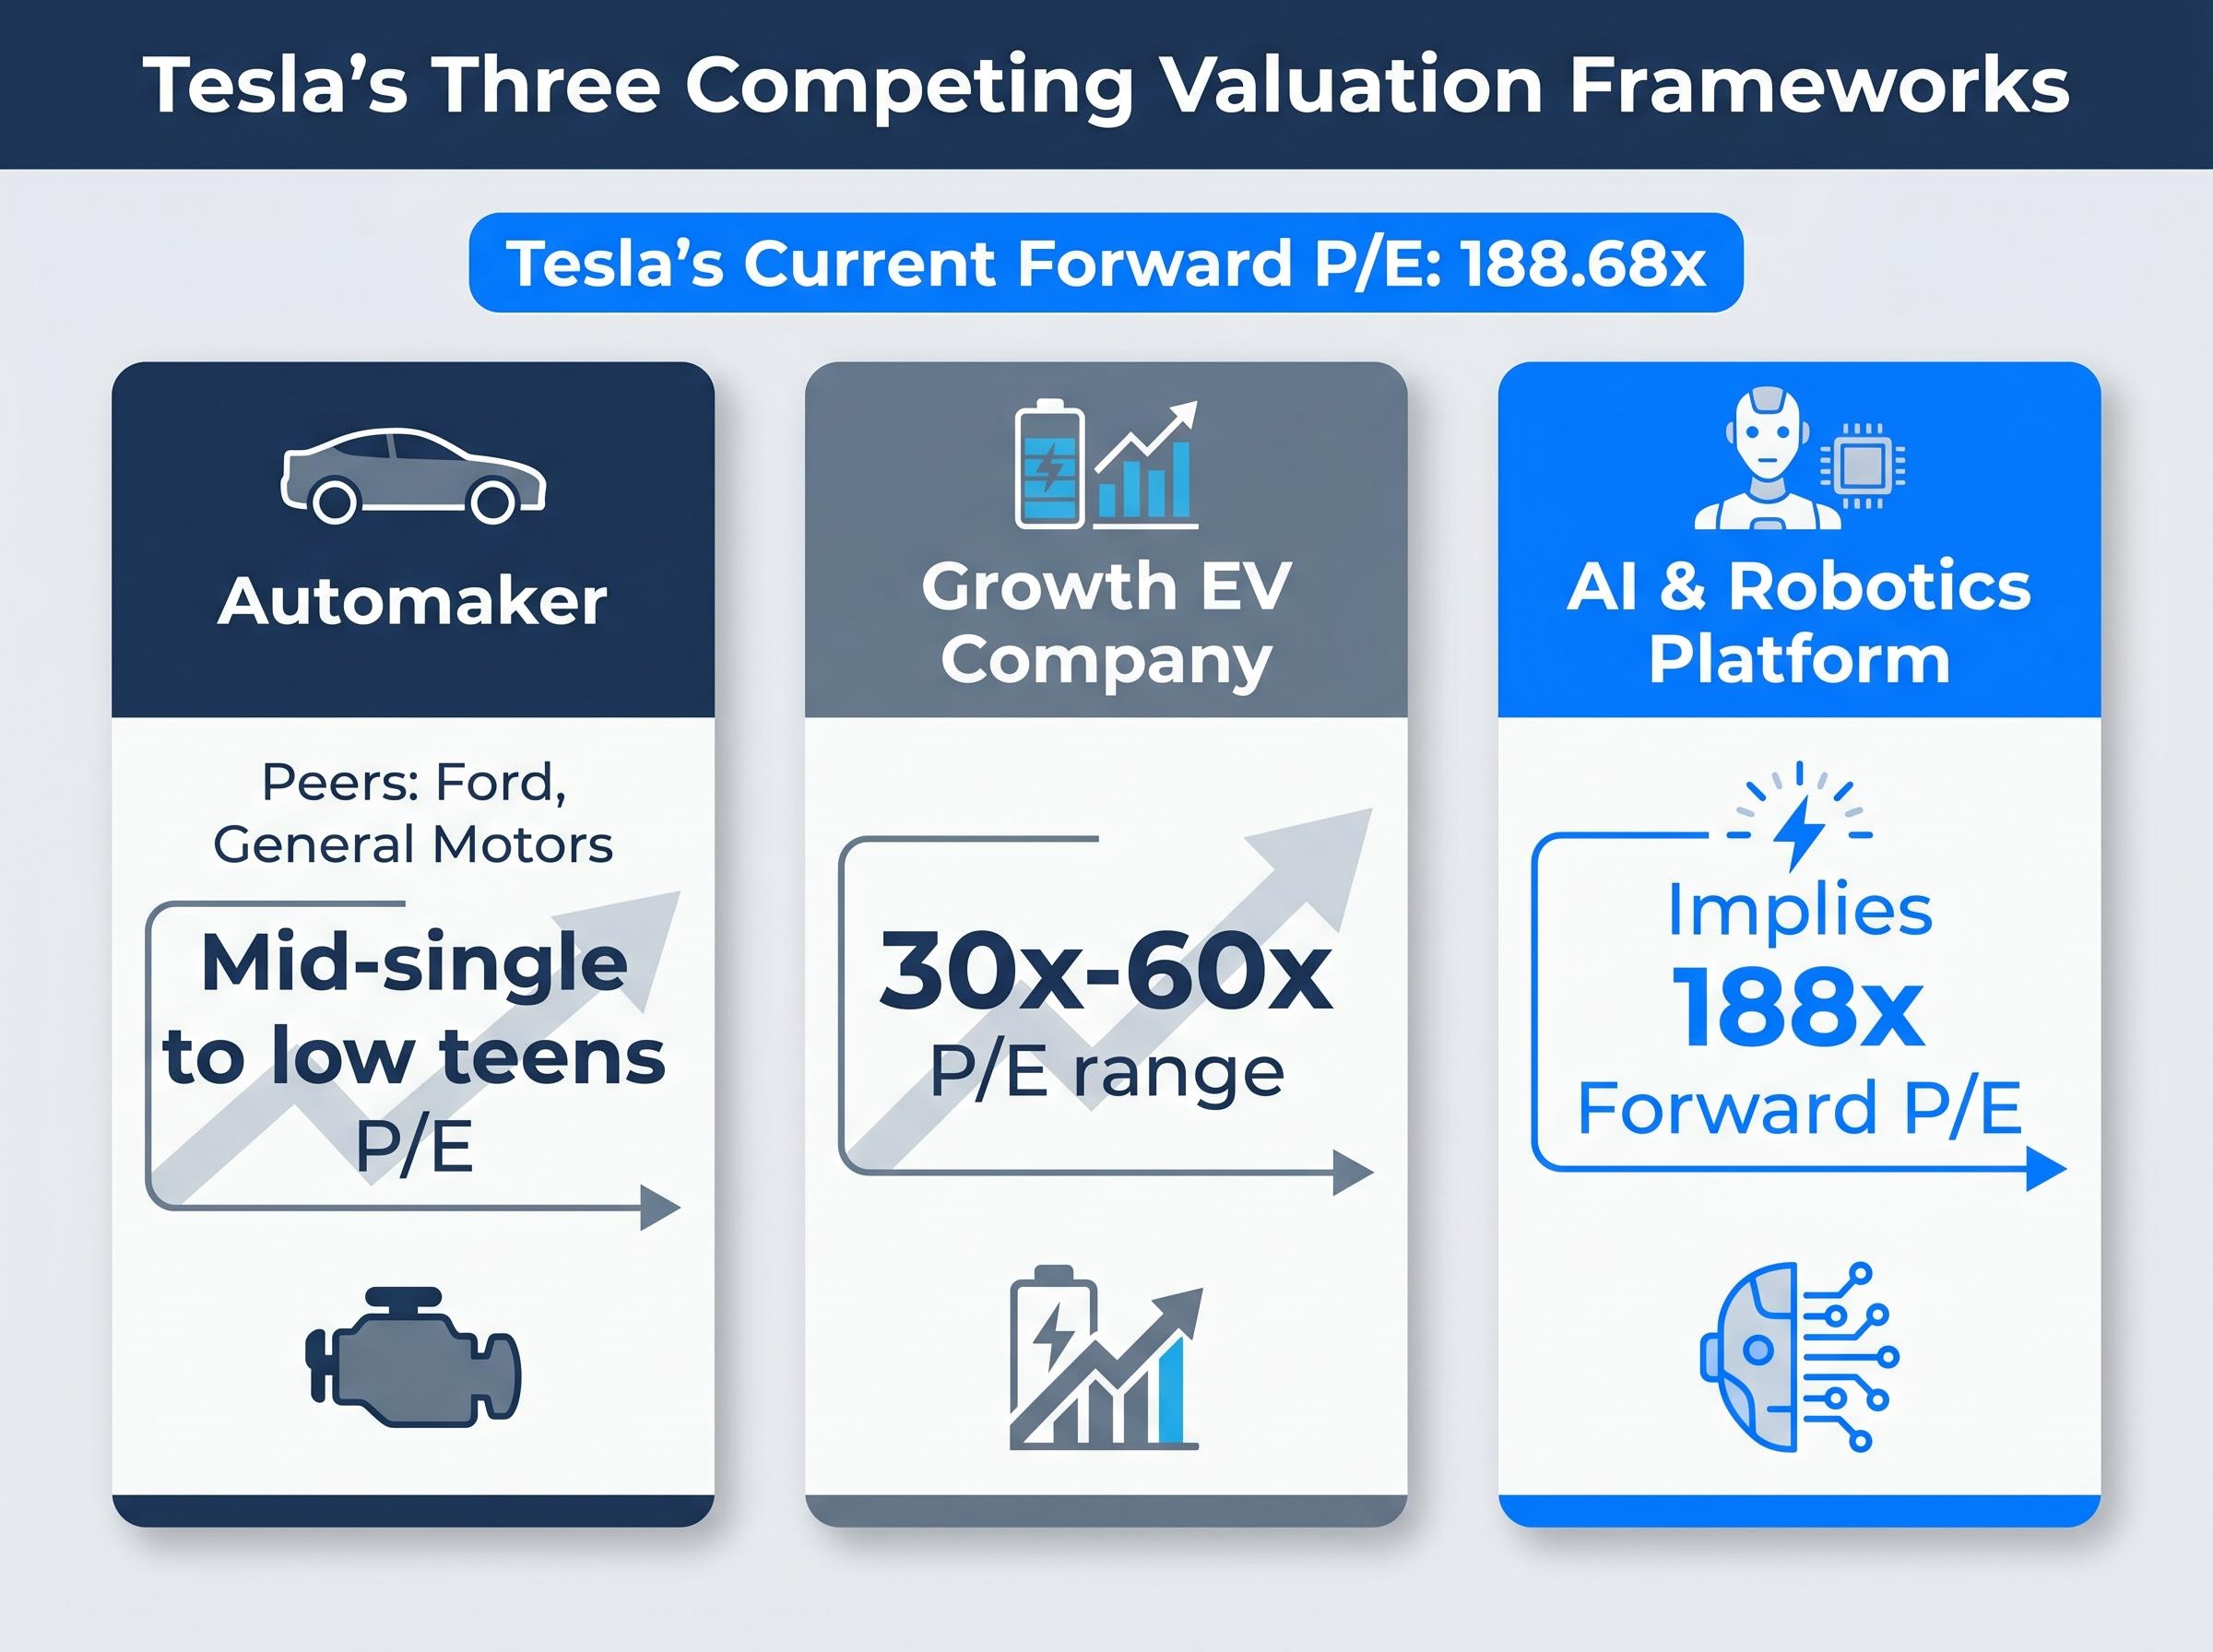
At a forward P/E of 188.68x, the market is not paying for what Tesla earned. It is paying for what Tesla might become.
The extreme multiple Tesla carries does not exist in isolation from broader US equity valuation conditions; the Buffett Indicator stood at 223.6% as of 1 May 2026, a level that has historically preceded periods of compressed forward returns across the market, adding a macro layer to the stock-specific multiple risk any Tesla investor is already accepting.
When a company’s narrative is transitioning between identities, standard backward-looking metrics like trailing P/E or price-to-sales describe the business that existed, not the one the market is pricing. BYD surpassing Tesla as the world’s largest EV producer by volume adds competitive context that further complicates the automaker framing. Any investor evaluating a company mid-transition faces this same identity problem, and recognising it is the first practical skill this guide builds.
Scenario-based valuation constructs multiple distinct futures, each with its own set of assumptions, and then calculates the implied stock price and annualised return for each. Rather than relying on a single analyst price target, the method forces investors to make their assumptions explicit and testable.
The process follows three sequential steps:
The most consequential discipline in this process is keeping these three inputs separate. Conflating optimistic growth with optimistic margins and an optimistic multiple creates compounding errors that can produce nonsense outputs.
Experienced practitioners treat the three variables as scenario constraints rather than independent dials: a 35% annual revenue growth assumption logically constrains the plausible margin range because the capital intensity required to sustain that growth typically suppresses near-term profitability, and both together constrain the multiple the market is likely to award at exit.
Bull and bear cases often fail because investors unconsciously pair their optimistic growth assumption with an optimistic margin assumption and an optimistic multiple simultaneously. Each layer of optimism compounds the one before it, inflating the output far beyond what any single assumption alone would produce.
Isolating each variable while holding the others constant reveals which input is actually doing the most work in driving the return outcome. For Tesla, the starting earnings baseline is an annualised EPS run-rate of approximately $1.60-$1.80. Forward analyst estimates project EPS growing more than 5x from current levels, which sets the scale of what the bull case is pricing in. The analysis that follows uses a 10-year projection horizon.
| Input | Bear Case Range | Bull Case Range | What It Captures |
|---|---|---|---|
| Revenue growth rate | 6%-12% annually | 20%-35% annually | How large the business becomes |
| Net profit margin | 8%-14% | 20%-30% | How much revenue converts to earnings |
| Exit valuation multiple | 18x-22x earnings | 25x-35x earnings | What the market pays per dollar of earnings at exit |
This methodology applies to any stock, not just Tesla. Investors who can separate the three variable inputs and test each independently hold a more reliable toolkit than those who rely on a single analyst price target.
The bull case for Tesla rests on a specific set of conditional statements, not sentiment. Revenue growth of 20%-35% annually, net profit margins expanding to 20%-30% (from a current 7%-10% range), and exit multiples of 25x-35x earnings at the end of a 10-year projection period would, if all three materialise, produce estimated annualised returns of approximately 11%-35%.
Wedbush’s Dan Ives maintains a $600 price target and has characterised 2026 as “the AI chapter taking hold” for Tesla. That thesis requires several specific execution milestones to deliver.
The operational checkpoints the bull case depends on:
Elon Musk has stated that Optimus could account for approximately 80% of Tesla’s long-term value. That single assumption does more work in the bull case than any other variable.
The bull case midpoint revenue growth assumption of approximately 27% annually is achievable for a company of Tesla’s scale only if these new business lines deliver at or near their announced targets. Understanding what a bull case requires in operational terms, rather than simply accepting a price target, helps investors evaluate whether new developments strengthen or weaken the thesis over time.
These forward-looking projections are speculative and subject to change based on market developments and company performance.
The bear case does not require Tesla to fail. It requires only that the transformation proceeds more slowly than the current price implies.
Under bear case assumptions, revenue grows at 6%-12% annually (midpoint approximately 9%), net profit margins settle at 8%-14%, and the exit multiple compresses to 18x-22x earnings. These figures would value Tesla as a premium automaker, arguably the best-positioned EV manufacturer in the world, just not an AI platform.
Even these bear case assumptions are generous relative to traditional automakers. Ford and General Motors trade at single-digit P/E ratios. A 20x exit multiple still awards Tesla a meaningful premium over every legacy competitor.
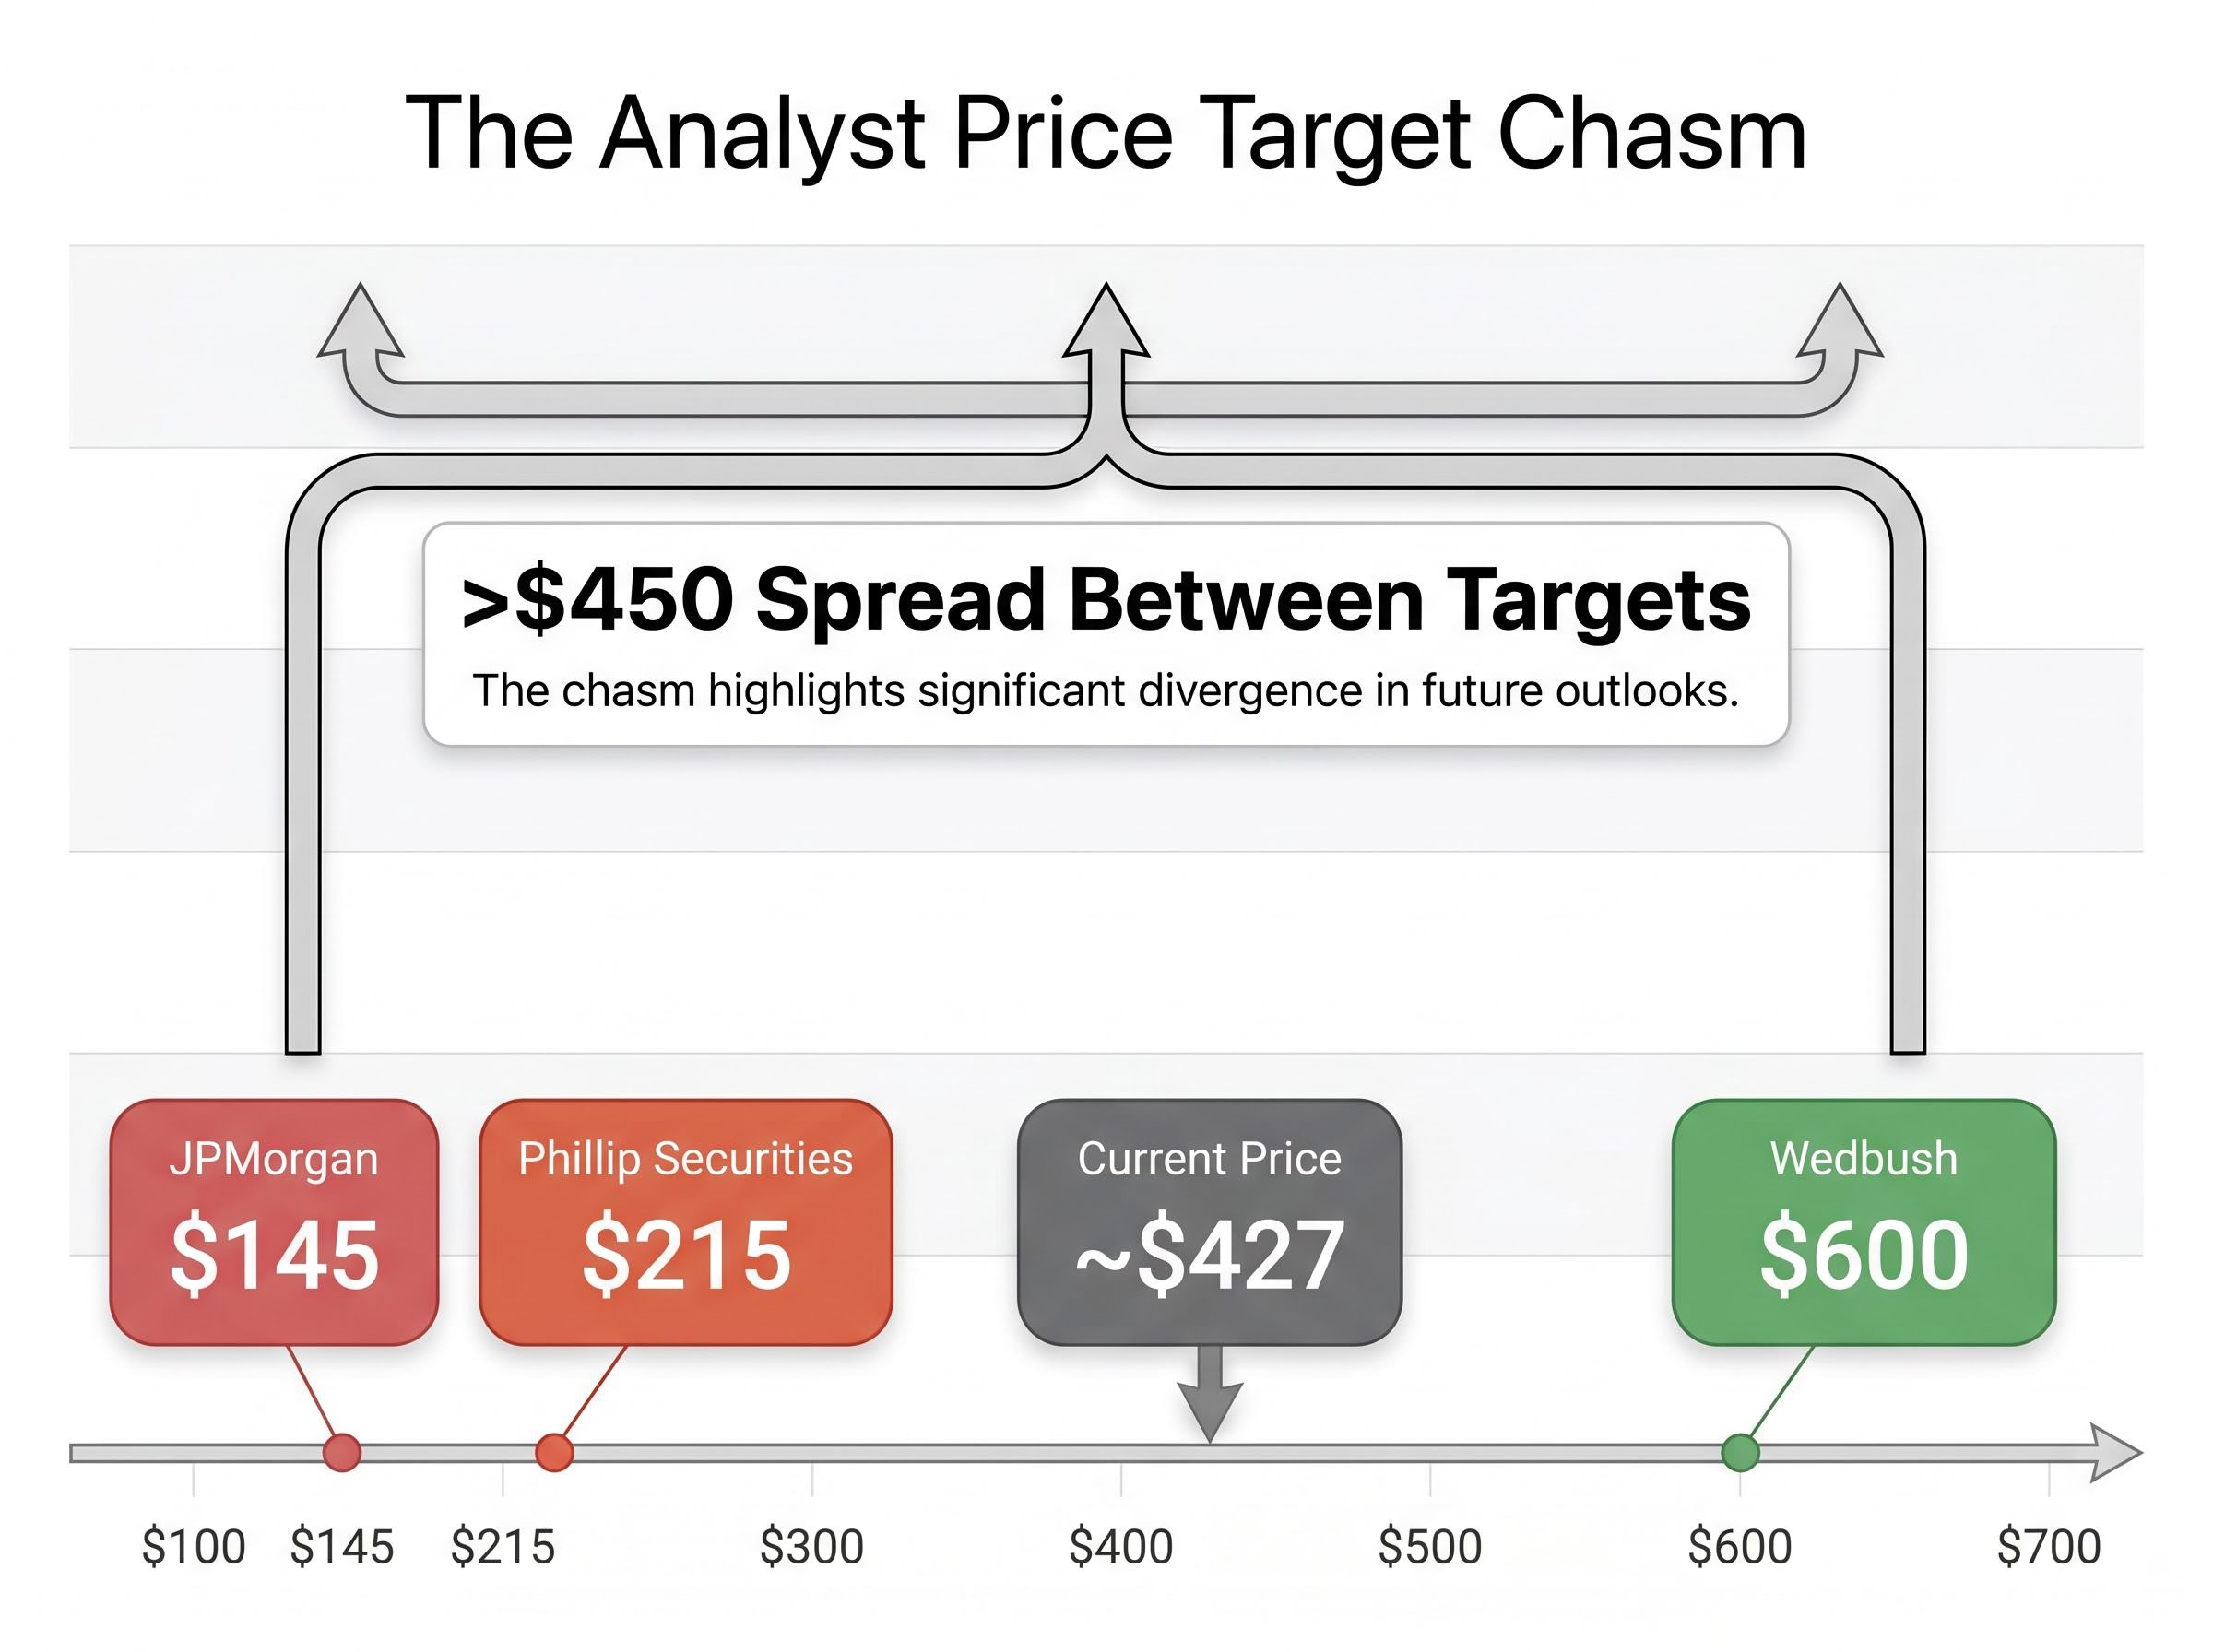
At the approximate reference price of $375 used in the research, every projected return outcome under the bear case was negative. At the current price near $427, the mathematics are more severe still. JPMorgan maintains a $145 price target; Phillip Securities targets $215, both issued after Q1 2026. The spread between the most bullish target ($600) and the most bearish ($145) exceeds $450 per share.
That gap is not analyst disagreement about accounting. It is disagreement about which future is more probable.
Capital expenditure expected to exceed $25 billion in 2026 will generate substantial negative free cash flow during the transformation period, adding financial pressure regardless of which scenario ultimately unfolds.
Management timeline guidance deserves calibration against delivery history. Three data points are relevant:
In 2016, Tesla claimed its vehicles had the hardware necessary for full self-driving capability. In 2019, Elon Musk predicted one million robotaxis on the road by 2020. In 2021, Optimus was announced with near-term deployment targets that were not met.
None of these misses invalidate the long-term thesis. They do, however, provide concrete calibration data for how to weight management timelines when building a bear case. California has no commercial autonomous vehicle permit filings from Tesla as of the current reporting period. Waymo has been operating commercial unsupervised ride-hailing for years with substantially more accumulated real-world operational data.
Investors building a probability-weighted model can use this history not as a dismissal but as a discount rate on announced timelines.
| Assumption Variable | Bear Case | Bull Case | Current Run-Rate |
|---|---|---|---|
| Revenue growth (annual) | 6%-12% | 20%-35% | ~16% (Q1 2026 YoY) |
| Net profit margin | 8%-14% | 20%-30% | ~7%-10% |
| Exit multiple (P/E) | 18x-22x | 25x-35x | ~188.68x forward |
Consider two investors who both believe Tesla will successfully execute its AI and autonomy transformation. One purchased shares at approximately $100 a few years prior. The other buys at approximately $427 today.
Both hold the same directional thesis. Their return outcomes will be dramatically different.
The investor who entered at $100 has already absorbed more than 4x appreciation. Even if the bull case only partially delivers, the margin of safety built into that entry price protects the return. The investor entering at $427, with the stock already trading at 188.68x forward earnings, needs the full bull case, or something close to it, merely to generate a market-rate return over a decade.
This is the mathematical structure of the problem: a higher entry price means the company must grow into a larger future valuation to produce the same annualised return, compressing the margin of safety on every assumption in the model. Forward analyst EPS estimates project more than 5x growth from current levels, but this growth may already be reflected in the current multiple.
Reverse DCF methodology approaches the entry price question from the opposite direction: rather than projecting a future earnings stream and discounting it to today, it takes the current share price as an input and solves for the implied growth rate the market is already pricing, revealing whether that implied rate is realistic or requires near-perfect execution.
Post-Q1 price action reinforces the concern. Initial upside following the 22 April 2026 earnings release failed to sustain, with each bounce shallower than the last, suggesting the Q1 beat was largely anticipated rather than a genuine positive surprise.
Three questions every investor should ask about entry price before committing capital to any high-multiple transitional company:
At elevated multiples, being directionally right about a company’s future is not sufficient to generate strong returns if the market has already priced that future in.
This principle applies universally. Overpaying for a correct directional thesis is one of the most common ways sophisticated investors generate poor returns.
The Tesla valuation debate, as it stands in May 2026, distils into a three-part framework applicable to any transitional company:
The research underpinning this analysis places the most likely outcome between the two extremes: partial execution on autonomy and robotics while the core automotive business continues. Investors benefit from building their own probability-weighted view rather than adopting either the full bull or full bear framing wholesale.
The full analyst price target range, from $145 (JPMorgan) to $600 (Wedbush), illustrates legitimate professional disagreement driven entirely by scenario probability weighting. Tesla’s EPS estimates declined more than 90% from their prior peak before recovering in forward projections, a path complexity that any scenario model must account for.
This framework is not new. It would have served investors evaluating cloud infrastructure companies in 2015, when Amazon Web Services was growing at 70% annually but represented a fraction of Amazon’s total revenue, and the market was debating whether to value the company as a retailer or a platform. It would have applied to streaming in 2018, when Netflix traded at multiples that assumed global subscriber saturation years before it arrived. In each case, the question was identical: how much of an undelivered future has the market already priced, and what return does the current price require if execution partially disappoints?
The company changes. The framework does not.
For investors wanting to situate the Tesla AI platform thesis within the broader question of whether AI valuations across the market represent genuine earnings power or speculative excess, our deep-dive into the AI stock bubble debate applies four analytical frameworks including Minsky, Kindleberger, and Shiller CAPE to the current AI infrastructure spending cycle, covering the $705-725 billion combined capex commitments from Microsoft, Alphabet, Amazon, and Meta that form the demand backdrop any Tesla AI revenue projection must ultimately compete within.
This article is for informational purposes only and should not be considered financial advice. Investors should conduct their own research and consult with financial professionals before making investment decisions. Past performance does not guarantee future results. Financial projections are subject to market conditions and various risk factors.
Scenario-based stock valuation analysis constructs multiple distinct futures for a company, each with explicit assumptions about revenue growth, profit margins, and exit valuation multiples, then calculates the implied share price and annualised return for each scenario rather than relying on a single price target.
Building a bull and bear case requires setting separate assumptions for three variables: annual revenue growth rate, net profit margin, and the exit price-to-earnings multiple. Keeping these inputs independent and stress-testing each one individually prevents compounding errors that inflate or deflate projected returns.
At a high entry price, the company must grow into a much larger future valuation just to generate a market-rate return, which compresses the margin of safety on every assumption in the model. An investor entering Tesla near $427 at roughly 189 times forward earnings needs the full bull case to materialise simply to match average market returns over a decade.
As of May 2026, analyst price targets for Tesla range from $145 (JPMorgan) to $600 (Wedbush), a spread of more than $450 per share driven entirely by different probability weightings assigned to the automotive, growth EV, and AI platform scenarios.
A reverse discounted cash flow (reverse DCF) takes the current share price as an input and solves for the implied growth rate the market is already pricing, revealing whether that growth expectation is realistic or requires near-perfect execution from the company.


